. 2021 Nov 2;37(5):109957.
doi: 10.1016/j.celrep.2021.109957.

Targeting glioblastoma signaling and metabolism with a re-purposed brain-penetrant drug

Affiliations

Targeting glioblastoma signaling and metabolism with a re-purposed brain-penetrant drug

Junfeng Bi et al. Cell Rep. .

Abstract

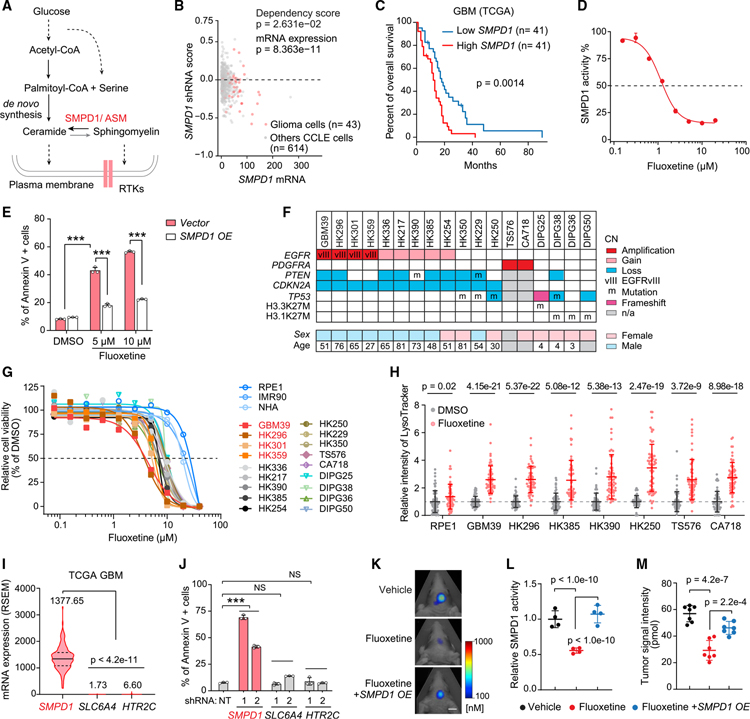
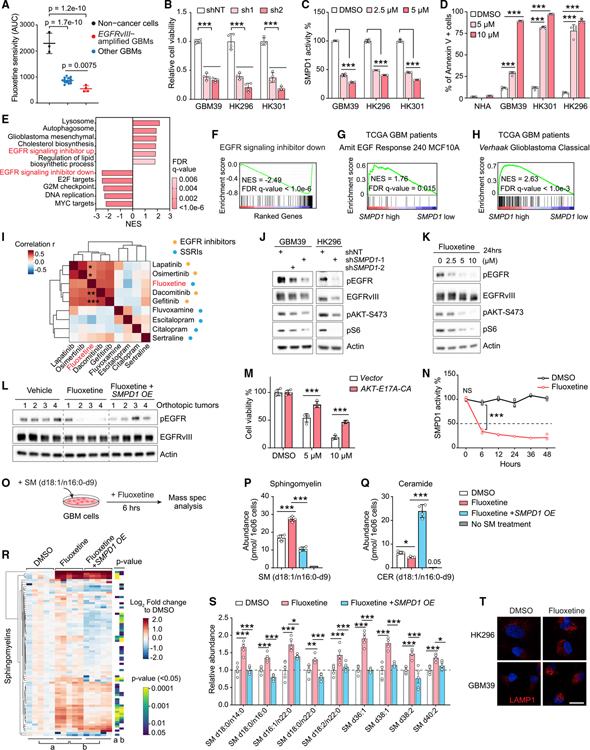
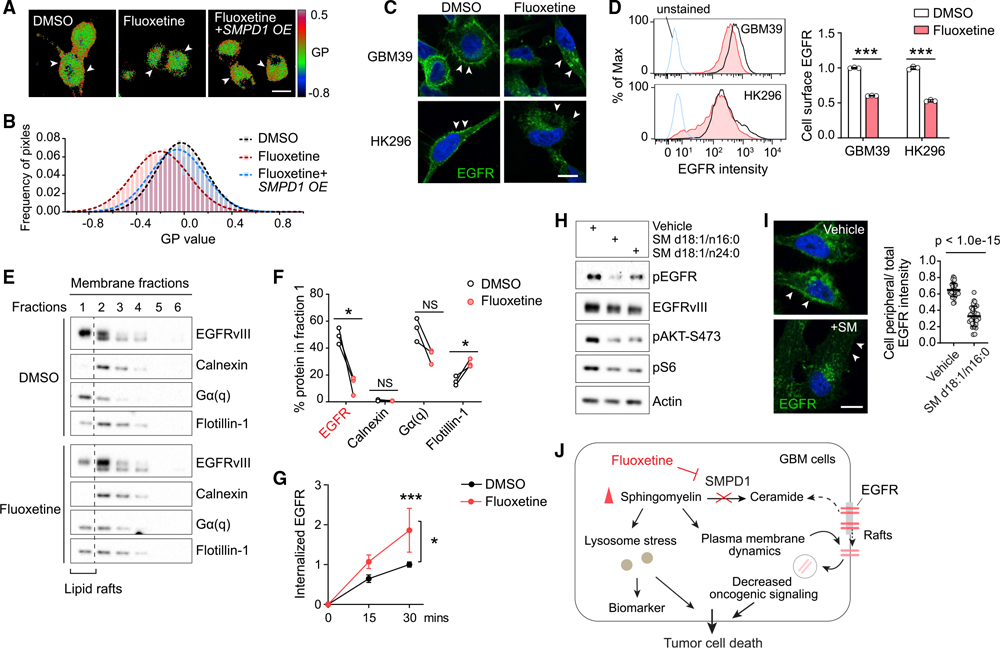
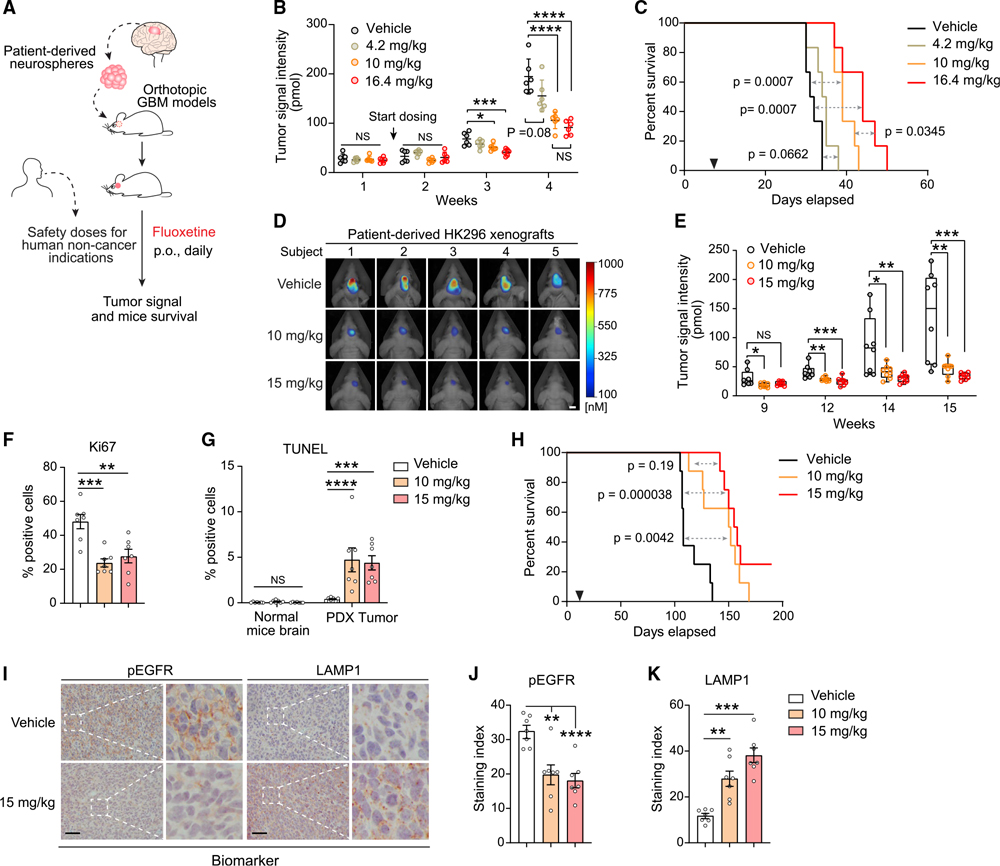
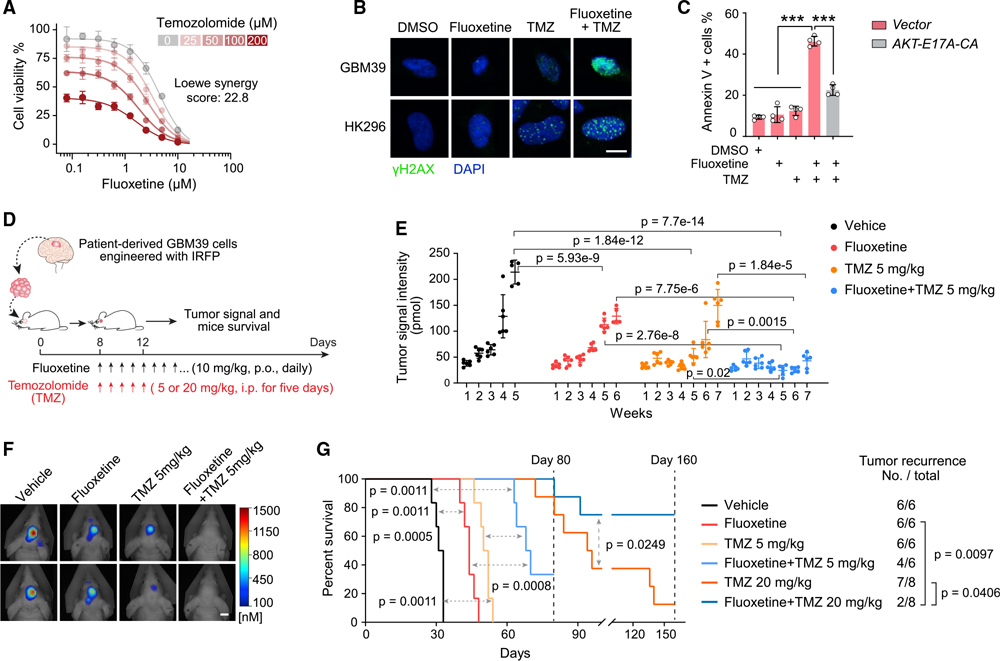
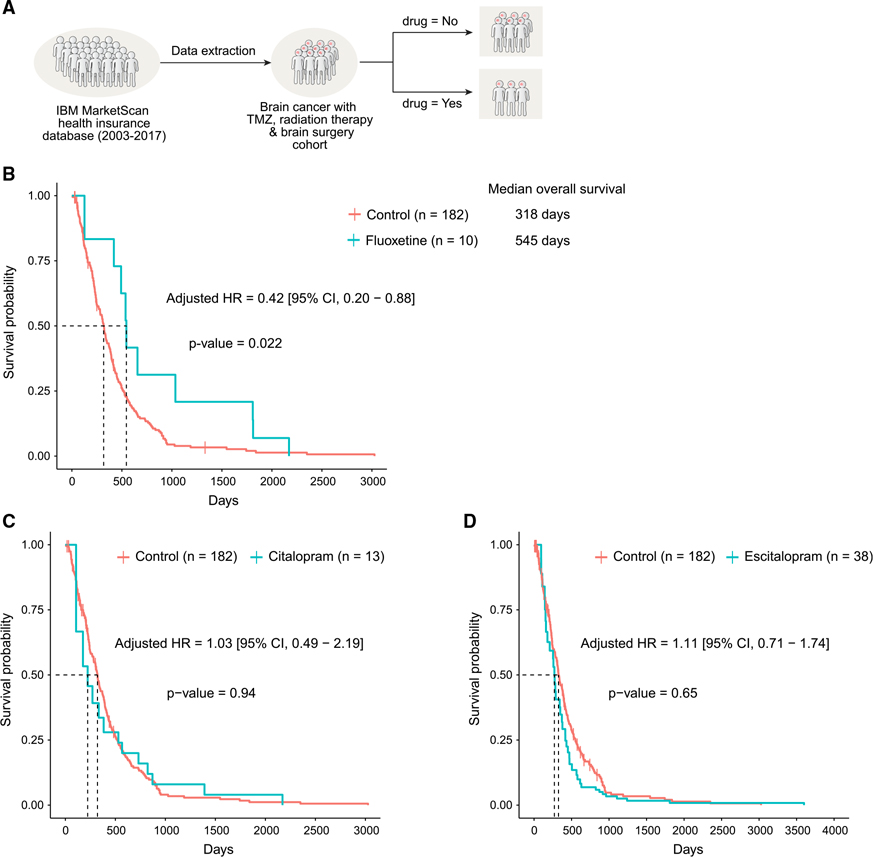
The highly lethal brain cancer glioblastoma (GBM) poses a daunting challenge because the blood-brain barrier renders potentially druggable amplified or mutated oncoproteins relatively inaccessible. Here, we identify sphingomyelin phosphodiesterase 1 (SMPD1), an enzyme that regulates the conversion of sphingomyelin to ceramide, as an actionable drug target in GBM. We show that the highly brain-penetrant antidepressant fluoxetine potently inhibits SMPD1 activity, killing GBMs, through inhibition of epidermal growth factor receptor (EGFR) signaling and via activation of lysosomal stress. Combining fluoxetine with temozolomide, a standard of care for GBM, causes massive increases in GBM cell death and complete tumor regression in mice. Incorporation of real-world evidence from electronic medical records from insurance databases reveals significantly increased survival in GBM patients treated with fluoxetine, which was not seen in patients treated with other selective serotonin reuptake inhibitor (SSRI) antidepressants. These results nominate the repurposing of fluoxetine as a potentially safe and promising therapy for patients with GBM and suggest prospective randomized clinical trials.

Keywords: EGFR signaling; Membrane lipids; SMPD1; combination therapy; electronic medical records; fluoxetine; glioblastoma; real-world evidence; sphingolipid metabolism.


Conflict of interest statement

Declaration of interests P.S.M. is co-founder of Boundless Bio, Inc. He has equity in the company, chairs the scientific advisory board, and serves as a consultant, for which he is compensated. P.S.M. is also consultant for Autobahn Therapeutics, Inc. and Sage Therapeutics. These consulting arrangements started after completion of this paper.

Figures

Figure 1.
Figure 1.. GBMs depend on SMPD1 for survival, making them sensitive to fluoxetine-mediated cell death
(A) Schematic pathway of sphingolipid metabolism in plasma membrane lipid remodeling of GBM cells. (B) shRNA effect scores and mRNA levels of SMPD1 in glioma and other CCLE cell lines from the DepMap dataset. (C) Kaplan-Meier analysis of overall survival of patients with high or low SMPD1 mRNA expression in the TCGA GBM (RNA sequencing [RNA-seq]) dataset. (D) Enzymatic activity of SMPD1 in U87EGFRvIII cells with 24-h fluoxetine treatment. (E) Percentage of Annexin V-positive U87EGFRvIII cells (n = 3). (F) Brief information, including major genomic features, of 18 patient-derived GBM neurosphere lines. (G) Cell viability curves of three non-cancer cell lines (NHA, RPE1, and IMR90) and 18 GBM neurosphere lines in response to fluoxetine treatment (n = 4). (H) LysoTracker staining in indicated cell lines (n = 60). (I) mRNA level (RNA Seq V2 RSEM) in TCGA GBM patient samples. (J) Percentage of Annexin V-positive U87EGFRvIII cells with indicated shRNA knockdown (non-targeting [NT]). (K–M) Representative tumor images (K), SMPD1 enzymatic activity (n = 4) (L), and tumor signal intensity (n = 7) (M) of U87EGFRvIII orthotopic xenograft models. Scale bar, 5 mm. Data represent mean ± SD, except (I). The median value (center line) and the 25th and 75th percentiles (dashed lines) are presented in (I). Two-tailed Student’s t test (B and H). Log rank test (C). ANOVA with Tukey’s multiple comparisons test (E, I, J, L, and M). ***p < 0.001. CN, copy number; n/a, not available; NS, not significant. See also Figures S1 and S2 and Table S1.
Figure 2.
Figure 2.. Fluoxetine’s inhibition of SMPD1 blocks oncogenic EGFR signaling in GBM cells
(A) Fluoxetine sensitivity (area under the cell viability curve) of 3 non-cancer cell lines and 18 patient-derived GBM neurospheres, including 4 EGFRvIII-amplified lines. (B) Relative cell viability of EGFRvIII-amplified GBM neurosphere lines with SMPD1 or non-targeting shRNAs (n = 4). (C) SMPD1 enzymatic activity in GBM neurospheres with 24 h of fluoxetine treatment (n = 4). (D) Percentage of Annexin V-positive cells in normal human astrocytes (NHAs) and GBM neurospheres (n = 4). (E and F) Gene set enrichment analysis identifies differentially enriched or depleted transcripts in three GBM neurosphere cultures treated with fluoxetine versus DMSO. (G and H) Gene set enrichment analysis of differentially expressed genes in TCGA GBM clinical samples (HUG133A) with high or low SMPD1 expression. (I) Drug sensitivity correlation of fluoxetine, 4 EGFR inhibitors, and 4 other SSRI antidepressants in 40 glioma cell lines from the DepMap dataset. (J) EGFR signaling in indicated GBM cells. (K) EGFR signaling in GBM39 cells with 24-h treatments. (L) EGFR phosphorylation in U87EGFRvIII orthotopic xenograft tumors. (M) Viability of GBM39 cells expressed vector or a constitutively active AKT E17A-CA allele (n = 4). (N) SMPD1 enzymatic activity in GBM39 cells treated with DMSO or 5 μM fluoxetine (n = 4). (O) Schematic of sphingomyelin (d18:1/n16:0-d9) metabolomics assay. (P and Q) Abundance of sphingomyelin (d18:1/n16:0-d9) (P) and ceramide (d18:1/n16:0-d9) (Q) in U87EGFRvIII cells with indicated treatment (n = 4). (R and S) Lipidomics analysis of endogenous sphingomyelins in U87EGFRvIII cells with 24 h of treatment and with SMPD1 overexpression (n = 5). Relative abundance of representative sphingomyelins is plotted in (S). (T) LAMP1 staining of GBM cells. Scale bar, 20 μm. Data represent mean ± SD, except for mean ± SEM in (S). Two-tailed Pearson (I). Two-tailed Student’s t test (R). ANOVA with Tukey’s multiple comparisons test (A–D, M, N, P, Q, and S). *p < 0.05, **p < 0.01, ***p < 0.001. See also Figures S2–S4.
Figure 3.
Figure 3.. By increasing sphingomyelin levels, fluoxetine causes loss of cell surface EGFR from membrane rafts with subsequent receptor internalization and degradation
(A and B) Laurdan imaging analysis of membrane lipid order in U87EGFRvIII cells at baseline, after fluoxetine treatment, and with overexpression of an SMPD1 construct. Generalized polarization (GP) images indicate higher membrane order (red) and lower membrane order (blue). Scale bar, 20 μm. (C and D) Imaging and flow cytometry analysis (n = 3) of cell surface EGFR in GBM cells. Scale bar, 10 μm. (E) EGFRvIII and marker proteins in the membrane fractions of GBM39 cells. Calnexin is a marker for non-lipid rafts fractions, while Gα(q) and Flotillin-1 are markers of lipid rafts. (F) Percentage of indicated protein levels in fraction 1, the lipid rafts fraction, which is absent with non-lipid rafts marker Calnexin and present with lipid raft markers Gα(q) and Flotillin-1. Data were normalized to total protein levels of all six fractions (n = 3). (G) Internalized EGFR of GBM39 cells by flow cytometry (n = 4). (H) EGFR signaling in GBM39 cells treated with sphingomyelins or vehicle. (I) EGFR staining in GBM39 cells with SM d18:1/n16:0 treatment. Scale bar, 10 μm. (J) Schematic model of the fluoxetine-SMPD1 axis in regulating sphingomyelin metabolism and oncogenic receptor signaling of GBM cells. Data represent mean ± SD. Two-tailed Student’s t test (D, F, and I). ANOVA with Tukey’s multiple comparisons test (G). *p < 0.05, ***p < 0.001. See also Figure S5.
Figure 4.
Figure 4.. Fluoxetine promotes tumor regression and prolongs survival of mice bearing patient-derived orthotopic GBMs
(A) Schematic of the fluoxetine treatment protocol in patient-derived GBM orthotopic xenograft mouse models. (B and C) Tumor signal intensity (B) and Kaplan-Meier survival analysis (C) of patient-derived GBM39 orthotopic xenograft models with vehicle or fluoxetine administration (n = 6, p.o., daily). Safety doses of fluoxetine for human non-cancer indications were converted to mouse doses based on body surface area. 4.2 and 16.4 mg/kg in mice are equal to the minimal and maximal suggested dose for human indications, respectively. (D and E) Representative tumor images at week 15 (D) and tumor signal intensity (E) of patient-derived HK296 orthotopic xenograft models with vehicle or fluoxetine administrations (n = 8, orally [p.o.], daily). Scale bar, 5 mm. The median value (center line), the minimum (min) and maximum (max) (whiskers), and the 25th and 75th percentiles (box perimeters) are presented. (F) Percentage of Ki67-positive cells in HK296 xenograft tumors. (G) Percentage of TUNEL-positive cells in HK296 xenograft tumors and surrounding mouse brains. (H) Kaplan-Meier survival analysis of mice bearing HK296 xenograft tumors (n = 8). (I–K) Immunohistochemistry analysis of two biomarkers, phosphorylated EGFR and LAMP1, in HK296 xenograft tumors. Scale bar, 50 μm. Data represent mean ± SD (B) or mean ± SEM (F, G, J, and K). ANOVA with Tukey’s multiple comparisons test (B, E–G, J, and K). Log rank test (C and H). *p < 0.05, **p < 0.01, ***p < 0.001, ****p < 0.0001. See also Figure S6.
Figure 5.
Figure 5.. Combining fluoxetine with temozolomide suppresses GBM recurrence and prolongs survival
(A) Synergistic effect of fluoxetine and temozolomide (TMZ) in U87EGFRvIII cells (n = 4). (B) γH2AX staining in GBM neurospheres. 2.5 μM for fluoxetine, and 50 μM for TMZ. Scale bar, 10 μm. (C) Percentage of Annexin V-positive U87EGFRvIII cells (n = 4). 2.5 μM for fluoxetine, and 50 μM for TMZ. (D) Schematic overview of the fluoxetine-TMZ combination therapy in patient-derived GBM39 orthotopic xenograft models. (E–G) Tumor signal intensity (E), representative tumor images at week 5 (F), and Kaplan-Meier survival analysis (G) of patient-derived GBM39 orthotopic xenograft models with indicated administrations (n = 6 or 8 mice per group). Scale bar, 5 mm. Data represent mean ± SD. ANOVA with Tukey’s multiple comparisons test (C and E). Log rank test for survival and Fisher’s exact test for tumor recurrence (G). ***p < 0.001. See also Figure S7.
Figure 6.
Figure 6.. Real-world electronic medical record evidence for efficacy and specificity: combining fluoxetine, but not citalopram or escitalopram, significantly prolongs survival of patients with brain tumor
(A) Outline of the strategy utilized for definition and enrichment of GBM patient cohort in electronic medical records from the IBM MarketScan dataset (2003–2017). (B–D) Survival curve of patients in the GBM-enriched cohort treated with fluoxetine (B) and two other SSRI antidepressants, citalopram (C) and escitalopram (D), using time-dependent Kaplan-Meier curves. The adjusted hazards ratio was obtained from the extended Cox proportional hazards model after adjusting for age, sex, and 6-month baseline comorbidities and using SSRI antidepressant treatment as a time-dependent variable. See also Figure S7 and Tables S2–S6.

References

    1. Andersen PK, and Gill RD (1982). Cox regression-model for counting-processes: a large sample study. Ann. Stat. 10, 1100–1120.
    1. Arkhipov A, Shan Y, Das R, Endres NF, Eastwood MP, Wemmer DE, Kuriyan J, and Shaw DE (2013). Architecture and membrane interactions of the EGF receptor. Cell 152, 557–569. - PMC - PubMed
    1. Bi J, Ichu TA, Zanca C, Yang H, Zhang W, Gu Y, Chowdhry S, Reed A, Ikegami S, Turner KM, et al. (2019). Oncogene amplification in growth factor signaling pathways renders cancers dependent on membrane lipid remodeling. Cell Metab. 30, 525–538.e8. - PMC - PubMed
    1. Bi J, Chowdhry S, Wu S, Zhang W, Masui K, and Mischel PS (2020). Altered cellular metabolism in gliomas - an emerging landscape of actionable co-dependency targets. Nat. Rev. Cancer 20, 57–70. - PubMed
    1. Bindea G, Mlecnik B, Hackl H, Charoentong P, Tosolini M, Kirilovsky A, Fridman WH, Pagè s F, Trajanoski Z, and Galon J (2009). ClueGO: a Cytoscape plug-in to decipher functionally grouped gene ontology and pathway annotation networks. Bioinformatics 25, 1091–1093. - PMC - PubMed

Publication types

MeSH terms