. 2021 Nov 2;37(5):109905.
doi: 10.1016/j.celrep.2021.109905.

FARP1, ARHGEF39, and TIAM2 are essential receptor tyrosine kinase effectors for Rac1-dependent cell motility in human lung adenocarcinoma

Affiliations

FARP1, ARHGEF39, and TIAM2 are essential receptor tyrosine kinase effectors for Rac1-dependent cell motility in human lung adenocarcinoma

Mariana Cooke et al. Cell Rep. .

Abstract

Despite the undisputable role of the small GTPase Rac1 in the regulation of actin cytoskeleton reorganization, the Rac guanine-nucleotide exchange factors (Rac-GEFs) involved in Rac1-mediated motility and invasion in human lung adenocarcinoma cells remain largely unknown. Here, we identify FARP1, ARHGEF39, and TIAM2 as essential Rac-GEFs responsible for Rac1-mediated lung cancer cell migration upon EGFR and c-Met activation. Noteworthily, these Rac-GEFs operate in a non-redundant manner by controlling distinctive aspects of ruffle dynamics formation. Mechanistic analysis reveals a leading role of the AXL-Gab1-PI3K axis in conferring pro-motility traits downstream of EGFR. Along with the positive association between the overexpression of Rac-GEFs and poor lung adenocarcinoma patient survival, we show that FARP1 and ARHGEF39 are upregulated in EpCam+ cells sorted from primary human lung adenocarcinomas. Overall, our study reveals fundamental insights into the complex intricacies underlying Rac-GEF-mediated cancer cell motility signaling, hence underscoring promising targets for metastatic lung cancer therapy.

Keywords: ARHGEF39; AXL; EGFR; FARP1; Rac-GEF; Rac1; TIAM2; lung cancer; migration; ruffles.


Conflict of interest statement

Declaration of interests The authors declare no competing interests.

Figures

Figure 1.
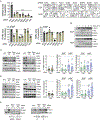
Figure 1.. Rac1-dependent, RhoG-independent growth factor-induced ruffle formation in lung adenocarcinoma cells
(A) A549 cells subjected to Rac1 CRISPR/Cas9 KO (clones 1 and 2) or scrambled CRISPR control cells (Scr) were stimulated with EGF (100 ng/mL, 5 min), HGF (100 ng/mL, 15 min), PDGF (100 ng/mL, 15 min), or PMA (100 nM, 30 min), fixed, and stained with rhodamine phalloidin. Upper, representative micrographs. Lower left, expression of Rac1 by western blot. Lower right, quantification of ruffle formation using ImageJ. Results are expressed as means ± SEMs of 3 individual experiments. *p < 0.05; ****p < 0.0001 versus single-guide RNA (sgRNA); ns, not significant. Scale bar, 10 μm. (B) Effect of RhoG RNAi silencing on growth factor-induced ruffle formation. Left, RhoG mRNA levels in RhoG-depleted cells, relative to non-target control (NTC). Center, representative micrographs of rhodamine-phalloidin stained cells. Right, quantification of ruffle formation. Results (means ± SEMs, n = 3) are expressed as percentage relative to NTC (dotted line). Scale bar, 10 μm. (C) Effect of LY294002 (PI3K inhibitor 20 μM), gefitinib (EGFR inhibitor, 3 μM), SU11247 (c-Met inhibitor, 5 μM), or Gö6983 (PKC inhibitor, 3 μM) on ruffle formation induced by EGF, HGF, or PMA. Results (means ± SEMs, n = 3) are expressed as percentage of response in the absence of inhibitor (dotted line). ***p < 0.001; ****p < 0.0001 versus no inhibitor. (D) Phospho-PAK levels in response to growth factor stimulation. A representative western blot and densitometric analysis of 3 independent experiments, normalized to β-actin (means ± SEMs, n = 3) is shown; ****p < 0.0001 versus sgRNA. (E) Phospho-PAK levels in A549 cells subjected to RhoG or NTC RNAi in response to growth factors. A representative western blot and densitometric analysis of 3 independent experiments, normalized to β-actin (means ± SEMs, n = 3), is shown; ns, not significant versus NTC. (F) Migration of Rac1 KO A549 and control (Scr) cells as determined with a Boyden chamber. Left, representative experiment. Right, quantification of migratory cells. Results were expressed as means ± SEMs of 4 individual experiments. ****p < 0.0001 versus parental. (G) Migration of A549 cells subjected to RhoG or NTC RNAi. Left, representative experiment. Right, quantification of migratory cells. Results were expressed as means ± SEMs of 8 individual experiments. ns, not significant versus NTC.
Figure 2.
Figure 2.. Adaptor and effector dependency for ruffle formation in response to EGF and HGF
(A) A549 was transfected with the indicated siRNA duplexes. After 48 h, cells were serum starved and treated with either EGF (100 ng/mL, 5 min) or HGF (100 ng/mL, 15 min). Upper left, mRNA levels relative to parental cells (dotted line). Upper right, representative micrographs of rhodamine-phalloidin stained cells. Lower, quantification of ruffle area in response to EGF or HGF, relative to parental cell (dotted line). Results are expressed as means ± SEMs (n = 3). ****p < 0.0001 versus NTC. Scale bar, 10 μM. (B) Time course analysis of phosphorylated Gab1, Akt, and SHP2 in response to EGF or HGF. (C) Effect of Gab1 RNAi on signaling in response to EGF or HGF. (D) Effect of Grb2 RNAi on signaling in response to EGF or HGF. (E) Effect of Grb2 RNAi on Gab1 phosphorylation by EGF or HGF. For (C)–(E), representative western blots are shown with the corresponding densitometric analysis of 3 independent experiments. Results (means ± SEMs) are expressed as percentage relative to the corresponding activation in NTC cells. **p < 0.01; ***p < 0.001; ****p < 0.0001; ns, not significant versus NTC.
Figure 3.
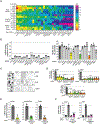
Figure 3.. Identification of Rac-GEFs mediating ruffle formation in lung adenocarcinoma cells
(A) Heatmap for Rac-GEF expression according to the qPCR array in lung adenocarcinoma cell lines with different genetic alterations, as determined with a Rac-GEF qPCR array. Expression is shown as ΔCt for each Rac-GEF relative to the average of UBC and B2M housekeeping genes. (B) A549 was transfected with the indicated siRNA duplexes. After 48 h, cells were serum starved and treated with HGF (100 ng/mL, 15 min). Left, mRNA levels for each Rac-GEF relative to NTC (dotted line). Right, quantification of ruffle formation. Results (means ± SEMs) are expressed as percentage relative to parental (dotted line). ***p < 0.001; ****p < 0.0001 versus NTC. (C) Representative micrographs of rhodamine-phalloidin-stained cells (NTC and siRNA#1 for each Rac-GEF). Scale bar, 10 μm. (D) Effect of silencing FARP1, ARHGEF39, or TIAM2 with 3 different siRNA duplexes. Results (means ± SEMs, n = 3) are expressed as percentage of ruffles formed in parental cells (dotted line). **p < 0.01; ***p < 0.001; ****; p < 0.0001 versus NTC. (E) Simultaneous FARP1, ARHGEF39, and TIAM2 triple knockdown in A549 cells. mRNA levels for the indicated Rac-GEFs are expressed as relative to parental cells (dotted line). Results are expressed as means ± SEMs (n = 3) relative to parental cells (dotted line). **p < 0.01; ***p < 0.001. (F) Effect of triple Rac-GEF knockdown on ruffle formation induced by EGF (left) or HGF (right). Results (means ± SEMs, n = 3) are expressed as percentage response relative to parental cells treated with the corresponding growth factor (dotted line). ****p < 0.0001 versus NTC.
Figure 4.
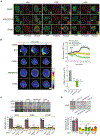
Figure 4.. FARP1, AHRGEF39, and TIAM2 are required for Rac1 activation in cell ruffles, cell motility, and invasion
(A) Localization of YFP-tagged Rac-GEFs in vehicle versus EGF- or HGF-treated A549 cells (100 ng/mL) as determined by confocal microscopy. Insets, enlarged images of selected regions. Scale bar, 10 μm. (B) Left, A549 cells stably expressing the Rac1 biosensor were starved overnight, treated with 100 ng/mL EFG, and imaged live every 15 s for Venus/Cerulean. Left, representative images show Rac1 activation in cells subjected to RNAi for each Rac-GEF or NTC RNAi. Color scale bar, dynamic range of the biosensor response (1.0, no significant response; 2.0, strongest response throughout the time-lapse sequence). Top right, quantification of the ratiometric changes in NTC versus Rac-GEF-depleted cells. The graph shows data from 3 independent experiments (n ≥ 30 cells for each condition) expressed as means ± SEMs. Bottom right, changes in FRET ratios induced by EGF (relative to NTC) were graphed for each condition at the maximum time of Rac1 activation in NTC cells. Scale bar, 10 μm. (C) A549, H358, or H1299 cells were transfected with the indicated Rac-GEF siRNA duplexes. After 48 h, cells were subjected to a Boyden chamber migration assay. Upper, representative micrographs. Lower, quantification of migratory cells after counting in 5 random fields by contrast microscopy. Results are expressed as means ± SEMs of 3 independent experiments. ****p < 0.0001 versus NTC. Scale bar, 50 μm. (D) Boyden chamber invasion assay through Matrigel, 48 h after transfection with the indicated Rac-GEF siRNA duplexes. Upper, representative micrographs. Lower, quantification. Results were normalized to invasion of parental cells and expressed as means ± SEMs of 4 independent experiments. ****p < 0.0001 versus NTC. Scale bar, 50 μm.
Figure 5.
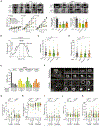
Figure 5.. Involvement of FARP1, ARHGEF39, and TIAM2 in growth factor-induced motility and ruffle formation dynamics
(A) A549 cells were transfected with the indicated Rac-GEF siRNA duplexes and 48 h later serum starved for 16 h. Cell motility was determined using a quantitative wound assay. Upper, representative wound micrographs in A549 cells at 0 and 12 h after addition of EGF (left) or HGF (right) (100 ng/mL). White line, wound. Lower left, representative migration curves. Lower right, migration velocity of Rac-GEF depleted A549 cells, relative to parental cells. Results are expressed as means ± SEMs of 5 independent experiments. *p < 0.05; **p < 0.01; ***p < 0.001 versus NTC. Dotted line, parental cells. Scale bar, 250 μm. (B) FARP1, ARHGEF39, or TIAM2 KD A549 cells expressing mCherry-cortactin were serum starved and imaged before and after stimulation with EGF (100 ng/mL) and subjected to analysis of ruffle formation. Results were expressed as means ± SEMs from at least 3 independent experiments (n = 150, 102, 158, and 68 for NTC, FARP1 KD, ARHGEF39 KD, and TIAM2 KD, respectively). The graph shows the variables analyzed for ruffle formation after addition of stimulus. (C) Total ruffle lifetime (min). (D) Total ruffle maximum area (μm2). (E) Percentage of total ruffles formed at different times after stimulation (distribution frequencies analyzed by chi-square test). (F) A549 cells expressing mCherry-cortactin were plated on glass bottom dishes, serum starved, and imaged live before and after treatment with EGF (100 ng/mL). Left, representative examples of peripheral and circular ruffles (white arrowheads). Yellow dashed lines highlight the edge of the cell. Right, individual time points covering the entire life cycle of a peripheral ruffle and a circular ruffle. Scale bar, 10 μm. (G) Circular and peripheral ruffle assembly rate (μm2 × min−1). (H) Circular and peripheral ruffle disassembly rate (μm2 × min−1). (I) Circular and peripheral ruffle stability (min). (J) Circular and peripheral ruffle lifetime (min). (K) Circular and peripheral maximum area (μm2). For (C), (D), and (G)–(K), results are expressed as means ± SEMs (n = 68–158). *p < 0.05; **p < 0.01; ***p < 0.001; ****p < 0.0001; ns, not significant.
Figure 6.
Figure 6.. AXL is required for EGF-mediated motility signaling in lung adenocarcinoma cells
(A) A549 were transfected with AXL siRNA duplexes. After 48 h, cells were serum starved and treated with either EGF (100 ng/mL, 5 min) or HGF (100 ng/mL, 15 min). Left, representative micrographs of rhodamine-phalloidin-stained cells. Right, quantification of ruffle area in response to EGF or HGF, relative to parental cells (dotted line). Results are expressed as means ± SEMs (n = 3). **p < 0.01; ***p < 0.001; ns, not significant versus NTC. Scale bar, 10 μm. (B) Effect of R428 (5 μM) on ruffle formation induced by EGF or HGF. Scale bar, 10 μm. (C) Analysis for phospho- and total PAK and Akt in EGF-stimulated A549 cells treated with R428. (D) Effect of the PI3K inhibitor LY294002 (20 μM, 1 h) on ruffle formation induced by Gas6 (200 ng/mL, 15 min) in H1299 cells. Scale bar, 10 μm. (E) Effect of Gab1 and Grb2 RNAi on Gas6-induced ruffle formation. Left, representative micrographs. Right, quantification of ruffle formation. Results (means ± SEMs) are expressed as percentage relative to NTC cells. ****p < 0.0001 versus NTC, Gas6-treated cells. Dotted line, parental cells. Scale bar, 10 μm. (F) PAK, Gab1, and Akt activation by Gas6 in H1299 cells. Representative western blots are shown. (G) Effect of LY294002 on PAK and Akt activation by Gas6 (200 ng/mL, 5 min). (H) Ruffle formation by Gas6 in the indicated Rac-GEF KD A549 cells. Results (means ± SEMs) are expressed percentage relative to NTC cells (dotted line). **p < 0.01; ns, not significant versus NTC, Gas6-treated cells. (I) H1299 cells (parental or transfected with siRNA duplexes for FARP1 or NTC, 48 h) were serum starved for 16 h and motility in response to Gas6 assessed using a quantitative wound assay. Left, representative migration curves. Right, migration velocity of FARP1 depleted A549 cells. Results are expressed as means ± SEMs of 3 independent experiments. *p < 0.05; **; p < 0.01; versus NTC. Dotted line, parental cells. (J) Effect of FARP1 RNAi on PAK activation. Left, representative western blots; right, densitometric analysis, normalized to β-actin (means ± SEMs, n = 3). ***p < 0.001; ****p < 0.001 versus NTC, Gas6-stimulated cells (dotted line). (K) Localization of YFP-FARP1 in Gas6-treated H1299 cells, as determined by confocal microscopy. Left, effect of the PI3K inhibitor LY294002. Right, effect of Gab1 RNAi. Scale bar, 10 μm.
Figure 7.
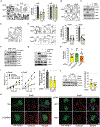
Figure 7.. Expression of Rac-GEFs human lung adenocarcinomas
(A) Heatmap for Rac-GEFs upregulated in tumor versus normal (n = 226, GEO: GSE31210 human lung adenocarcinoma dataset). (B) Upregulated Rac-GEFs. The analysis shows p values (tumor versus normal), overall survival (OS) and disease-free survival (DFS). (C) Boxplot showing upregulated Rac-GEFs in lung adenocarcinomas among those examined for ruffle formation. N, normal; T, tumor. (D) qPCR expression analysis for the indicated Rac-GEFs in EpCam+ tumor cells purified from human lung adenocarcinomas. Results are expressed as fold change relative to EpCam+ cells from the corresponding adjacent normal tissue (dotted line). Inset, log2 representation. **p < 0.01. (E) Hypothetical model for Rac-GEF involvement in ruffle formation by EGF and HGF in lung adenocarcinoma cells.

Similar articles

Cited by

References

    1. Abella JV, Vaillancourt R, Frigault MM, Ponzo MG, Zuo D, Sangwan V, Larose L, and Park M (2010). The Gab1 scaffold regulates RTK-dependent dorsal ruffle formation through the adaptor Nck. J. Cell Sci 123, 1306–1319. - PubMed
    1. Abu-Thuraia A, Gauthier R, Chidiac R, Fukui Y, Screaton RA, Gratton JP, and Côté JF (2015). Axl phosphorylates Elmo scaffold proteins to promote Rac activation and cell invasion. Mol. Cell. Biol 35, 76–87. - PMC - PubMed
    1. Amado-Azevedo J, Reinhard NR, van Bezu J, de Menezes RX, van Beusechem VW, van Nieuw Amerongen GP, van Hinsbergh VWM, and Hordijk PL (2017). A CDC42-centered signaling unit is a dominant positive regulator of endothelial integrity. Sci. Rep 7, 10132. - PMC - PubMed
    1. Bagci H, Sriskandarajah N, Robert A, Boulais J, Elkholi IE, Tran V, Lin ZY, Thibault MP, Dubé N, Faubert D, et al. (2020). Mapping the proximity interaction network of the Rho-family GTPases reveals signalling pathways and regulatory mechanisms. Nat. Cell Biol 22, 120–134. - PubMed
    1. Bahcall M, Awad MM, Sholl LM, Wilson FH, Xu M, Wang S, Palakurthi S, Choi J, Ivanova EV, Leonardi GC, et al. (2018). Amplification of wild-type KRAS imparts resistance to crizotinib in MET exon 14 mutant non-small cell lung cancer. Clin. Cancer Res 24, 5963–5976. - PMC - PubMed

Publication types

MeSH terms