. 2021 Nov 2;37(5):109911.
doi: 10.1016/j.celrep.2021.109911.

Regulatory T cell differentiation is controlled by αKG-induced alterations in mitochondrial metabolism and lipid homeostasis

Affiliations

Regulatory T cell differentiation is controlled by αKG-induced alterations in mitochondrial metabolism and lipid homeostasis

Maria I Matias et al. Cell Rep. .

Abstract

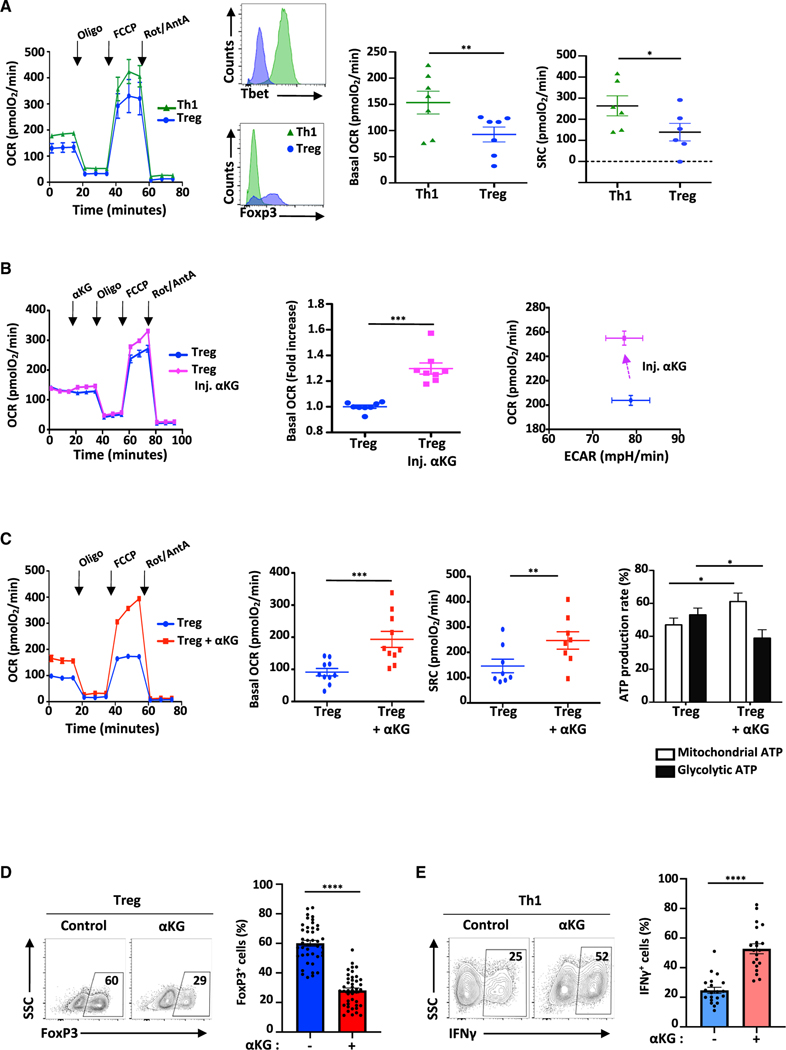
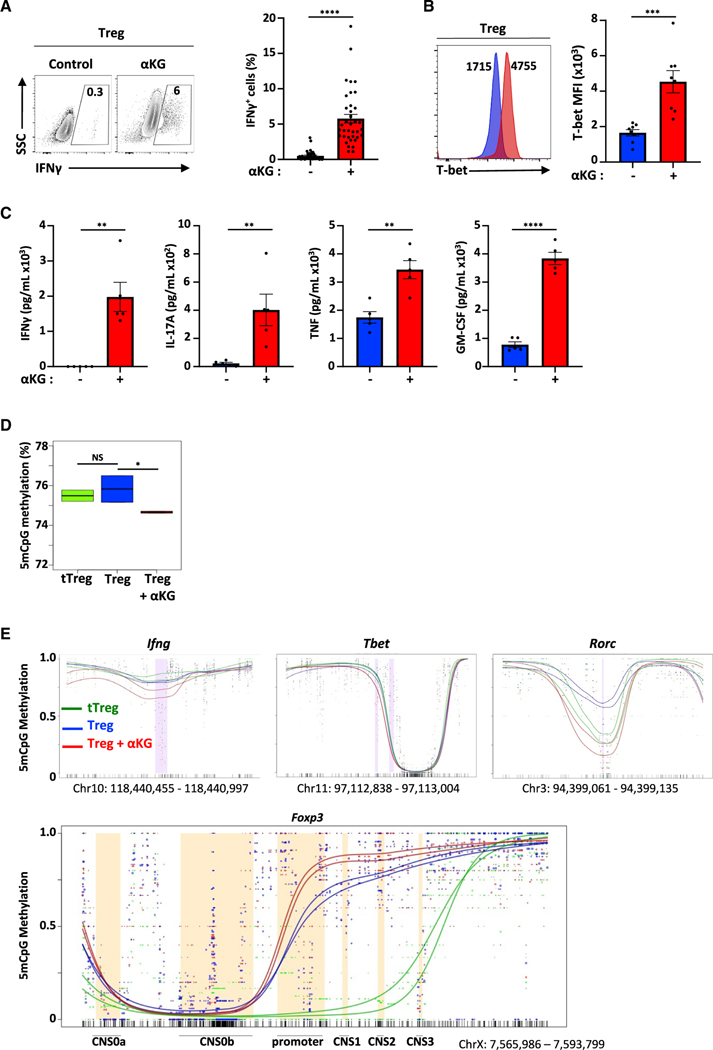
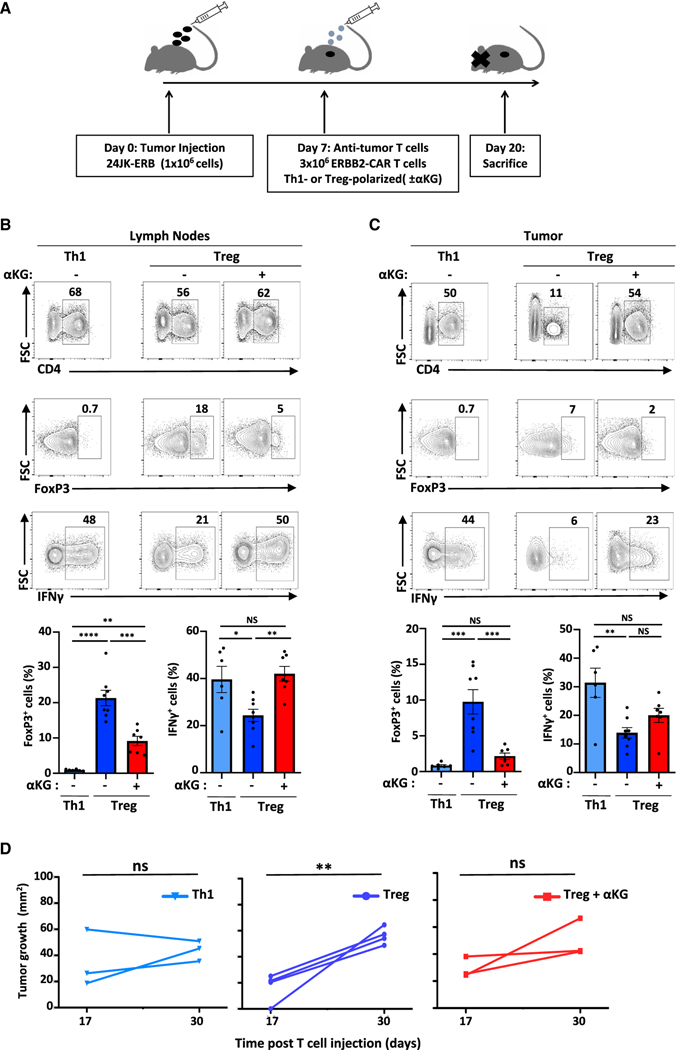
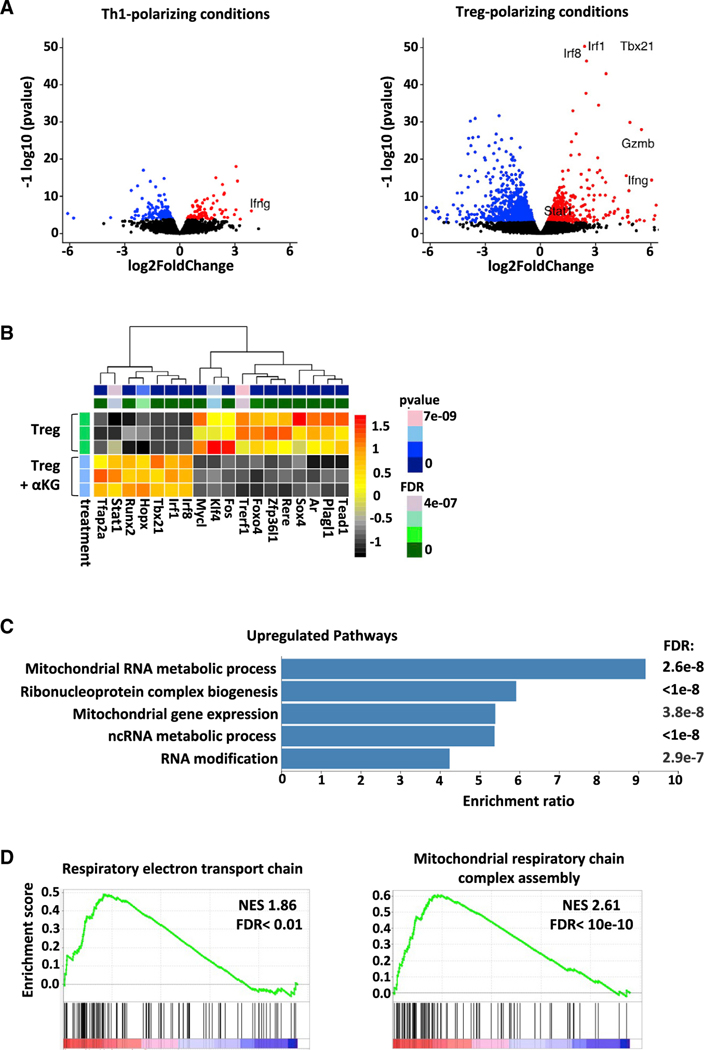
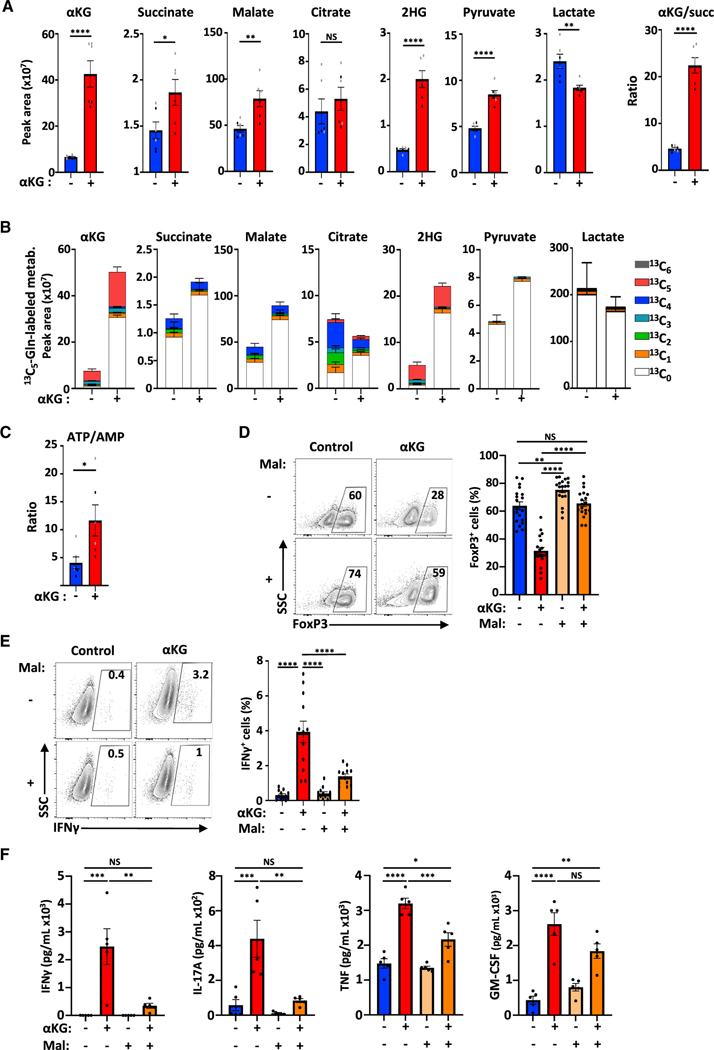
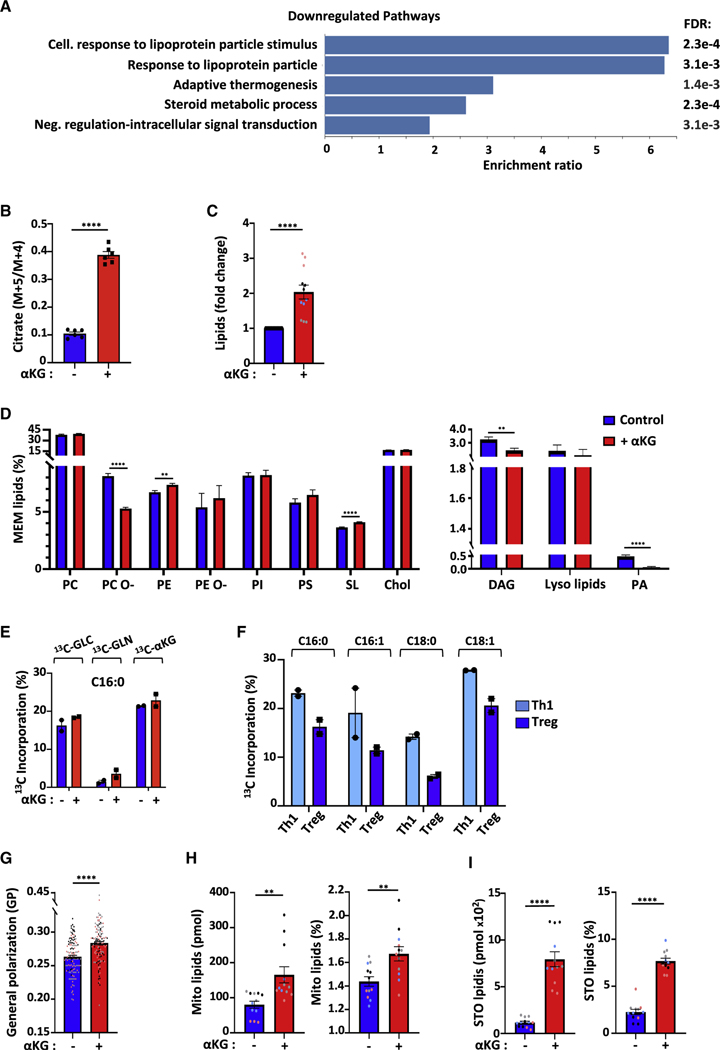
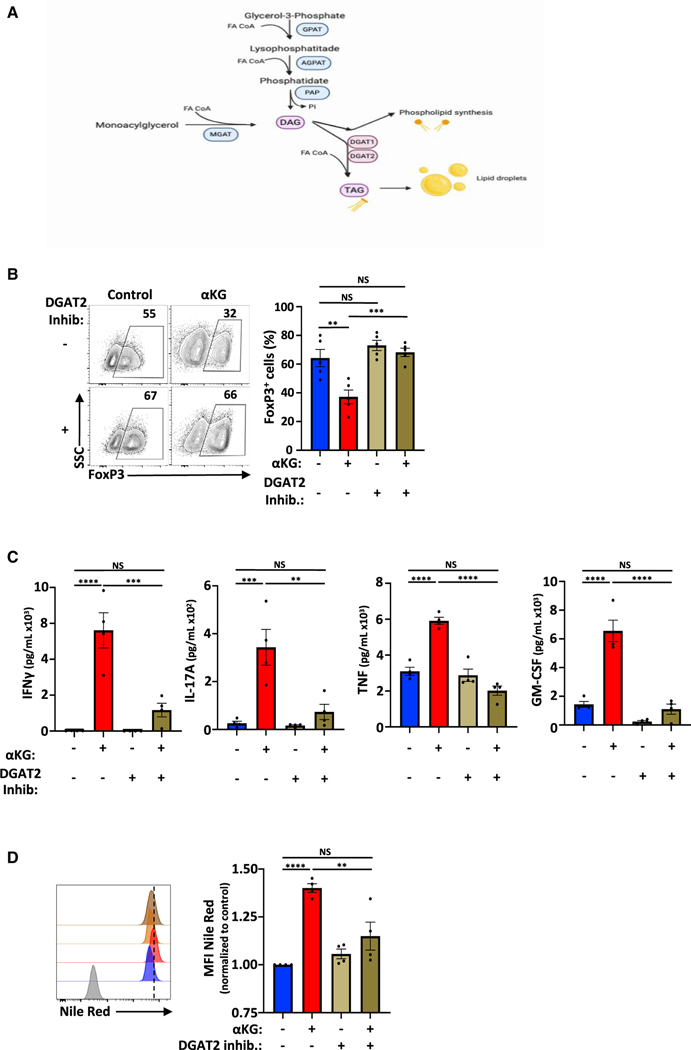
Suppressive regulatory T cell (Treg) differentiation is controlled by diverse immunometabolic signaling pathways and intracellular metabolites. Here we show that cell-permeable α-ketoglutarate (αKG) alters the DNA methylation profile of naive CD4 T cells activated under Treg polarizing conditions, markedly attenuating FoxP3+ Treg differentiation and increasing inflammatory cytokines. Adoptive transfer of these T cells into tumor-bearing mice results in enhanced tumor infiltration, decreased FoxP3 expression, and delayed tumor growth. Mechanistically, αKG leads to an energetic state that is reprogrammed toward a mitochondrial metabolism, with increased oxidative phosphorylation and expression of mitochondrial complex enzymes. Furthermore, carbons from ectopic αKG are directly utilized in the generation of fatty acids, associated with lipidome remodeling and increased triacylglyceride stores. Notably, inhibition of either mitochondrial complex II or DGAT2-mediated triacylglyceride synthesis restores Treg differentiation and decreases the αKG-induced inflammatory phenotype. Thus, we identify a crosstalk between αKG, mitochondrial metabolism and triacylglyceride synthesis that controls Treg fate.

Keywords: CAR T cells; DNA methylation; T cell differentiation; TCA cycle; Th1; Treg; lipidome; mitochondrial metabolism; triacylglyceride synthesis; α-ketoglutarate.


Conflict of interest statement

Declaration of interests C.M., S.K., V.D., and N.T. are inventors on patents describing the use of ligands for detection of and modulation of metabolite transporters (N.T. gave up her rights), licensed to METAFORA-biosystems.

Figures

Figure 1.
Figure 1.. αKG-induced increases in OXPHOS are associated with decreased Treg polarization and augmented Th1 differentiation.
(A) OCR was monitored at day 4 of Th1 and Treg polarization following sequential injection of oligomycin, FCCP and rotenone/antimycin A (arrows; left panel). The differentiation status of Th1- and Treg-polarized cells was monitored by Tbet and FoxP3 expression and representative histograms are shown (n = 7). Mean basal OCR levels ± SEM (n = 7 independent experiments) and SRC (n = 6) are presented. (B) The direct impact of αKG on cell metabolism was evaluated by injecting αKG into the XFe96 flux analyzer at day 2 of Treg polarization and fold change in basal OCR as well as OCR/ECAR energy plots ± SEM are shown (n = 8). (C) OCR of CD4 T cells activated under Treg-polarizing conditions ± αKG (day 4) are presented (n = 1 of 10). Quantification of basal OCR ± SEM (n = 8) and SRC (n = 8) are shown. The percentage of the ATP production rate derived from mitochondrial and glycolytic pathways are presented as means ± SEM (n = 7). (D) FoxP3 expression was evaluated following stimulation of naive CD4 T cells under Treg-polarizing conditions in the absence (control) or presence of αKG (day 4). Representative plots and means ± SEM are presented (right, n = 42). (E) IFNγ expression by naive CD4 T cells stimulated under Th1-polarizing conditions was evaluated by flow cytometry and means ± SEM are presented (n = 20). Statistical analyses were evaluated by paired (A and C) and unpaired (D and E) 2-tailed t tests.
Figure 2.
Figure 2.. αKG induces an inflammatory profile in CD4 T cells activated under Treg-polarizing conditions.
(A) IFNγ expression was assessed following activation under Treg polarizing conditions ±αKG (day 4, n = 40). (B) T-bet protein levels were evaluated as a function of mean fluorescent intensity (MFI, n = 8). (C) IFNγ, IL-17A, TNF, and GM-CSF levels were evaluated at day 3 of Treg polarization (n = 5). (D)DNA methylation in a CpG context (5mCpG) was evaluated by nanopore sequencing in the indicated conditions and the percentage of methylation is presented as boxplots with the number of reads in the 6 samples ranging from 1,260,564 to 6,145,824 reads (triplicates, 2 independent experiments). (E) Distribution of the methylation status of differentially methylated regions (DMR) in the Ifng, Tbet, Rorc and Foxp3 loci are presented. Quantifications of means ± SEM are shown (A–C). Statistical analyses were performed by an unpaired 2-tailed t test.
Figure 3.
Figure 3.. ERBB2-CAR T cells polarized ex vivo in the presence of αKG maintain an in vivo inflammatory profile following adoptive transfer into tumor-bearing mice, delaying tumor growth.
(A) Schematic of the experimental setup evaluating the impact of ERBB2-CAR T cells in mice bearing the ERBB2+24JK fibrosarcoma (24JK-ERB). (B) Representative plots and quantifications ± SEM of CD4+, FoxP3+ CD4+, and IFNγ+CD4+ T cells in lymph nodes (LN) of tumor-bearing mice. (C) Representative plots and quantifications ± SEM of intratumoral CD4 T cell subsets (n = 6–8). (D) Tumor area was monitored at days 17 and 30 following T cell injection (n = 3–4 per group). Statistical differences were determined by a one-way ANOVA and Tukey test for multiple comparisons (A–C) and by paired one-tailed t test (D).
Figure 4.
Figure 4.. Mitochondrial and respiratory ETC genes are markedly upregulated by αKG in Treg-polarizing conditions.
(A) Volcano plot representations of differential expression analyses in naïve CD4 T cells activated in Th1- and Treg-polarizing conditions ± αKG (day 4). (B) Alterations in transcription factor genes in the indicated conditions are shown. Each row represents an independent sample and statistical significance is indicated in the top bar. Transcripts that are differentially expressed (FDR < 0.05 and baseMean expression > 100) are colored. (C) The top GO biological processes for genes upregulated following activation under Treg polarizing conditions ± αKG (558), the enrichment ratio for each GO term, and FDRs are presented. Full datasets for upregulated genes can be found at http://www.webgestalt.org/results/1628071504/#. D) GSEA enrichment plots of mitochondrial respiratory chain complex assembly and the respiratory electron transport chain. The green curve corresponds to the enrichment score and the barcode plot indicates the position of the genes in each gene set.
Figure 5.
Figure 5.. Treg differentiation is negatively regulated by αKG-induced mitochondrial complex II activity.
(A) The peak area of αKG, succinate, malate, citrate, 2-hydroxyglutarate (2HG), pyruvate, and lactate were evaluated by mass spectrometry (MS) in the indicated conditions and the αKG/succinate peak area ratio ± SEM is presented. (B) The peak area ± SEM of each metabolite and percentage incorporation of the carbon isotopologues from [13C5]glutamine into TCA cycle intermediates are presented. (C) The ATP/AMP peak area ratio ± SEM was evaluated by MS. (D–F) (D) The impact of malonate (Mal, 10 mM) on Treg polarization was evaluated as a function of FoxP3 expression at day 4 and quantifications ± SEM are shown (n = 19). (E) IFNγ expression was evaluated by flow cytometry and quantifications ± SEM are shown (n = 12). (F) IFNγ, IL-17A, TNF, and GM-CSF secretion was evaluated by CBA following Treg-polarization in the indicated conditions (day 4, n = 5). n = 2 independent experiments of technical triplicates (panels A–C). Significance was determined by an unpaired 2-tailed t test (A–C) or a one-way ANOVA and Tukey multiple comparison test (D–F).
Figure 6.
Figure 6.. Lipidome remodeling in Treg-polarized cells in response to αKG is associated with dramatic increases in storage and mitochondrial lipids.
(A) The top GO terms for non-redundant biological processes are presented for downregulated genes (676) following Treg polarizing conditions ± αKG as in Figure 4. (B) The contribution of reductive carboxylation to citrate generation was evaluated as a fraction of the m+5/m+4 carbons from [13C5]glutamine (n = 2 with technical triplicates). (C) Fold change in lipids in CD4 T cells undergoing Treg polarization in the presence (red) of αKG (control Treg conditions (blue) are arbitrarily presented as “1”). Each point represents an individual triplicate sample from 4 biological experiments (black, gray, pink, blue). (D) The abundance of the different membrane-lipid classes was assessed by lipidomic analysis and mean levels ± SEM are presented. Abbreviations: PC, phosphatidylcholines; PC O-, alkyl-ether-linked phosphatidylcholines; PE, phosphatidylethanolamines; PE O-, ether-linked phosphatidylethanolamines; PI, phosphatidylinositols; PS, phosphatidylserines; SL, sphingolipids; Chol, cholesterol; DAG, Diacylglycerol; PA, phosphatidate. (E) Percent incorporation of carbon isotopologues from [13C6]glucose, [13C5]glutamine, and [13C5]dimethyl-αKG into C16:0 palmitic acid is shown in the indicated conditions (n = 2 technical replicates). (F) Percent incorporation of carbon isotopologues from [13C6]glucose into C16:0, C16:1, C18:0, and C18:1 FAs is shown for Th1 and Treg polarizing conditions. (G) Quantification of membrane packing was evaluated by C-Laurdan spectral microscopy and is presented as Generalized Polarization (GP; n = 3, 129–132 cells). (H) Total and relative abundance of mitochondrial lipids (cardiolipin and phosphatidylglycerol) are presented. (I) Total (pmol) and relative abundance of storage lipids (TAGs, triacylglyceride and CEs, cholesterol esters) are presented. Quantifications ± SEM are shown (B–I). Significance was determined by unpaired 2-tailed t tests.
Figure 7.
Figure 7.. DGAT2-mediated generation of triacylglycerides inhibits Treg differentiation.
(A) Schematic representation of the classical pathway leading to the generation of triacylglycerides (TAG). (B) The impact of the DGAT2 inhibitor (PF-06424439) on Treg polarization was evaluated as a function of FoxP3 expression at day 4 (n = 5). (C) IFNγ, IL-17A, TNF, and GM-CSF secretion was quantified in the indicated conditions (day 3, n = 4). (D) Lipid droplet quantification was evaluated by Nile Red staining and representative histograms and quantifications are presented at day 4 (levels in control Treg conditions were arbitrarily set at “1”). Quantifications ± SEM are shown (B–D). Significance was determined by one-way ANOVA and Tukey multiple comparison tests.

References

    1. Almeida L, Lochner M, Berod L, and Sparwasser T. (2016). Metabolic pathways in T cell activation and lineage differentiation. Semin. Immunol 28, 514–524. - PubMed
    1. Angelin A, Gil-de-Gómez L, Dahiya S, Jiao J, Guo L, Levine MH, Wang Z, Quinn WJ 3rd, Kopinski PK, Wang L, et al. (2017). Foxp3 Reprograms T Cell Metabolism to Function in Low-Glucose, High-Lactate Environments. Cell Metab. 25, 1282–1293.e7. - PMC - PubMed
    1. Aon MA, Bhatt N, and Cortassa SC (2014). Mitochondrial and cellular mechanisms for managing lipid excess. Front. Physiol 5, 282. - PMC - PubMed
    1. Bailis W, Shyer JA, Zhao J, Canaveras JCG, Al Khazal FJ, Qu R, Steach HR, Bielecki P, Khan O, Jackson R, et al. (2019). Distinct modes of mitochondrial metabolism uncouple T cell differentiation and function. Nature 571, 403–407. - PMC - PubMed
    1. Beier UH, Angelin A, Akimova T, Wang L, Liu Y, Xiao H, Koike MA, Hancock SA, Bhatti TR, Han R, et al. (2015). Essential role of mitochondrial energy metabolism in Foxp3+ T-regulatory cell function and allograft survival. FASEB J. 29, 2315–2326. - PMC - PubMed

Publication types

MeSH terms