. 2021 Nov 2;37(5):109940.
doi: 10.1016/j.celrep.2021.109940.

Molecular and structural basis of olfactory sensory neuron axon coalescence by Kirrel receptors

Affiliations

Molecular and structural basis of olfactory sensory neuron axon coalescence by Kirrel receptors

Jing Wang et al. Cell Rep. .

Abstract

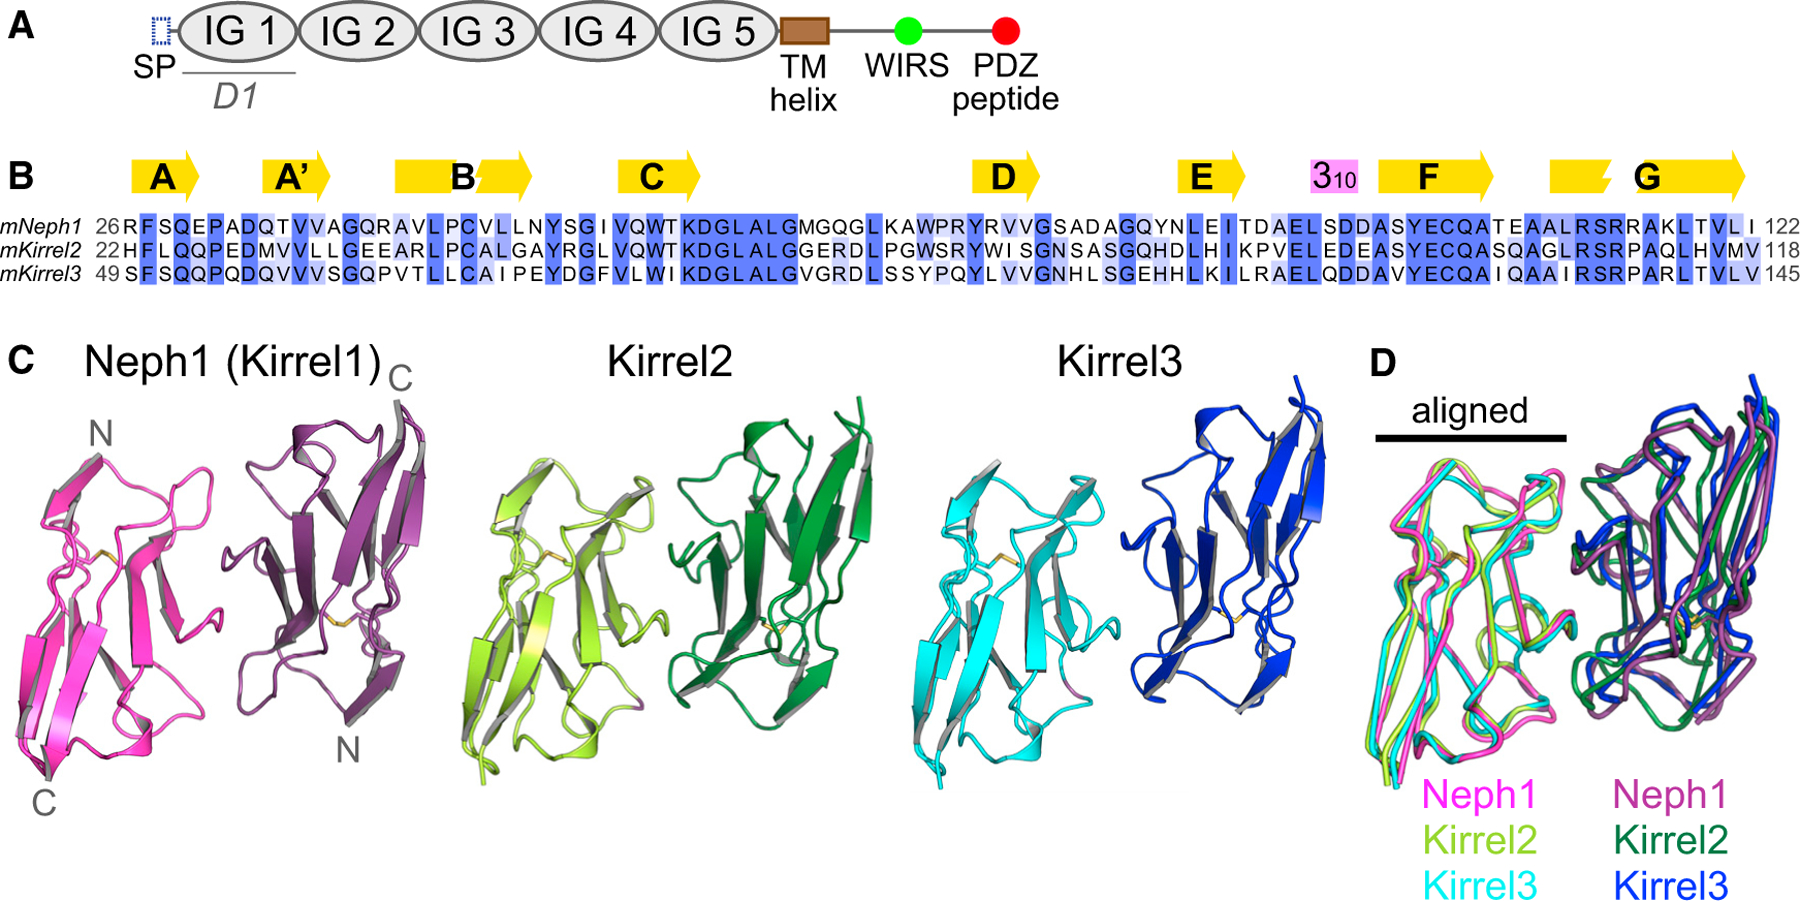
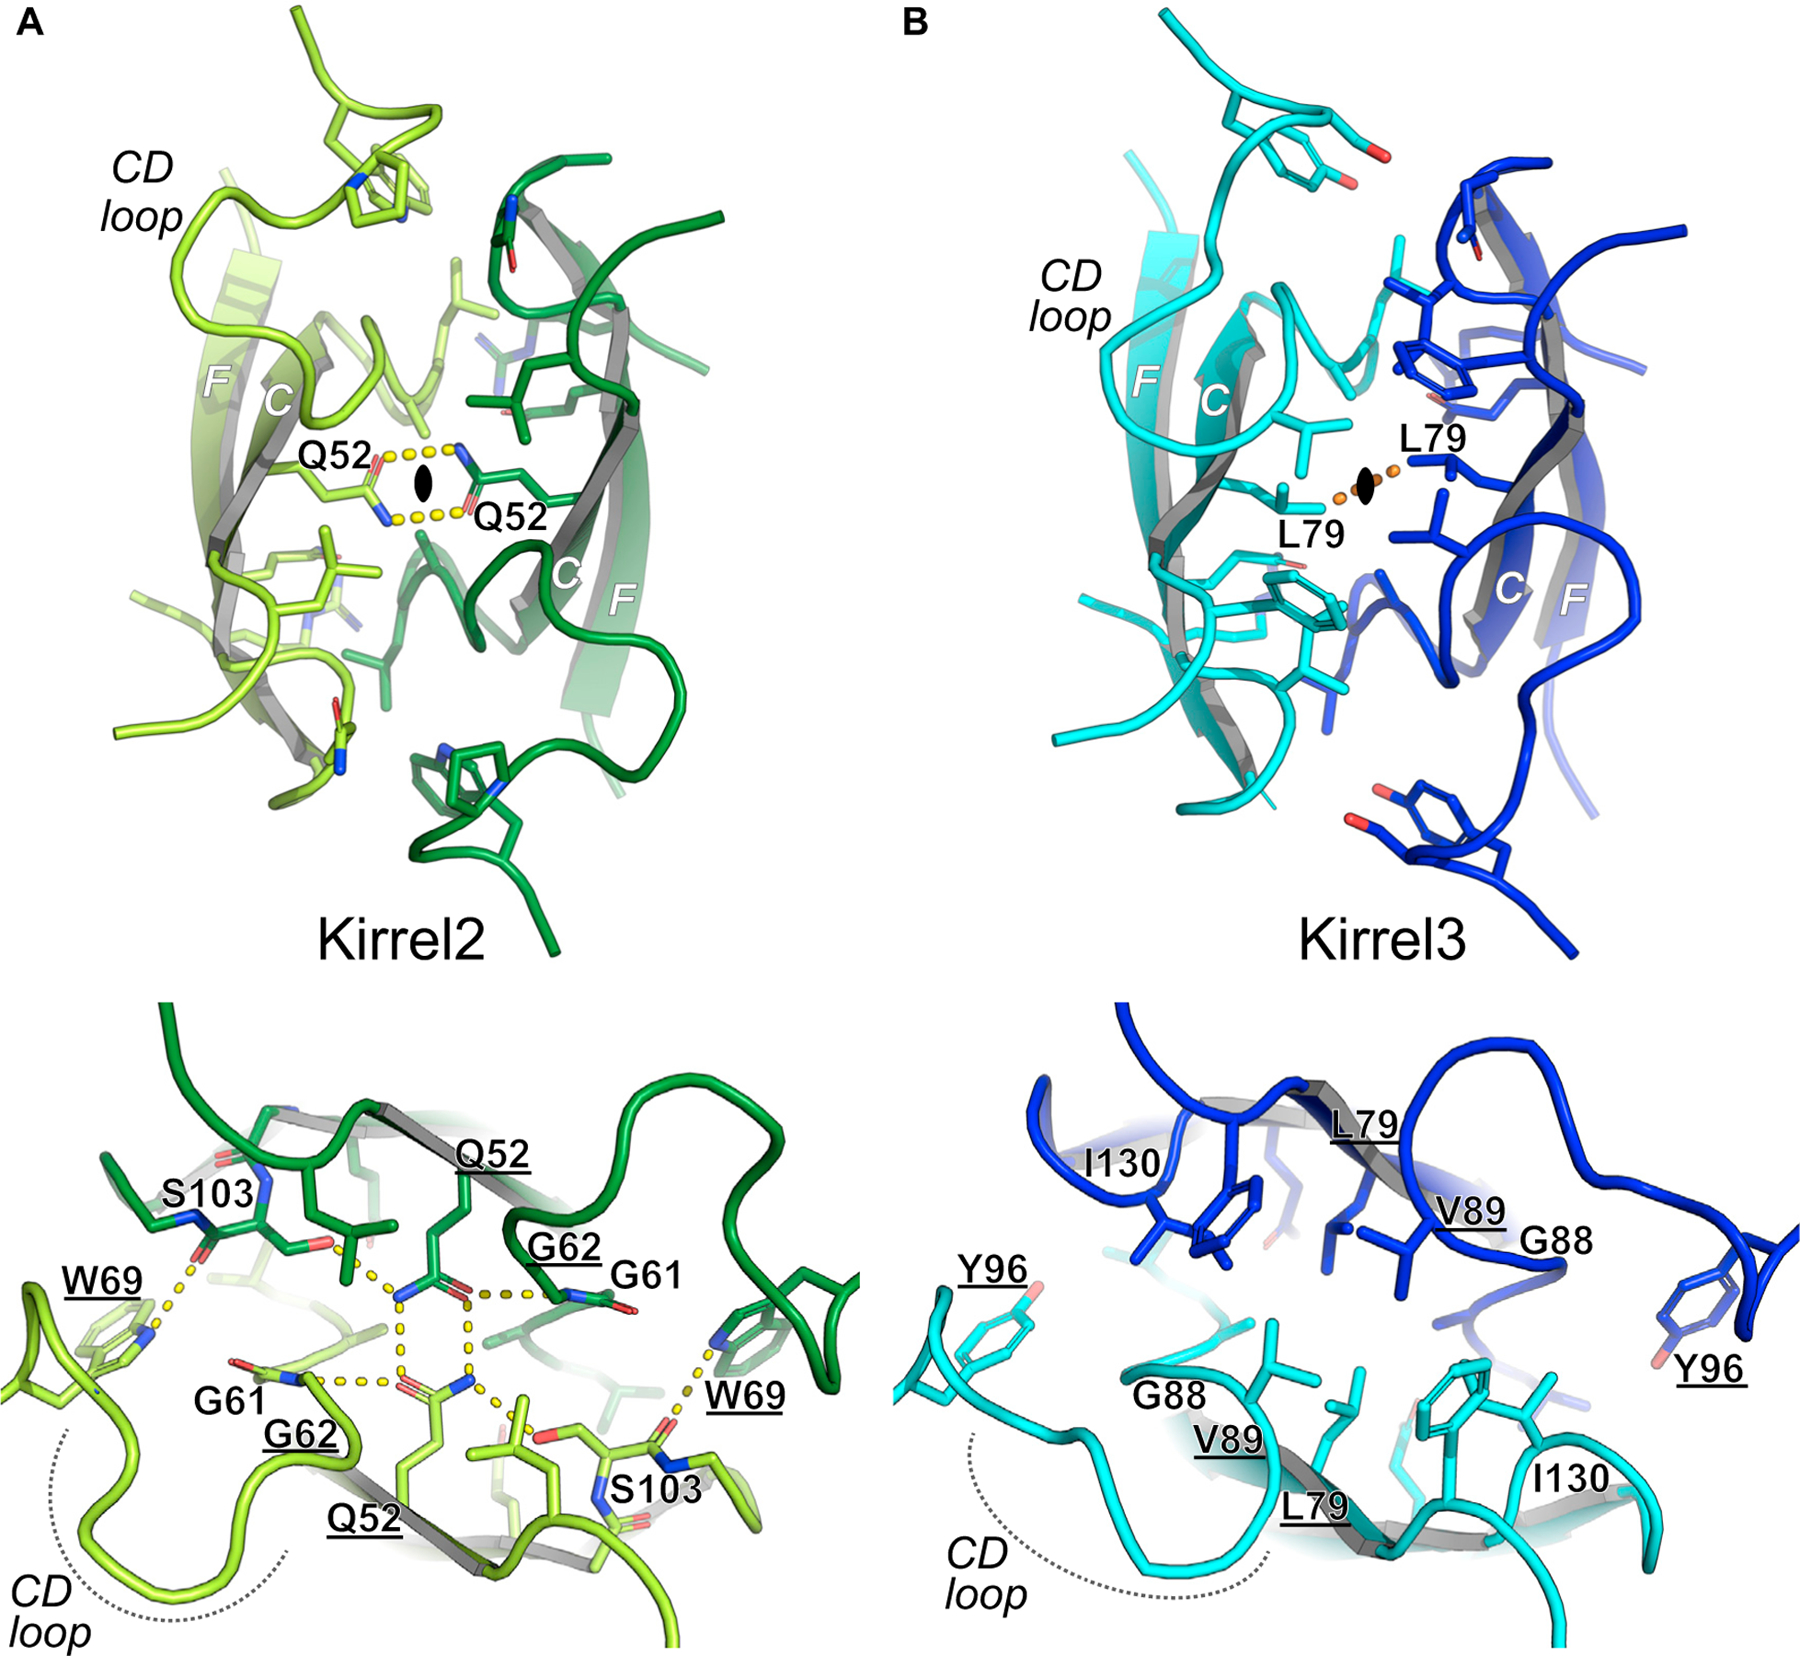
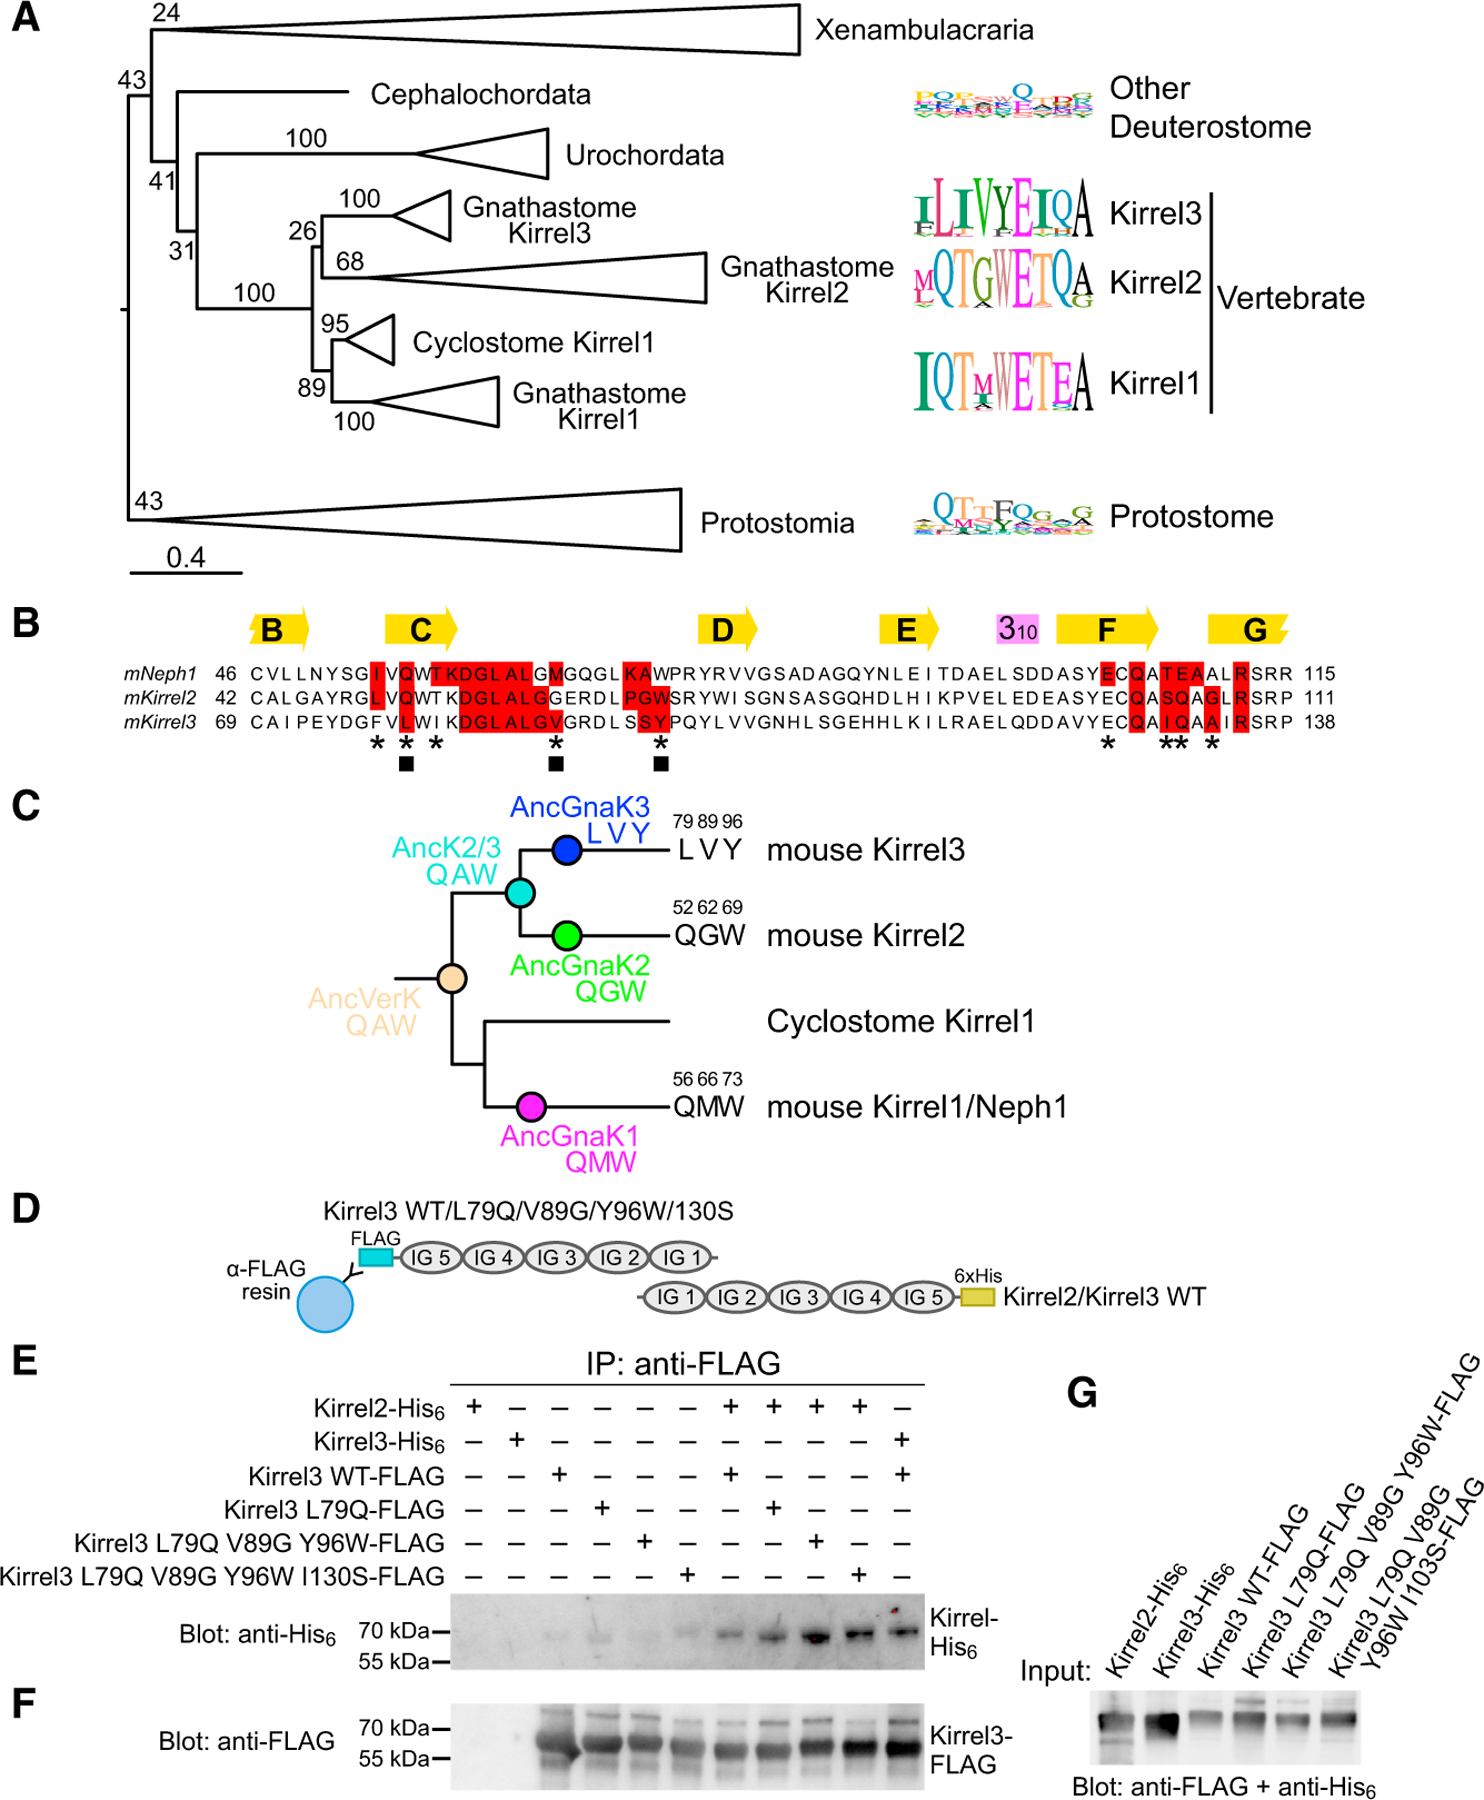
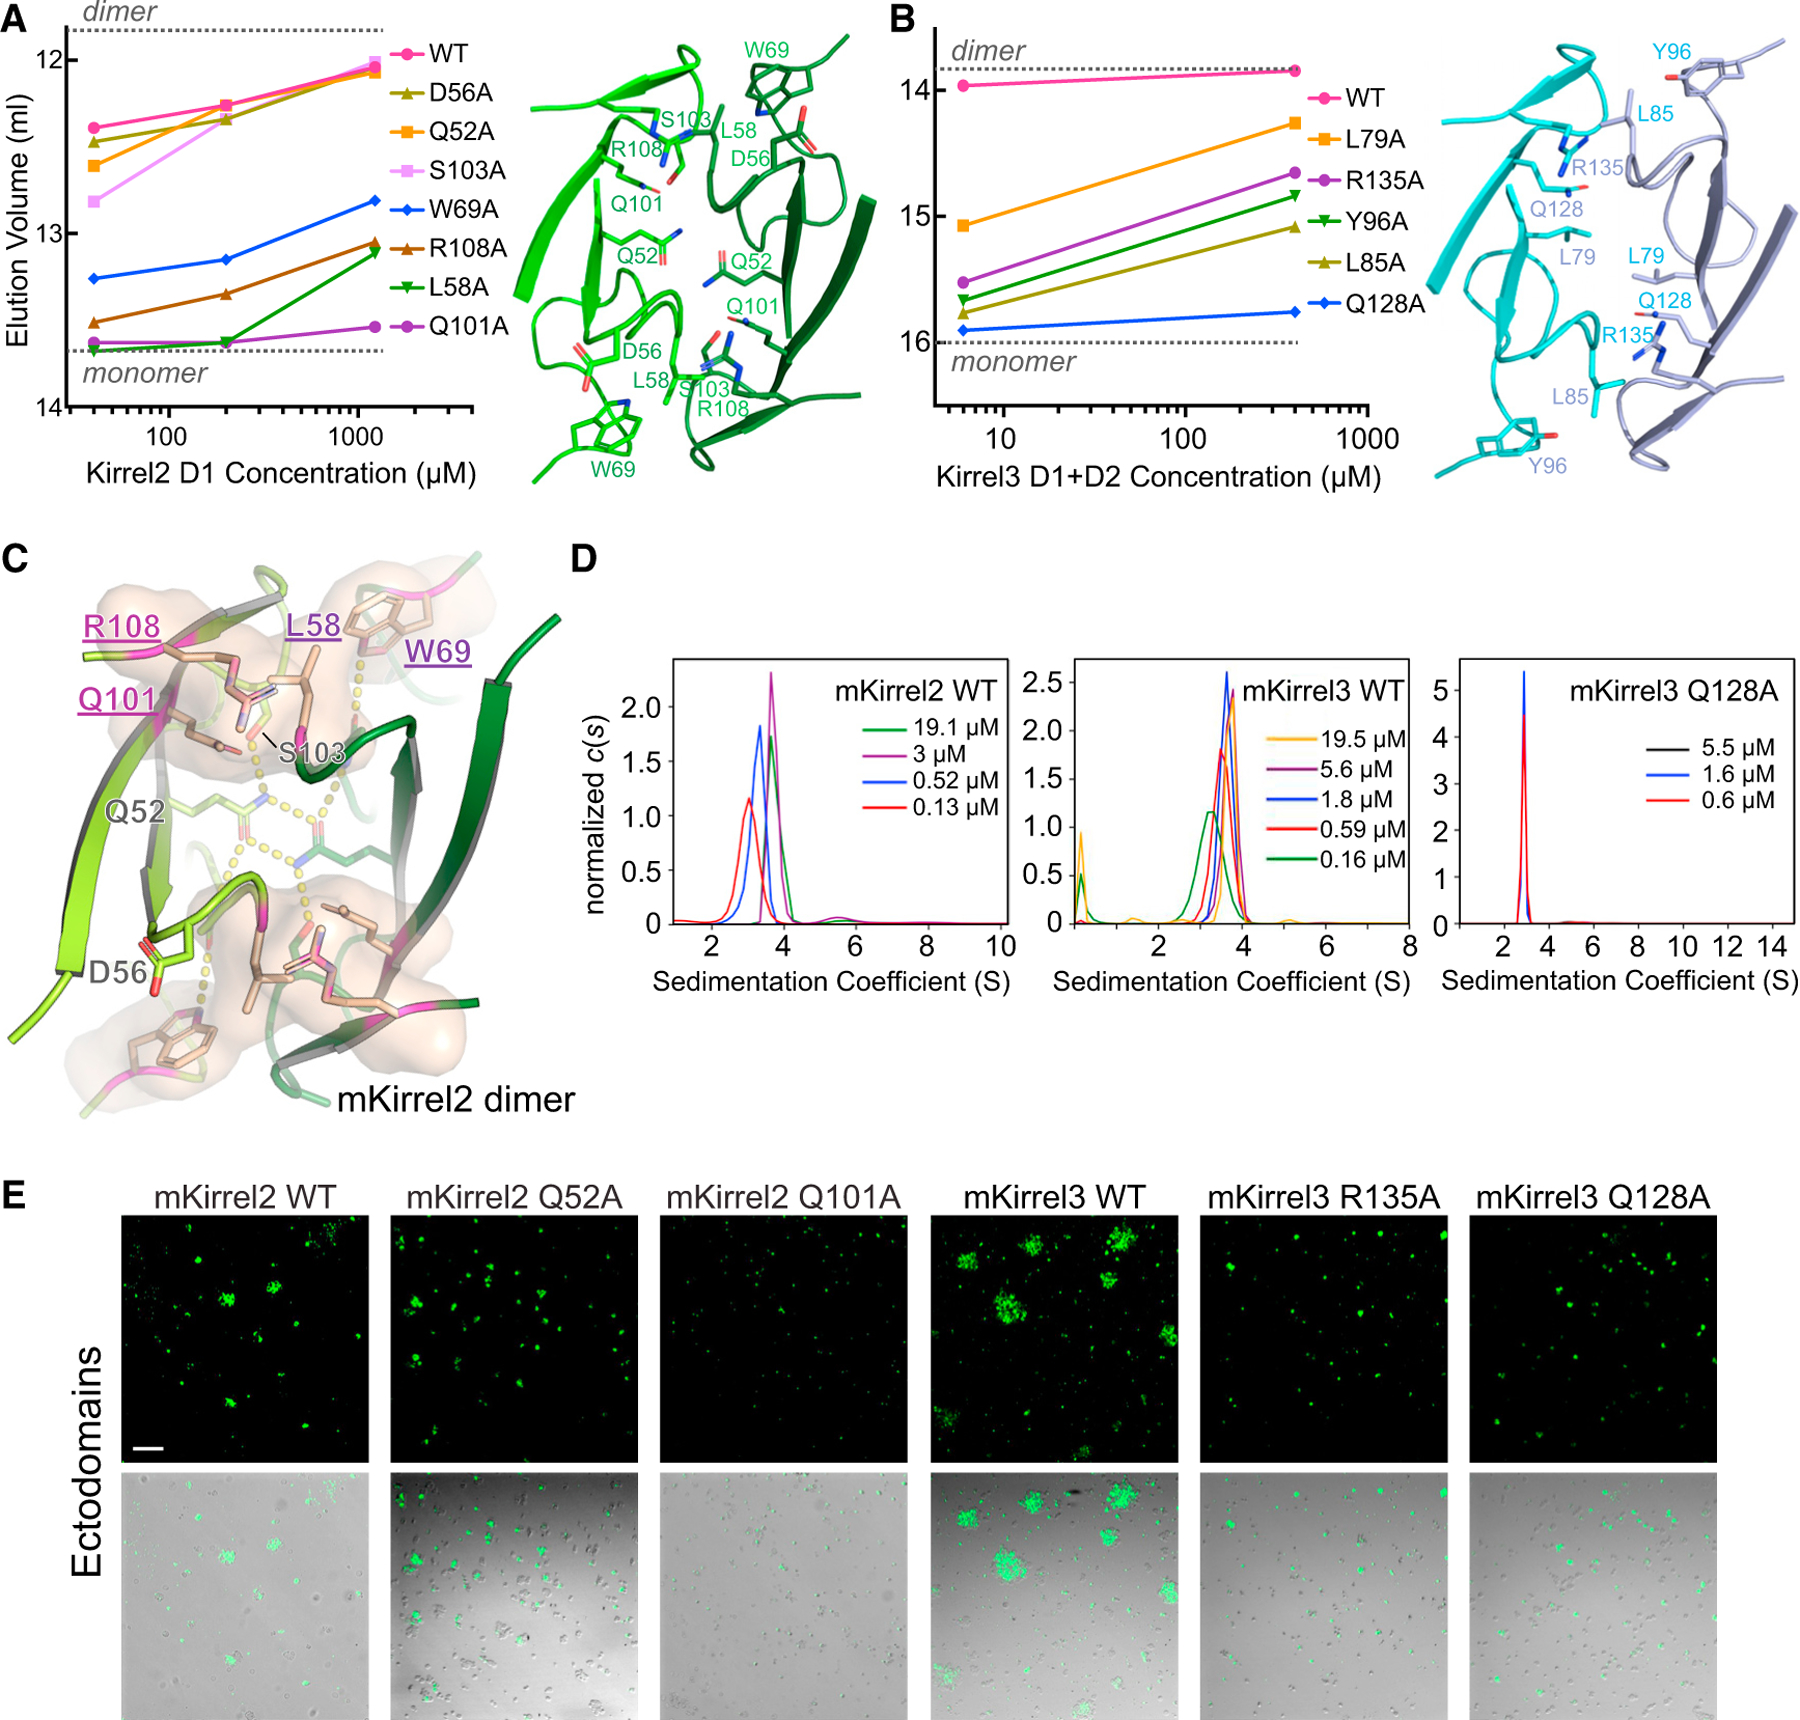
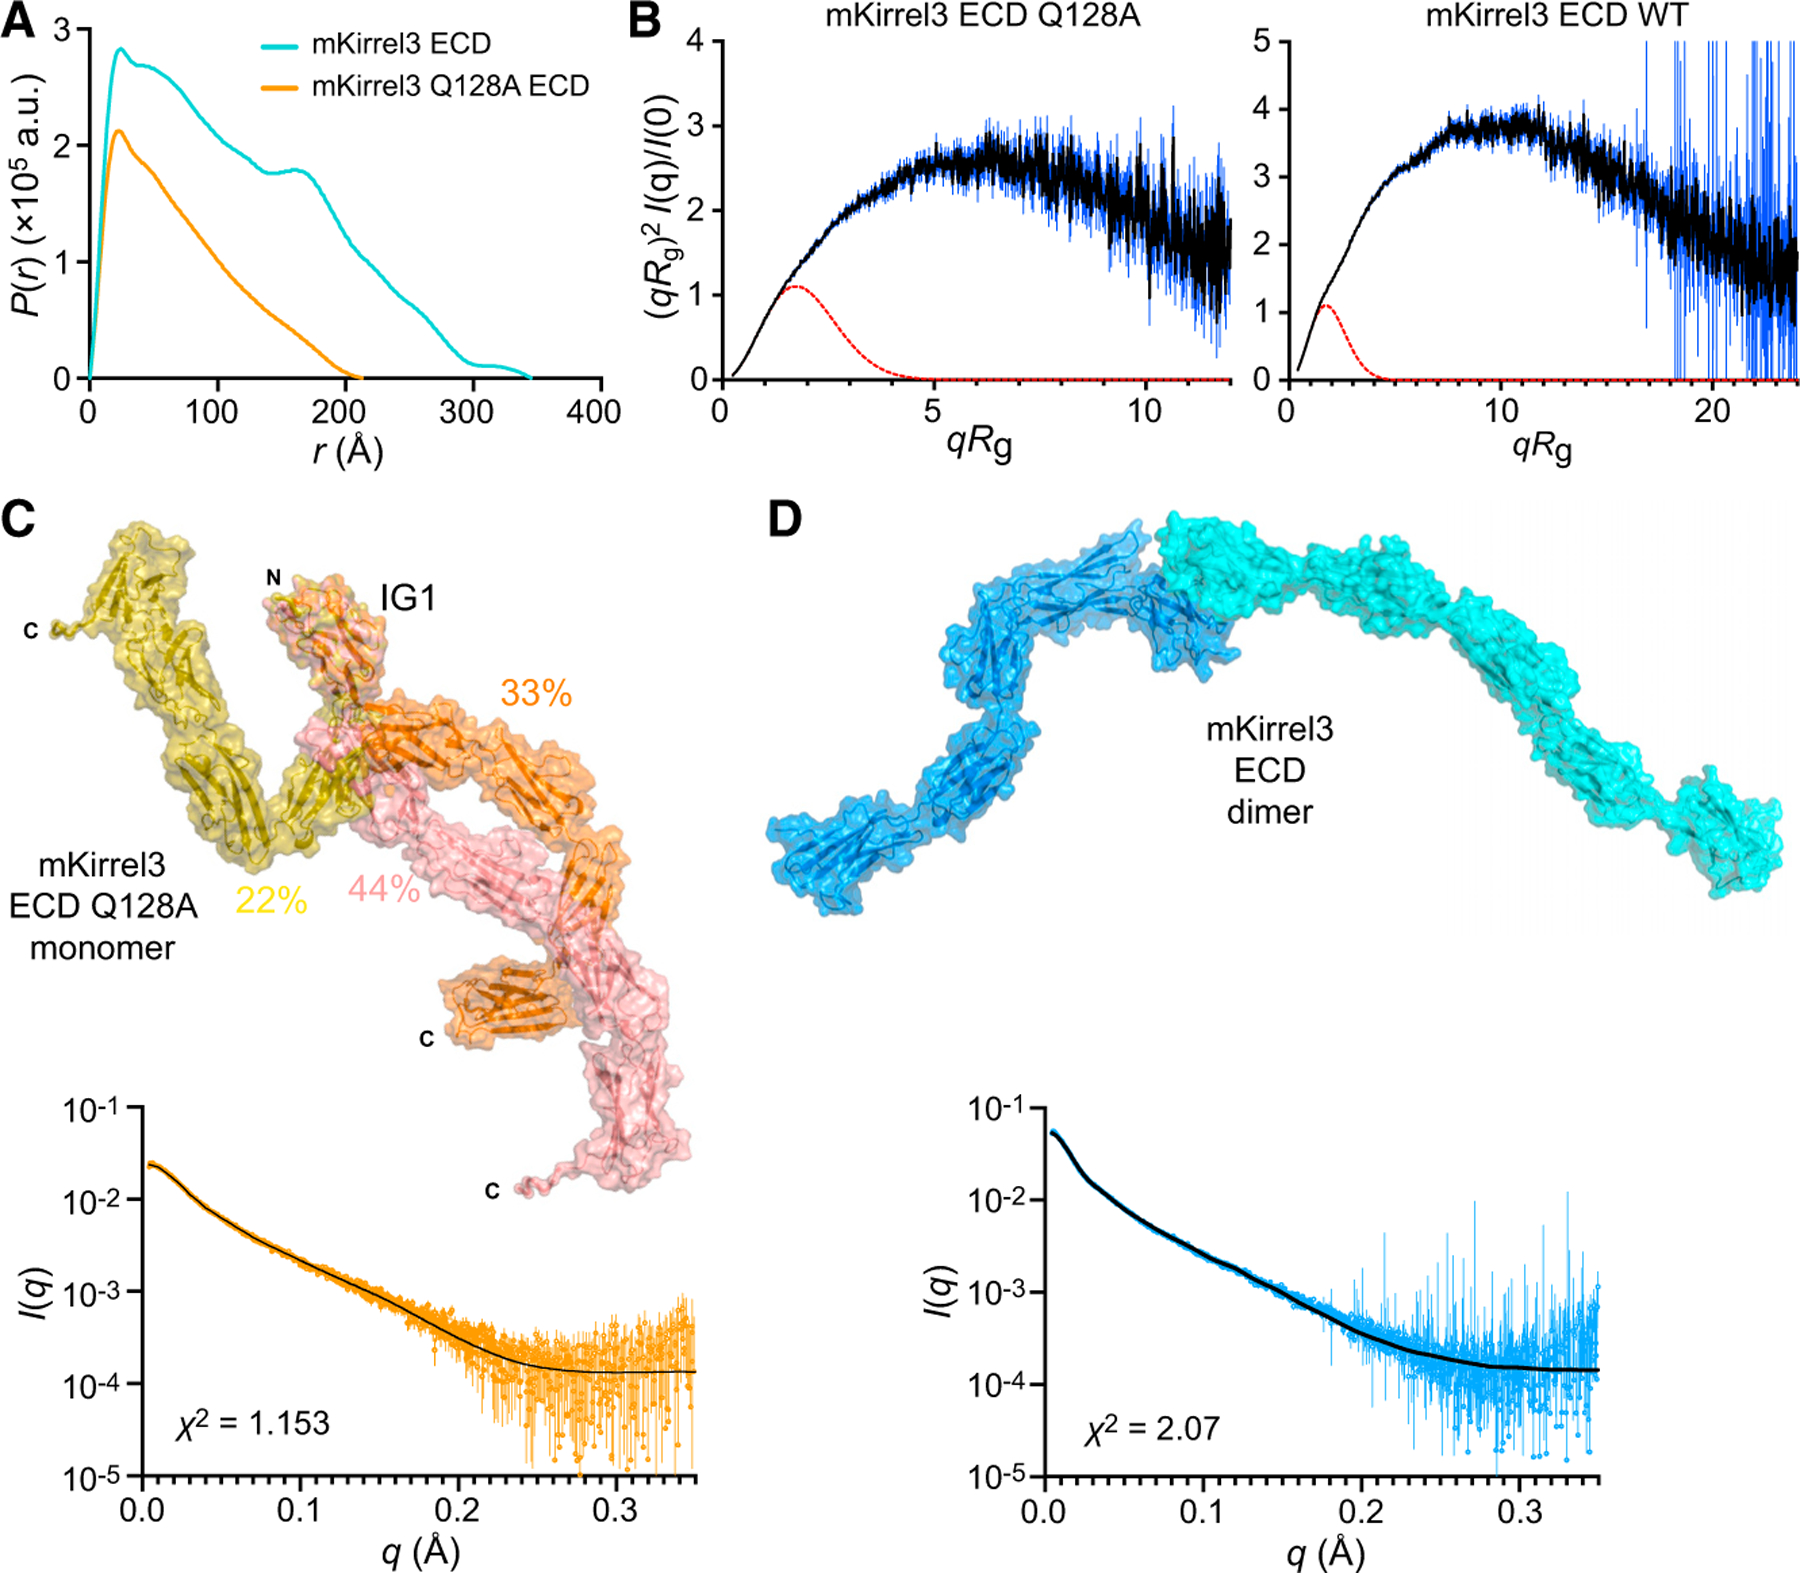
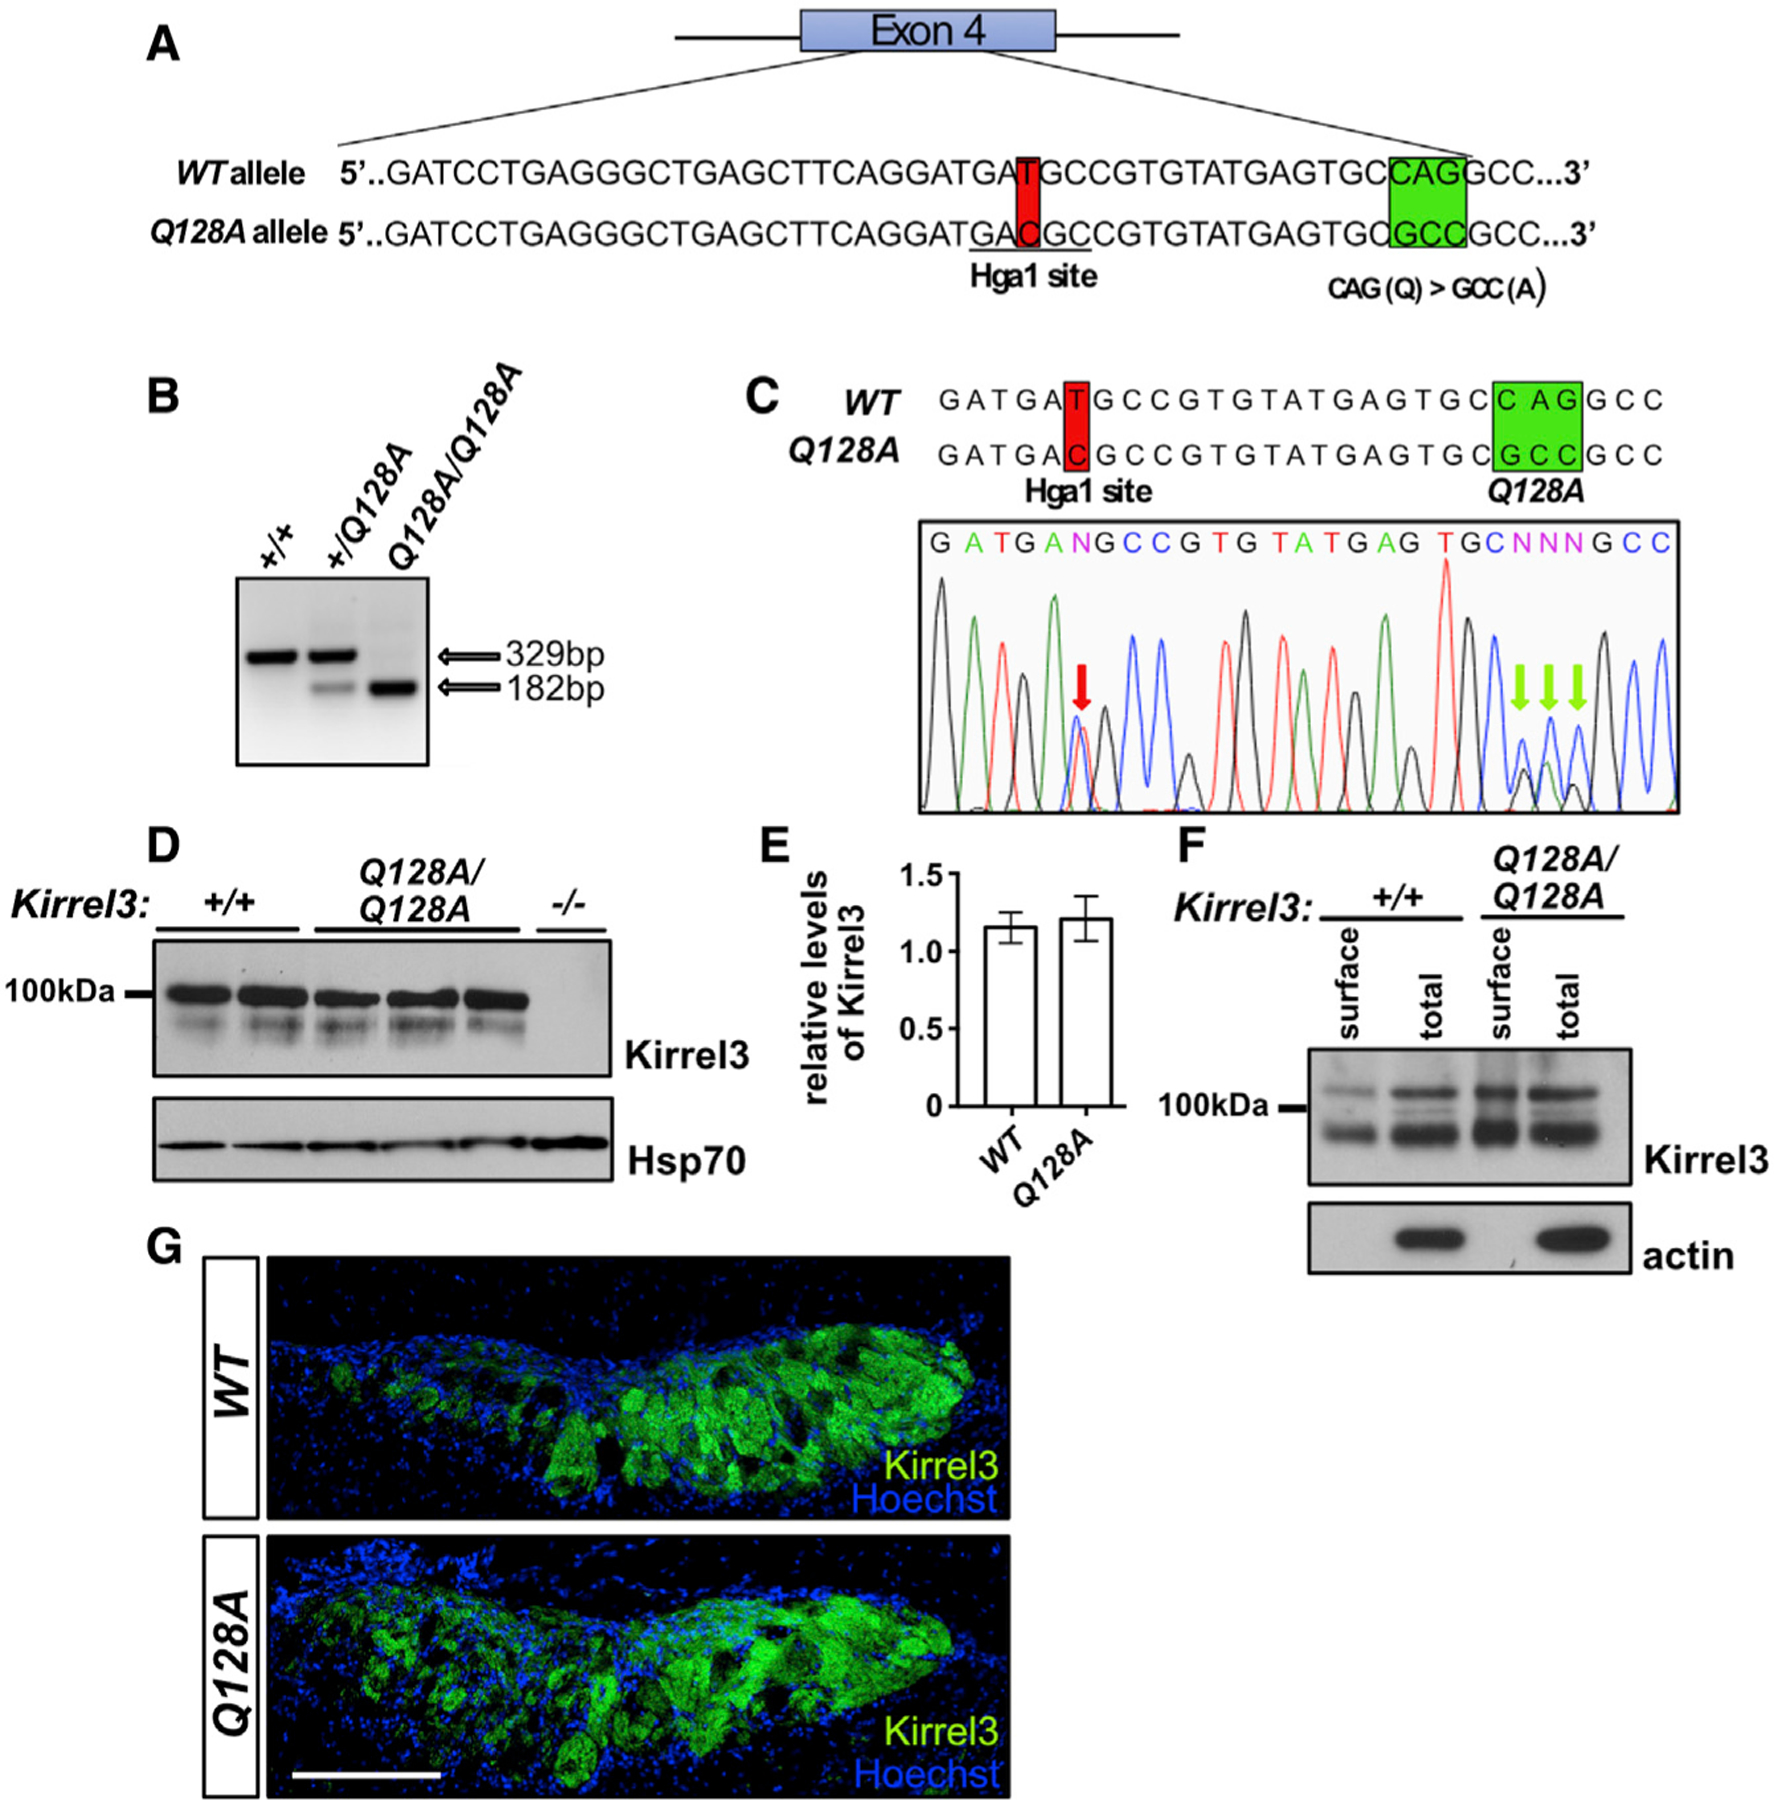
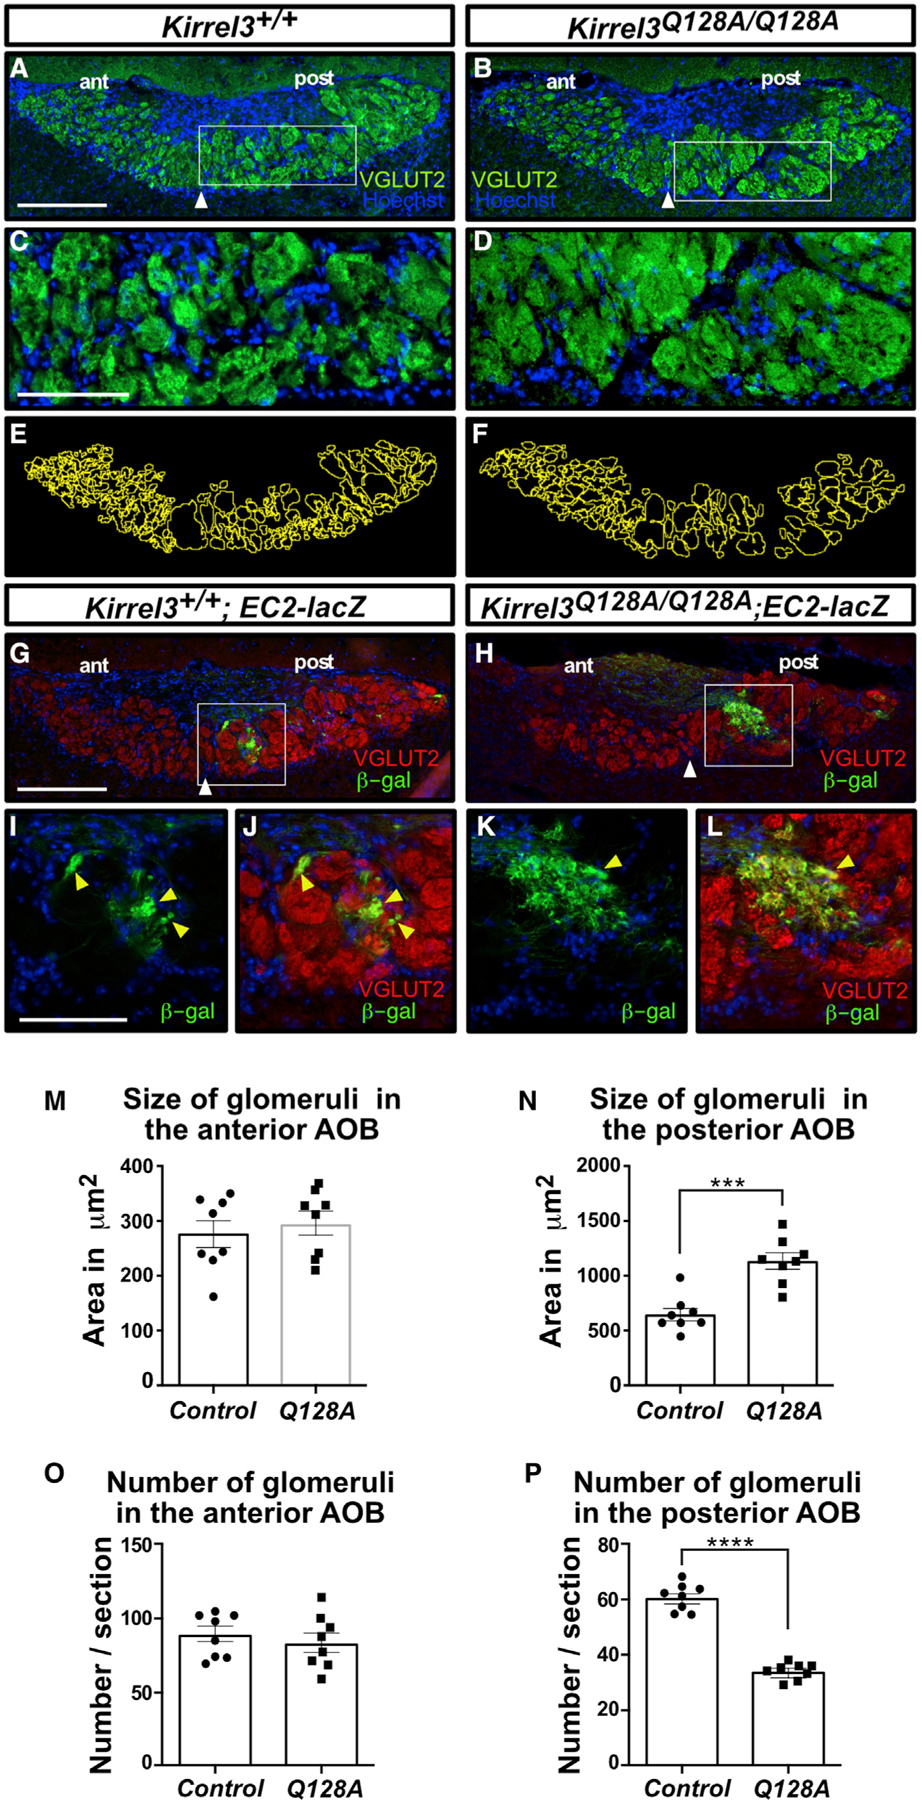
Projections from sensory neurons of olfactory systems coalesce into glomeruli in the brain. The Kirrel receptors are believed to homodimerize via their ectodomains and help separate sensory neuron axons into Kirrel2- or Kirrel3-expressing glomeruli. Here, we present the crystal structures of homodimeric Kirrel receptors and show that the closely related Kirrel2 and Kirrel3 have evolved specific sets of polar and hydrophobic interactions, respectively, disallowing heterodimerization while preserving homodimerization, likely resulting in proper segregation and coalescence of Kirrel-expressing axons into glomeruli. We show that the dimerization interface at the N-terminal immunoglobulin (IG) domains is necessary and sufficient to create homodimers and fail to find evidence for a secondary interaction site in Kirrel ectodomains. Furthermore, we show that abolishing dimerization of Kirrel3 in vivo leads to improper formation of glomeruli in the mouse accessory olfactory bulb as observed in Kirrel3-/- animals. Our results provide evidence for Kirrel3 homodimerization controlling axonal coalescence.

Keywords: Kirrel2; Kirrel3; accessory olfactory system; axonal coalescence; cell adhesion molecule; glomeruli; protein structure; vomeronasal.


Conflict of interest statement

Declaration of interests The authors declare no competing interests.

Figures

Figure 1.
Figure 1.. The three mouse Kirrel D1 homodimers share gross structural features.
(A) The conserved domain structure of Kirrels. SP, signal peptide (N-terminal); TM, transmembrane; WIRS, WAVE regulatory complex-interacting receptor sequence. (B) A multisequence alignment of the mouse Kirrel D1 domains. Secondary structure elements, β strands (yellow arrows), and a 310 helix (purple box) are shown above the alignment. (C) The three mKirrel D1 dimers shown in cartoon representation. Neph1 (Kirrel1) homodimer structure is from Özkan et al. (2014) (Protein Data Bank (PDB) ID: 4OFD). See Table S1 for structure determination statistics for Kirrel2 and Kirrel3 structures. (D) The three mKirrel D1 homodimers are overlayed by aligning the chains shown on the left. Comparisons to structures of fly and worm Kirrel orthologs are provided in Figure S1.
Figure 2.
Figure 2.. Kirrel2 and Kirrel3 have incompatible chemistries at their dimerization interfaces.
(A) Kirrel2 homodimerization interface. The closed oval represents the two-fold symmetry axis surrounded by the bidentate hydrogen bonding (yellow dashes) of two Q52 residues from Kirrel3 monomers. The interface includes an extensive set of hydrogen bonds. (B) Kirrel3 homodimerization interface. None of the hydrogen bonds depicted in (A) are present in the Kirrel3 interface. The hydrogen bonds between the Q52 side chains at the Kirrel2 dimer symmetry axis are replaced by van der Waals contacts between the L69 side chains (orange dashes) in Kirrel3. The loop connecting the C and D strands are significantly different between the two Kirrel structures. The parts of the interface with conserved hydrogen bonding between Kirrel2 and Kirrel3 are shown in Figure S2. Underlined amino acids vary among ancestral vertebrate sequences (see Figure 3C) and are strong candidates to be specificity determinants.
Figure 3.
Figure 3.. Phylogenetic analysis of Kirrels.
(A) Maximum likelihood tree for Kirrels. The scale bar below represents 0.4 substitutions per site. Numbers on the tree are bootstrap values supporting the adjacent node. The sequence logos to the right show the prevalence of amino acids in selected positions at the Kirrel dimerization interface for specific taxa, placed next to their branch in the phylogenetic tree. Sequence logos were calculated using 26 vertebrate Kirrel1 sequences, 17 vertebrate Kirrel2 sequences, 22 vertebrate Kirrel3 sequences, 8 other deuterostome sequences, and 17 protostome sequences. See Figure S3 for the uncollapsed tree with bootstrap support values. (B) Sequence alignment showing all amino acids at the interface; red boxes, 4-Å cutoff used for identifying an interface amino acid. The selected residues used in sequence logos in (A) are marked with an asterisk below. Three positions at the interface that vary among ancestral sequences highlighted in (C) are labeled by closed squares. (C) The three varying residues among sequence reconstructions of the three ancestral gnathostome Kirrels, the Kirrel2/Kirrel3 ancestor, and the ancestral vertebrate Kirrel are shown on the tree. These positions are underlined in the structural views of the interface in Figure 2. See Figure S3 for complete sequences of inferred ancestral D1 domains. (D) Schematic for the co-immunoprecipitation assay performed between Kirrel2/Kirrel3 wild-type proteins and Kirrel3 wild-type/specificity mutant proteins. FLAG, FLAG-tag; 6×His, hexahistidine tag. WT, wild-type. (E) FLAG-tagged wild-type and mutant Kirrel3 ectodomains were used to immunoprecipitate hexahistidine-tagged wild-type Kirrel2 or Kirrel3 ectodomains. Only very low levels of wild-type Kirrel2-His6 can be pulled down with wild-type Kirrel3-FLAG; the pull-down becomes increasingly efficient with the Kirrel3 L79Q mutation and the triple and quadruple mutations. For quantitation of the bands in triplicate, see Figure S3C. (F) The anti-FLAG blot of the samples eluted with FLAG peptide show similar levels of Kirrel3-FLAG captured on anti-FLAG resin in all samples where Kirrel3 FLAG (wild-type or mutant) were included. (G) The expression levels of His6- and FLAG-tagged Kirrels observed with anti-FLAG and anti-His6 antibodies.
Figure 4.
Figure 4.. Mutational analysis of the Kirrel2 and Kirrel3 homodimerization interfaces.
(A and B) SEC elution volumes for wild-type and mutant Kirrel2 D1 (A) and Kirrel3 D1+D2 (B) loaded at multiple concentrations on the columns. A Superdex 75 10/300 column was used for the Kirrel2 D1 runs (left), and a Superdex 200 Increase 10/300 column was used for the Kirrel3 D1+D2 runs, both with a column volume of 24 ml. Expected monomeric and dimeric elution volumes are marked by dashed lines on the plots. See Figure S4 for SEC chromatograms. The structural views to the right show the locations of the amino acids mutated. (C) Four residues observed to be energetically important for Kirrel dimerization mapped onto Kirrel2 structure and shown as a surface (residue names purple and underlined). (D) Sedimentation velocity results for mouse Kirrel2 wild-type (left), Kirrel3 wild-type (middle), and Kirrel3 Q128A (right) ectodomains performed at several initial protein concentrations showing lack of dimerization for the Q128A mutant. The dissociation constant (KD) for wild-type mKirrel2 and mKirrel3 refine to 0.9 μM (0.2 μM, 3.5 μM) and 0.21 μM (0.11 μM, 0.36 μM) (68.3% confidence intervals are shown in brackets). See Figures S4G and S4H for isotherms and fitting for dissociation constants. (E) Cell aggregation assay for Kirrel2 and Kirrel3, wild type and mutants, fused to intracellular GFP, performed with S2 cells; scale bar, 100 μm.
Figure 5.
Figure 5.. SAXS analysis of Kirrel ectodomains.
(A) Pair distance distributions, P(r), for mKirrel3 ectodomains, wild type, and Q128A. Wild-type Kirrel3 is a longer molecule than Kirrel3 Q128A because it has a larger Dmax (35 nm versus 21 nm). (B) Dimensionless Kratky plots for mKirrel3 ectodomains; blue vertical lines are measured errors. Dashed red lines show predicted plots for rigid, globular molecules with the same Rg. (C) Ensemble model fitting of SAXS data for mKirrel3 Q128A ectodomain using EOM. The three-model ensemble with contributions are indicated as percentages next to the models. The scattering profile predicted from the ensemble model (black) closely matches observed scattering data (orange; measurement errors are indicated by vertical bars). (D) SASREF model of mKirrel3 wild-type ectodomain dimer and its predicted scattering (black) overlayed on observed SAXS data (blue; measurement errors are indicated by vertical bars). See also Figure S5.
Figure 6.
Figure 6.. Characterization of the Kirrel3 Q128A mouse.
(A) Diagram of the generation of the Kirrel3 Q128A mouse. Mice carrying a modified Kirrel3 allele containing mutations that modify amino acid 128 from a Q to an A, as well as a silent mutation introducing an HgaI restriction enzyme cutting site for genotyping purposes, were generated. Green square: Q to A mutations; red square: mutation creating an HgaI restriction site. (B and C) Identification of the Kirrel3 Q128A allele by restriction enzyme digest and DNA sequencing. Digestion with HgaI (B) and DNA sequencing (C) of a PCR fragment from exon 4 of the Kirrel3 allele demonstrate the presence of the newly introduced HgaI restriction site. DNA sequencing also reveals the presence of the three nucleotide substitutions resulting in the Q-to-A amino acid substitution in a Kirrel3+/Q128A mouse. The red arrows in the electropherogram in (C) indicate the overlapping peaks caused by the nucleotide substitutions in one of the Kirrel3 alleles. (D and E) Quantification of Kirrel3 protein by western blot of brain lysate collected from Kirrel3+/+ and Kirrel3Q128A/Q128A mice shows that similar levels of Kirrel3 and Kirrel3 Q128A levels are expressed in the brain of these mice, respectively. Data were analyzed using unpaired t test; n = 3 for Kirrel3+/+ and n = 4 for Kirrel3Q128A/Q128A mice. (F) Surface membrane distribution of Kirrel3 Q128A in acute brain slices. Western blots of acute brain slice lysate collected from Kirrel3+/+ and Kirrel3Q128A/Q128A mice following incubation with biotin and isolation of surface proteins by batch streptavidin chromatography. Both Kirrel3 and Kirrel3 Q128A are distributed to the cell surface. (G) Immunohistochemistry on sagittal sections of the AOB from Kirrel3+/+ and Kirrel3Q128A/Q128A adult mice labeled with antibodies against Kirrel3 and Hoechst. The Kirrel3 and Kirrel3 Q128 proteins can be detected in subsets of glomeruli in both the anterior and posterior regions of the AOB in Kirrel3+/+ and Kirrel3Q128A/Q128A mice, respectively. The scale bar represents 200 mm. See also Figure S6.
Figure 7.
Figure 7.. Glomerulus structure is altered in the AOB of Kirrel3Q128A/Q128A mice.
(A–F) Parasagittal sections of the AOB from adult Kirrel3+/+ (A and C) and Kirrel3Q128A/Q128A (B and D) mice labeled with a VGLUT2 antibody and Hoechst (A–D). Higher magnification of outlined regions in (A) and (B) are shown in (C) and (D), respectively. Glomeruli in the posterior region of the AOB in Kirrel3Q128A/Q128A mice appear significantly larger and less numerous than those in Kirrel3+/+ mice (E and F). White arrowheads denote the boundary between the anterior (ant) and posterior (post) regions of the AOB; n > 8 mice for each genotype. (G–L) Parasagittal sections of the AOB from adult Kirrel3+/+; EC2-lacZ (G) and Kirrel3Q128A/Q128A; EC2-lacZ (H) mice labeled with a VGLUT2 (red) and b-galactosidase (green) antibodies and Hoechst (G–L). Higher magnification of outlined regions in (G) and (H) are shown in (I) and (J) and (D) and (L), respectively. EC2-positive axons coalesce into small and well-defined glomeruli in Kirrel3+/+; EC2-lacZ mice (yellow arrowheads; I and J) but innervate larger heterogenous glomeruli in Kirrel3Q128A/Q128A mice (yellow arrowheads in K and L); n = 2 mice for each genotype. (M–P) Quantification of the size and number of glomeruli in the anterior (G and I) and posterior regions (H and J) of the AOB in adult control and Kirrel3Q128A/Q128A mice. A representation of the glomerulus outlining approach used for quantification using sections in (A) and (B) as examples are shown in (E) and (F), respectively. A significant increase in the size of glomeruli in the posterior (control: 644.0 ± 56.2 μm2; Kirrel3Q128A/Q128A: 1,134.1 ± 74.5 μm2), but not anterior (control: 284.0 ± 19.6 μm2; Kirrel3Q128A/Q128A: 295.6 ± 22.1 μm2), region of the AOB is observed in the Kirrel3Q128A/Q128A mice (G and H). There is also a decrease in glomerulus numbers in the posterior (control: 61.15 ± 1.75; Kirrel3Q128A/Q128A: 34.27 ± 1.02), but not anterior (control: 87.21 ± 4.92; Kirrel3Q128A/Q128A: 84.22 ± 6.33), region of the AOB in Kirrel3Q128A/Q128A mice (J). Data were analyzed using unpaired t test; n = 8 mice for each genotype. ****p value < 0.0001 (glomerular counts); ***p value < 0.001 (glomerular size); error bars: ±standard error of the mean (SEM); scale bars, 250 μm in (A) and (B) and 100 μm in (C) and (D).

References

    1. Afonine PV, Grosse-Kunstleve RW, Echols N, Headd JJ, Moriarty NW, Mustyakimov M, Terwilliger TC, Urzhumtsev A, Zwart PH, and Adams PD (2012). Towards automated crystallographic structure refinement with phenix.refine. Acta Crystallogr. D Biol. Crystallogr 68, 352–367. - PMC - PubMed
    1. Bear DM, Lassance J-M, Hoekstra HE, and Datta SR (2016). The Evolving Neural and Genetic Architecture of Vertebrate Olfaction. Curr. Biol 26, R1039–R1049. - PMC - PubMed
    1. Belluscio L, Koentges G, Axel R, and Dulac C (1999). A map of pheromone receptor activation in the mammalian brain. Cell 97, 209–220. - PubMed
    1. Bhalla K, Luo Y, Buchan T, Beachem MA, Guzauskas GF, Ladd S, Bratcher SJ, Schroer RJ, Balsamo J, DuPont BR, et al. (2008). Alterations in CDH15 and KIRREL3 in patients with mild to severe intellectual disability. Am. J. Hum. Genet. 83, 703–713. - PMC - PubMed
    1. Brautigam CA (2015). Calculations and Publication-Quality Illustrations for Analytical Ultracentrifugation Data. Methods Enzymol. 562, 109–133. - PubMed

Publication types

MeSH terms