. 2021 Nov 2;37(5):109944.
doi: 10.1016/j.celrep.2021.109944.

The histone chaperone FACT facilitates heterochromatin spreading by regulating histone turnover and H3K9 methylation states

Affiliations

The histone chaperone FACT facilitates heterochromatin spreading by regulating histone turnover and H3K9 methylation states

Magdalena Murawska et al. Cell Rep. .

Abstract

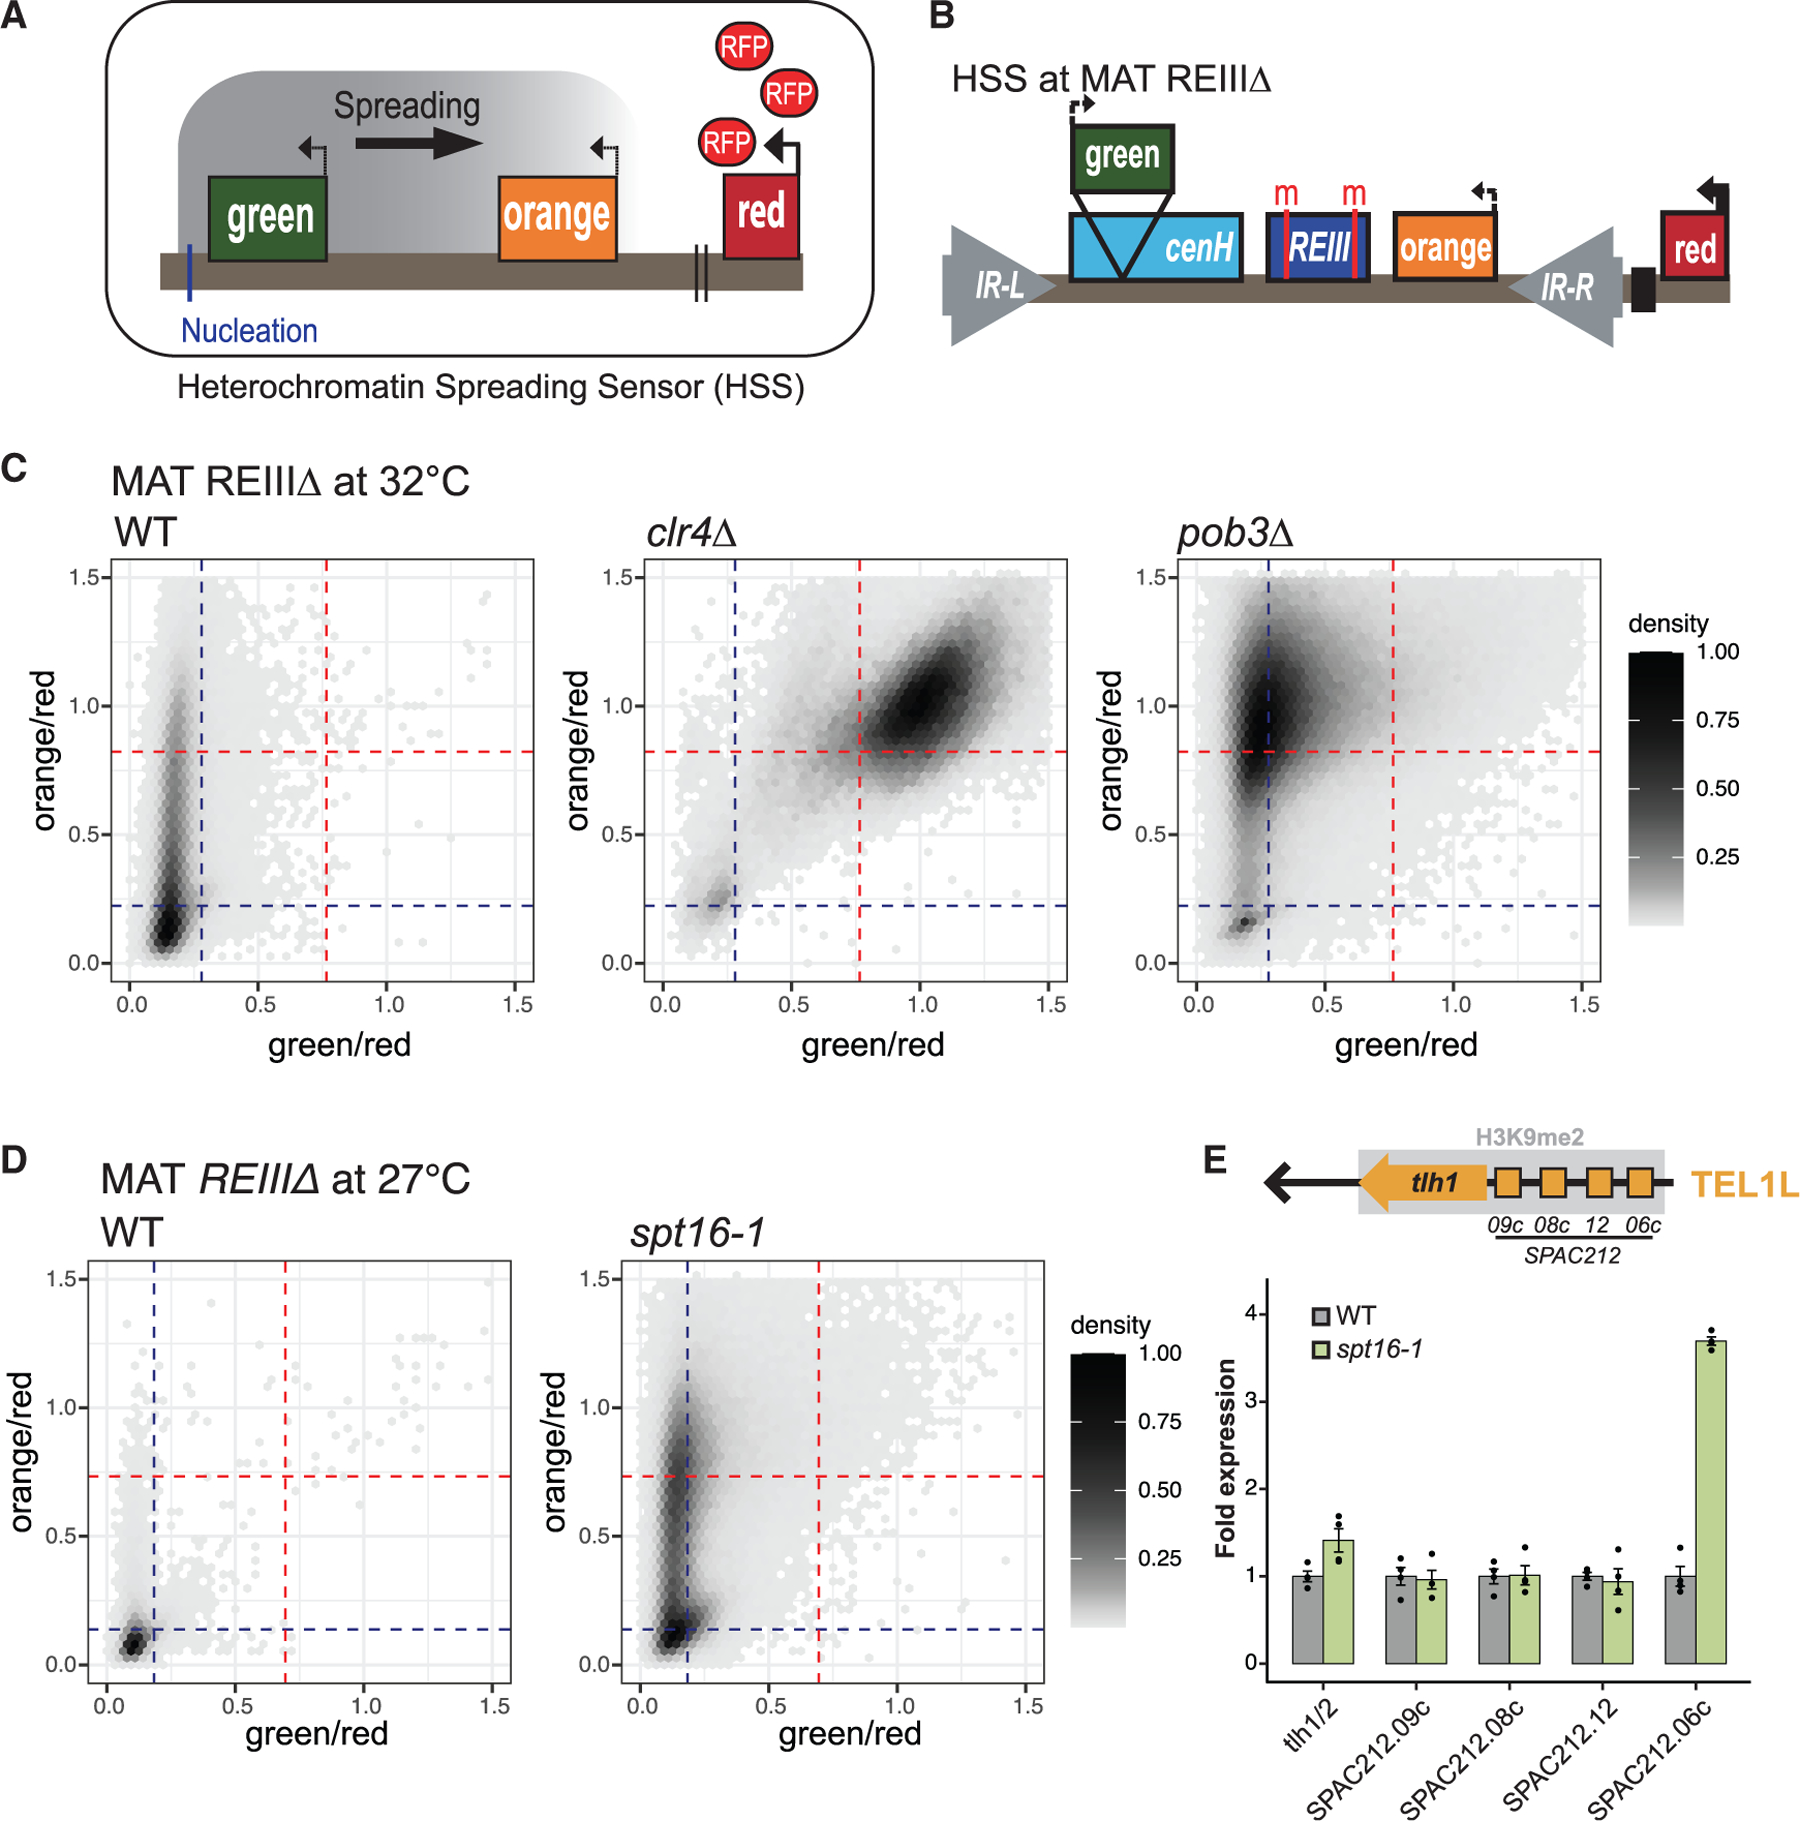
Heterochromatin formation requires three distinct steps: nucleation, self-propagation (spreading) along the chromosome, and faithful maintenance after each replication cycle. Impeding any of those steps induces heterochromatin defects and improper gene expression. The essential histone chaperone FACT (facilitates chromatin transcription) has been implicated in heterochromatin silencing, but the mechanisms by which FACT engages in this process remain opaque. Here, we pinpoint its function to the heterochromatin spreading process in fission yeast. FACT impairment reduces nucleation-distal H3K9me3 and HP1/Swi6 accumulation at subtelomeres and derepresses genes in the vicinity of heterochromatin boundaries. FACT promotes spreading by repressing heterochromatic histone turnover, which is crucial for the H3K9me2 to me3 transition that enables spreading. FACT mutant spreading defects are suppressed by removal of the H3K9 methylation antagonist Epe1. Together, our study identifies FACT as a histone chaperone that promotes heterochromatin spreading and lends support to the model that regulated histone turnover controls the propagation of repressive methylation marks.

Keywords: Epe1; FACT; heterochromatin spreading; histone chaperone; histone turnover.


Conflict of interest statement

Declaration of interests A.G.L. is a founder, CSO, shareholder, and managing director of Eisbach Bio GmbH, a biotechnology company developing cancer medicines. All other authors declare no competing interests.

Figures

Figure 1.
Figure 1.. Transcriptional silencing is impaired in the FACT mutant
(A) Schizosaccharomyces pombe chromosomes with indicated heterochromatin loci. CEN, pericentromere; MAT, mating-type locus; rDNA, ribosomal DNA; TEL, subtelomere. (B) H3K9me2 ChIP-seq enrichment [normalized log2(ChIP/Input)] at subtelomeres and pericentromeres in WT and pob3Δ on chromosomes I and II. Gray indicates WT, and blue indicates pob3Δ. Both (+) and (−) DNA strands are shown with gene coding (mRNA), noncoding (ncRNA), tRNA, and pseudogenes. Dark gray bars over the graphs point to the localization of H3K9me2 in the WT strain. (C) Box plot of H3K9me2 ChIP-seq enrichment [normalized log2(ChIP/Input)] calculated in 250-bp bins in WT and pob3Δ. The average of two biological replicates is shown. EU, rest of the genome (euchromatin). (D) RT-qPCR analysis. Expression of pericentromeric (imr, dg) and subtelomeric (tlh1/2) transcripts in pob3Δ relative to WT after normalization to act1+. n = 5 to 6 biological replicates. Data are presented as the mean ± SEM. Statistical analysis (one-way ANOVA) was done on log2-transformed values. (E) Box plots of RNAPII Ser2P and H2Bub ChIP-seq enrichment [normalized log2(ChIP/Input)] calculated in 250-bp bins in WT and pob3Δ. The average of two biological replicates is shown. Labeling as in (C). (F and G) RT-qPCR analysis. Expression of heterochromatin transcripts in pob3Δ, paf1Δ, and pob3Δpaf1Δ (F) or pob3Δ, res2Δ, and pob3Δres2Δ (G) relative to WT after normalization to act1+. n = 3 biological replicates. Data are presented as the mean ± SEM. Statistical analysis performed as in (D). Different letters denote significant differences with a Tukey post hoc test at p < 0.05. See also Figure S1 and Table S3.
Figure 2.
Figure 2.. FACT mutants have heterochromatin spreading defects at engineered and endogenous heterochromatin
(A) Heterochromatin spreading sensor (HSS) scheme. (B) REIIIΔ reporter scheme. Red bars and red “m” letters denote mutation of the Aft1/Pcr1 binding sites. (C) Two-dimensional-density hexbin plot showing the red-normalized green and orange fluorescence for WT, clr4Δ, and pob3Δ MAT_REIIIΔ cells grown at 32°C. A density bar represents the fraction of the most dense bin. Threshold values for the fully expressed state (“on”) and fully repressed state (“off”) in each color are indicated by red and blue guide lines, respectively. One (WT, clr4Δ) or four (pob3Δ) independent isolates were analyzed and are shown in a combined plot. (D) Two-dimensional-density hexbin plot showing the red-normalized green and orange fluorescence for WT and spt16–1 MAT_REIIIΔ cells grown at 27°C. One (WT) or four (spt16–1) independent isolates were analyzed and are shown in a combined plot. Labeling as in (C). (E) RT-qPCR analysis. Expression of transcripts at TEL1L at 27°C in spt16–1 relative to WT after normalization to act1+. The TEL1L gene array scheme is shown above the graph. n = 4 biological replicates. Data are presented as the mean ± SEM.
Figure 3.
Figure 3.. Deletion of epe1+ suppresses FACT silencing and spreading defects
(A, C, and E) Silencing reporter assay at the mat locus. Five-fold serial dilutions of WT, pob3Δ, and three independent isolates of the specified single and double mutants were grown on the indicated media. (B, D, and F) RT-qPCR analysis. Expression of imr and tlh1/2 transcripts in the indicated strains relative to WT after normalization to act1+. n = 3 (B) or 4 (D and F) biological replicates. Data are presented as the mean ± SEM. One-way ANOVA was done on log2-transformed values. Different letters denote significant differences with a Tukey post hoc test at p < 0.05. (G) RT-qPCR analysis. Expression of transcripts at TEL1L in pob3Δ, epe1Δ, and pob3Δepe1Δ relative to WT after normalization to act1+. n = 4 biological replicates. Data are presented as the mean ± SEM. One-way ANOVA was done on log2-transformed values. Different letters denote significant differences with a Tukey post hoc test at p < 0.05. (H) Two-dimensional-density hexbin plot showing the red-normalized green and orange fluorescence for spt16–1epe1Δ MAT_REIIIΔ cells grown at 27°C. Three independent isolates were analyzed and are shown in a combined plot. Labeling as in Figure 2C. See also Figure S3 and Table S3.
Figure 4.
Figure 4.. FACT facilitates H3K9me2 to H3Kme3 transition by suppressing histone turnover
(A, B, and D) H3K9me2 (A), H3K9me3 (B), and Swi6 (D) ChIP-qPCR at pericentromeres and TEL1L in WT and spt16–1. The TEL1L gene array is shown above the graphs. ChIP was normalized to the average of three euchromatic regions. n = 3 biological replicates. Data are presented as the mean ± SEM. The p values were obtained by linear mixed effect regression (*p < 0.05; **p < 0.01; ***p < 0.001). ns, not significant (p ≥ 0.05). (C and E) RT-qPCR analysis. Expression of dg and tlh1/2 transcripts in the indicated strains relative to WT after normalization to act1+. The spt16–1, fft3Δ, spt16–1fft3Δ, and corresponding WT were shifted to 37°C for 1.5 h. n = 3 biological replicates. Data are presented as the mean ± SEM. One-way ANOVA was done on log2-transformed values. Different letters denote significant differences with a Tukey post hoc test at p < 0.05. (F) Histone turnover assay scheme. (G) ChIP-qPCR of the new histone (H3-T7) at TEL1L in WT, pob3Δ, and pob3Δepe1Δ. Input-normalized ChIP signals from the uninduced samples (0 h) were subtracted from the input-normalized signals from the b-estradiol-induced samples (4 h). Error bars represent ± SEM from three independent experiments. One-way ANOVA was done on log2-transformed values. Different letters denote significant differences with a Tukey post hoc test at p < 0.05. See also Figure S4 and Table S3.

References

    1. Al-Sady B, Greenstein RA, El-Samad HJ, Braun S, and Madhani HD (2016). Sensitive and Quantitative Three-Color Protein Imaging in Fission Yeast Using Spectrally Diverse, Recoded Fluorescent Proteins with Experimentally-Characterized In Vivo Maturation Kinetics. PLoS ONE 11, e0159292. - PMC - PubMed
    1. Al-Sady B, Madhani HD, and Narlikar GJ (2013). Division of labor between the chromodomains of HP1 and Suv39 methylase enables coordination of heterochromatin spread. Mol. Cell 51, 80–91. - PMC - PubMed
    1. Alabert C, Loos C, Voelker-Albert M, Graziano S, Forné I, Reveron-Gomez N, Schuh L, Hasenauer J, Marr C, Imhof A, and Groth A. (2020). Domain Model Explains Propagation Dynamics and Stability of Histone H3K27 and H3K36 Methylation Landscapes. Cell Rep 30, 1223–1234.e8. - PubMed
    1. Allshire RC, and Ekwall K. (2015). Epigenetic Regulation of Chromatin States in Schizosaccharomyces pombe. Cold Spring Harb. Perspect. Biol 7, a018770. - PMC - PubMed
    1. Aygün O, Mehta S, and Grewal SI (2013). HDAC-mediated suppression of histone turnover promotes epigenetic stability of heterochromatin. Nat. Struct. Mol. Biol 20, 547–554. - PMC - PubMed

Publication types

MeSH terms