. 2021 Dec 2;81(23):4861-4875.e7.
doi: 10.1016/j.molcel.2021.10.007. Epub 2021 Nov 2.

Transcriptional and chromatin-based partitioning mechanisms uncouple protein scaling from cell size

Affiliations

Transcriptional and chromatin-based partitioning mechanisms uncouple protein scaling from cell size

Matthew P Swaffer et al. Mol Cell. .

Abstract

Biosynthesis scales with cell size such that protein concentrations generally remain constant as cells grow. As an exception, synthesis of the cell-cycle inhibitor Whi5 "sub-scales" with cell size so that its concentration is lower in larger cells to promote cell-cycle entry. Here, we find that transcriptional control uncouples Whi5 synthesis from cell size, and we identify histones as the major class of sub-scaling transcripts besides WHI5 by screening for similar genes. Histone synthesis is thereby matched to genome content rather than cell size. Such sub-scaling proteins are challenged by asymmetric cell division because proteins are typically partitioned in proportion to newborn cell volume. To avoid this fate, Whi5 uses chromatin-binding to partition similar protein amounts to each newborn cell regardless of cell size. Disrupting both Whi5 synthesis and chromatin-based partitioning weakens G1 size control. Thus, specific transcriptional and partitioning mechanisms determine protein sub-scaling to control cell size.

Keywords: cell cycle; cell size; cell size control; gene expression; scaling.


Conflict of interest statement

Declaration of interests The authors declare no competing interests.

Figures

Figure 1 ∣
Figure 1 ∣. WHI5 mRNA does not scale with cell size
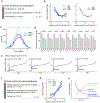
See also Figures S1&S3. (A-C) Schematics illustrating scaling and sub-scaling gene expression. (A) Total protein and RNA copy numbers per cell generally scale with to cell volume so that concentrations remain constant during growth. (B) However, some proteins sub-scale with size such that protein amounts are constant as a function of size and therefore protein concentrations decrease with cell size, which (C) could result from regulation at any step of gene expression. (D-F) Cells in S/G2/M were sorted into four bins based on the intensity of total protein dye. See Fig. S1 and STAR Methods for details. (D) Histogram of total protein content per cell in each bin remeasured after sorting. (E) Normalized Transcripts Per Million (TPM / mean TPM) for WHI5 and MDN1 mRNA in cells of different sizes (total protein content). The mean (±range) of two biological replicates is plotted. Changes in TPM are proportional to changes in mRNA concentration. (F) Normalized TPM x total-mRNA for WHI5 and MDN1 mRNA in cells of different sizes (total protein content). Mean (±range) of two biological replicates is plotted. Changes in TPM x total mRNA are proportional to changes in mRNA amount. Relative total mRNA per cell was determined by the number of reads relative to those from a fixed number of S. pombe cells added to the sample. (G-I) single-molecule Fluorescence In Situ Hybridization (smFISH) analysis of WHI5 and MDN1 mRNA. (G) Representative smFISH images. (H&I) mRNA counts per cell as a function of cell volume for WHI5 and MDN1 determined by smFISH, n=567 cells. Linear regression (solid line) and 95% confidence interval (dashed lines) are shown. Data are pooled from two biological replicates. The same data with replicates plotted independently are shown in Fig. S3A&B.
Figure 2 ∣
Figure 2 ∣. WHI5 sub-scaling occurs across the cell cycle and is encoded in the WHI5 promoter
See also Figures S1&S3. (A-D) G1 cells of different sizes (small, medium, and large) were arrested for increasing amounts of time in G1 using a temperature sensitive cdc28-13 allele at 37°C. Cells were then released from G1 to progress synchronously through a full cell cycle and analyzed by RNA-seq. See Fig. S2 for details. (A) DNA content analysis determined by flow cytometry. (B) Size distributions at point of release from G1 arrest (top panel) and at mid S-phase (bottom panel, corresponds to the 40-minute time point). (C) WHI5 mRNA TPM and (D) the Area Under the Curve (AUC) of mean normalized WHI5 mRNA TPM for small, medium large cells synchronously progressing through the cell cycle. The AUC mean (± range) of two biological replicates is plotted. (E) mRNA counts per cell for WHI5 as a function of cell size in early S/G2/M cells determined by smFISH; n=156 cells. Early S/G2/M cells were defined as budded cells with a small (≤ 0.2) bud-to-mother volume ratio. Linear regression (solid line) and 95% confidence interval (dashed lines) are shown. Data are pooled from two biological replicates. The same data with replicates plotted independently, including data for MDN1, are shown in Fig. S3E&F. (F-H) Protein synthesis rates normalized to the mean as a function of cell volume at budding were determined by time-lapse fluorescence microscopy measuring Whi5-mCitrine expressed from (F) the endogenous WHI5 promoter or (H) the ACT1 promoter, and (G) mCitrine expressed alone from the WHI5 promoter. Synthesis rates were determined as in Schmoller et al. (2015) for single cells using linear fits to protein amount traces for the period between bud emergence and cytokinesis (S/G2/M). Data are binned according to cell volume at budding and the mean (±SEM) of each bin is plotted. Un-binned single-cell values from the same data are plotted in Fig. S3G-I.
Figure 3 ∣
Figure 3 ∣. Histones are a rare class of sub-scaling genes
See also Figures S1-2 & S4-6. (A) Gene ontology terms enriched in sub-scaling genes. 9 of the 16 sub-scaling genes encode histones and one is WHI5. See Fig. S4A and STAR Methods for classification details. (B) Normalized TPM (TPM / mean TPM) for sub-scaling histone mRNAs in cells of different sizes (total protein content). The mean (±range) of two biological replicates is plotted. Changes in TPM are proportional to changes in mRNA concentration. See Fig. S1 for experimental details. (C) HTB2 mRNA TPM for small, medium, and large cells synchronously progressing through the cell cycle as in Fig. 2C-D. See Fig. S2 for experimental details. (D) The Area Under the Curve (AUC) of mean normalized sub-scaling histone mRNA TPM of small, medium, and large cells synchronously progressing through the cell cycle. The AUC mean (±range) of two biological replicates is plotted. (E) Pearson correlation coefficient R for the correlation between Histone mRNA levels, relative to wild-type, in 1,484 gene deletion strains (Kemmeren et al., 2014; O'Duibhir et al., 2014) and the cell size of the respective gene deletions for four different data sets of size measurements (Hoose et al., 2012; Jorgensen et al., 2002; Ohya et al., 2005; Soifer and Barkai, 2014). Each point represents an individual mRNA species. Histone mRNAs are shown in blue. The individual regression fits for the histone transcript levels with cell size determined by Jorgensen et al. are shown in Fig. S4D. (F) Gene ontology terms enriched in super-scaling genes. See Fig. S6A and STAR Methods for classification details. (G) Normalized TPM (TPM / mean TPM) for example super-scaling mRNAs, specifically those known as targets of the SBF transcription factor, in cells of different sizes (total protein content). The mean (±range) of two biological replicates is plotted. Changes in TPM are proportional to changes in mRNA concentration. See Fig. S1 for experimental details. (H) Schematics illustrating the scaling, sub-scaling and super-scaling trends of gene expression, representative of most genes, WHI5 and histones, and a subset of SBF targets respectively.
Figure 4 ∣
Figure 4 ∣. Histone protein synthesis does not scale with cell size
(A-C) Analysis of size-dependent expression in the genome-wide collection of GFP fusion strains measured by flow-cytometry (Parts et al., 2014). The slope of the linear fit between cell size (SCC-A) and GFP signal in budded cells was used to estimate the degree of size-dependence for each protein. See STAR Methods for details. (A) Plot of example protein-GFP levels (intensities normalized to the mean intensity) against cell size. Grey dots denote bin means. Red lines show the linear regression to the un-binned data. (B) Slope values of 1752 proteins analyzed in two replicates. Slopes closer to 0 correspond to sub-scaling behavior. Histone proteins are shown in blue. (C) Average slope values for histones (blue) and all other proteins (grey). Four histone were present in the 1752 proteins analyzed. Histone proteins have significantly smaller slopes than the average protein (** p=0.0014; **** p <0.0001). (D) The amount of mCitrine (expressed from the scaling ACT1 promoter), Hta2-GFP, and Htb2-GFP synthesized (ΔFP normalized to its mean) between birth and division plotted against the amount of cell growth (Δvolume normalized to its mean) determined by single cell time-lapse fluorescence microscopy. Data are binned by Δvolume and the bin means (±SEM) are plotted. Dashed line shows perfect scaling (x=y). (E) Slope of the robust linear fits to single cell values of ΔFP against Δvolume. Error bars show the standard error of the slope. Slopes for Whi5 scaling are also shows for comparison.
Figure 5 ∣
Figure 5 ∣. Maintenance of Whi5 sub-scaling requires chromatin-based partitioning during asymmetric division
See also Figure S7. (A) Schematic illustrating the different regimes of protein partitioning at cell division which can be quantified by comparing the mother-to-bud protein concentration ratio at cytokinesis. A ratio ~ 1 is expected for proteins partitioned in proportion to volume. A ratio > 1 is expected for proteins that are partitioned by protein amounts. (B) The bud-to-mother concentration ratios for Whi5-mCitrine, free mCitrine, and Whi5(WIQ)-mCitrine at cytokinesis. Whi5(WIQ)-mCitrine has reduced recruitment to DNA (Travesa et al., 2013) (Fig. 5C & S7A). **** p < 0.0001.. (C) Anti-Flag ChIP-seq experiments were performed to compare Whi5, Whi5(WIQ) and GFP-NLS. Average RPM metagene plot upstream of all SBF regulated genes (as defined by Ferrezuelo et al., 2010) is shown. ChIP signal around individual SBF binding sites, including additional replicates and controls, is shown in Fig S7A.. (D) Computational simulation of protein amounts at birth as a function of daughter cell volume. Four conditions were simulated where protein expression was either in proportion to cell size (scaling) or independent of cell size (sub-scaling), and protein partitioning is either by amount or in proportion to cell volume. See STAR methods for details. Individual simulated cells (light blue) as well as bin means (dark blue) are plotted. Protein concentrations from the same simulation are shown in Fig. S7B. (E) Protein amount at birth (normalized to the mean) as a function of daughter cell volume at birth for WHI5pr-WHI5-mCitrine and WHI5pr-WHI5(WIQ)-mCitrine cells. Data are binned according to cell size at birth and the bin means (±SEM) are plotted. Un-binned single-cell values of the same data are plotted in Fig. S7C. (F) Example time-lapse images of WHI5-mCitirine MYO1-3xmKate2 cells before, during, and after cytokinesis (from left to right), defined as the moment of Myo1 loss from the bud neck.
Figure 6 ∣
Figure 6 ∣. Disruption of Whi5 sub-scaling weakens G1 size control
See also Figure S8. (A) Median cell volume (average of two independent measurements), measured by Coulter counter of cells expressing WHI5pr-WHI5-mCitrine (grey) or TETpr-WHI5-mCitrine-PEST (blue) in the presence of anhydrotetracycline to induce expression from the size-scaling TET promoter. The fused PEST domain destabilizes Whi5 to eliminate Whi5 synthesized in the preceding cell cycle from new-born G1 cells. (B-F) Single cell time-lapse microscopy was performed on bck2Δ strains expressing either WHI5pr-WHI5-mCitrine or TETpr-WHI5-mCitrine-PEST. All analysis is restricted to daughter cells. D-F show binned data where no more than 2 cells are outside the bin limits. (B) Mean Whi5 concentration (±SEM) as a function of time from birth in all daughter cells that completed G1. (C) Mean Whi5 concentration (±SEM) at 42 minutes after birth as a function of daughter cell volume at birth in all cells that completed G1. (D) Cell growth in G1 as a function of cell volume at birth for daughter cells that completed G1. Data are binned according to cell volume at birth and the bin means (±SEM) are plotted. Un-binned single-cell values of the same data are plotted in Fig. S8C-D. (E) Cell volume growth during S/G2/M (i.e. between the first budding event and the subsequent cell division) as a function of cell volume at budding. Data are binned according to cell volume at budding for all cells that completed the cell cycle and the bin means (±SEM) are plotted. (F) Cell volume growth between birth and cell division as a function of cell volume at birth. Data are binned according to cell volume at birth for cells with a completed cell cycle and the bin means (±SEM) are plotted.
Figure 7 ∣
Figure 7 ∣. Summary schematic
A small class of genes including the cell cycle inhibitor WHI5 and histones are transcribed in a sub-scaling manner, resulting in sub-scaling protein synthesis during the cell cycle. Sub-scaling proteins must also be partitioned independent of daughter cell size to retain sub-scaling after cell division, which is achieved through chromatin-based partitioning.

Similar articles

Cited by

References

    1. Andrews BJ, and Herskowitz I (1989). Identification of a DNA binding factor involved in cell-cycle control of the yeast HO gene. Cell 57, 21–29. - PubMed
    1. Azizoğlu A, Brent R, and Rudolf F (2020). A precisely adjustable, variation-suppressed eukaryotic transcriptional controller to enable genetic discovery. bioRvix 2019.12.12.874461. - PMC - PubMed
    1. Barber F, Amir A, and Murray AW (2020). Cell-size regulation in budding yeast does not depend on linear accumulation of Whi5. Proc Natl Acad Sci U S A 117, 14243–14250. - PMC - PubMed
    1. Chandler-Brown D, Schmoller KM, Winetraub Y, and Skotheim JM (2017). The Adder Phenomenon Emerges from Independent Control of Pre- and Post-Start Phases of the Budding Yeast Cell Cycle. Curr Biol 27, 2774–2783 e2773. - PMC - PubMed
    1. Chen Y, Zhao G, Zahumensky J, Honey S, and Futcher B (2020). Differential Scaling of Gene Expression with Cell Size May Explain Size Control in Budding Yeast. Mol Cell 78, 359–370 e356. - PMC - PubMed

Publication types