. 2021 Dec 8;29(12):1815-1827.e6.
doi: 10.1016/j.chom.2021.10.001. Epub 2021 Nov 2.

Mice with diverse microbial exposure histories as a model for preclinical vaccine testing

Affiliations

Mice with diverse microbial exposure histories as a model for preclinical vaccine testing

Jessica K Fiege et al. Cell Host Microbe. .

Abstract

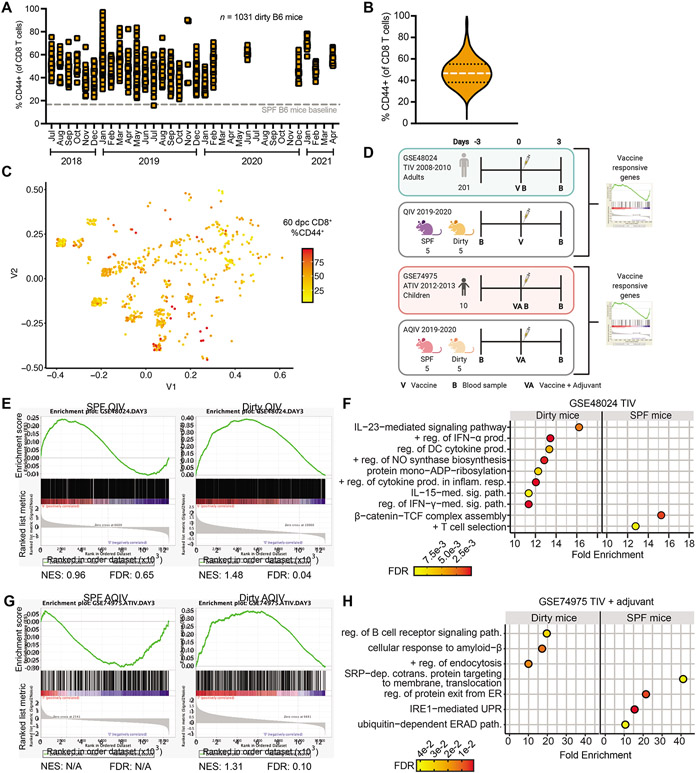
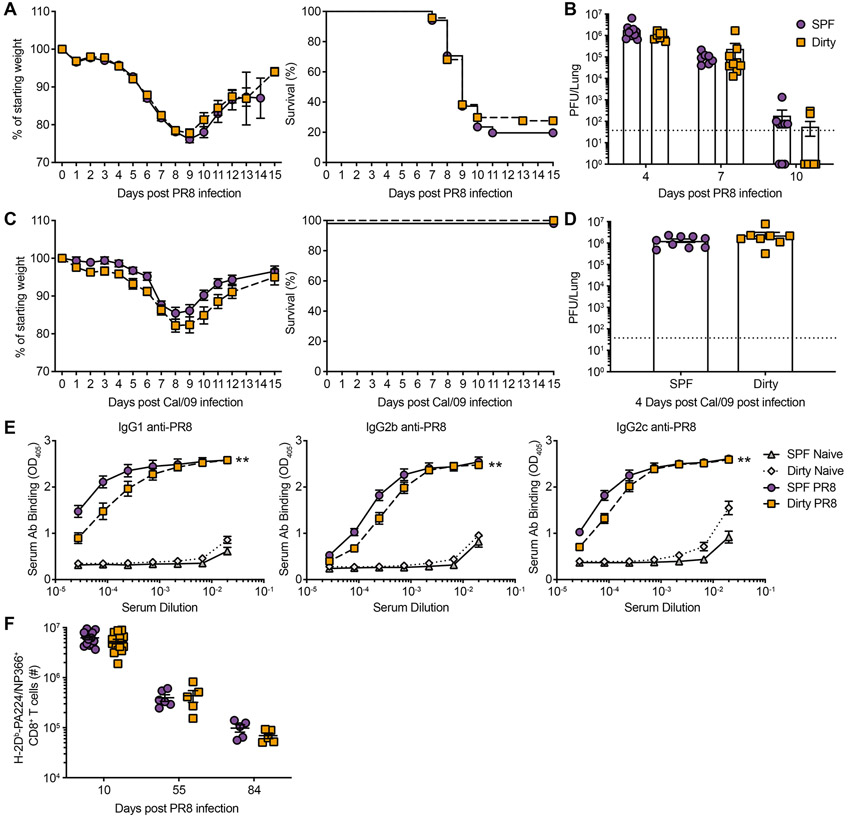
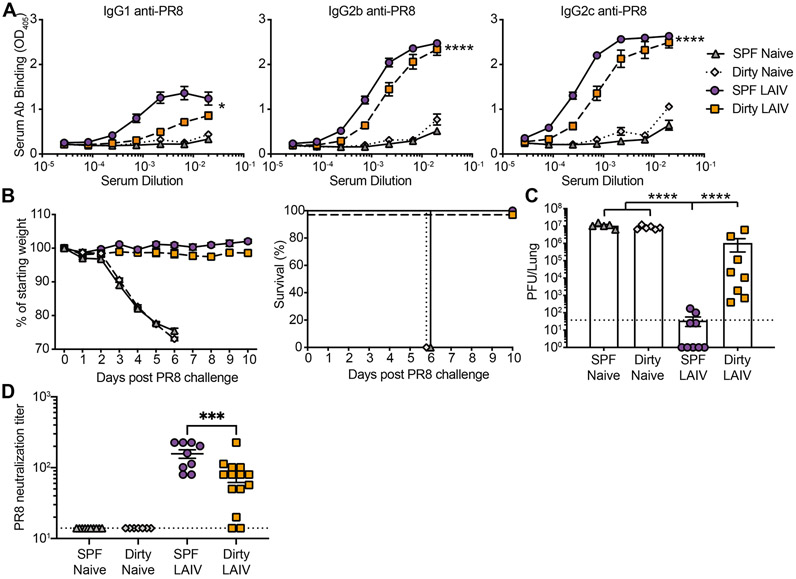
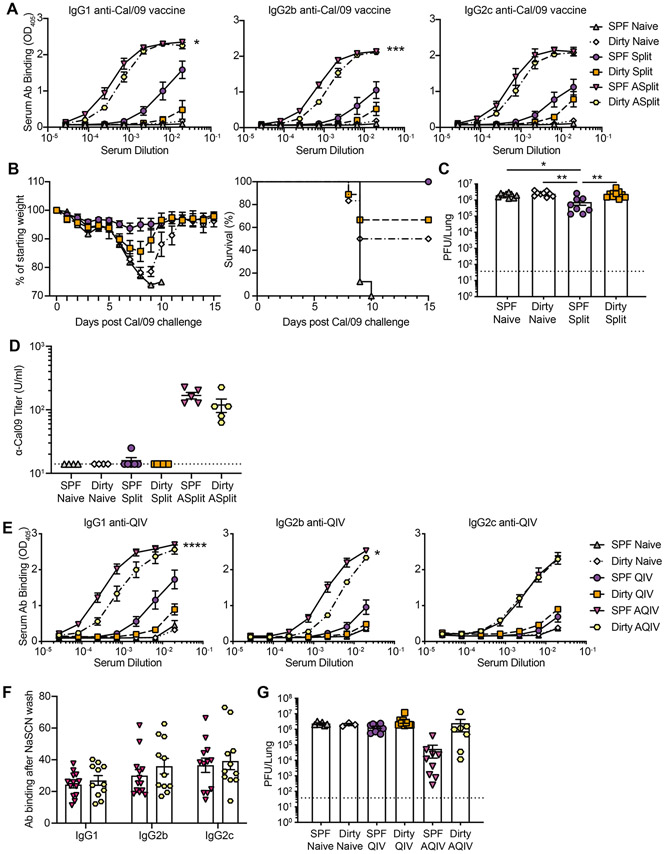
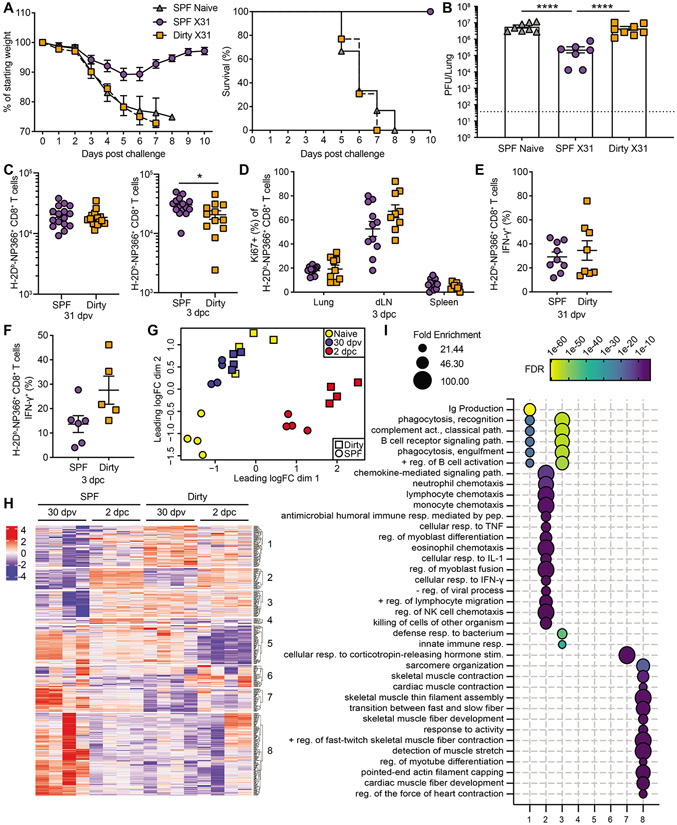
Laboratory mice comprise an expeditious model for preclinical vaccine testing; however, vaccine immunogenicity in these models often inadequately translates to humans. Reconstituting physiologic microbial experience to specific pathogen-free (SPF) mice induces durable immunological changes that better recapitulate human immunity. We examined whether mice with diverse microbial experience better model human responses post vaccination. We co-housed laboratory mice with pet-store mice, which have varied microbial exposures, and then assessed immune responses to influenza vaccines. Human transcriptional responses to influenza vaccination are better recapitulated in co-housed mice. Although SPF and co-housed mice were comparably susceptible to acute influenza infection, vaccine-induced humoral responses were dampened in co-housed mice, resulting in poor control upon challenge. Additionally, protective heterosubtypic T cell immunity was compromised in co-housed mice. Because SPF mice exaggerated humoral and T cell protection upon influenza vaccination, reconstituting microbial experience in laboratory mice through co-housing may better inform preclinical vaccine testing.

Keywords: T cell immunity; dirty mice; humoral immunity; influenza virus; preclinical models; vaccine.


Conflict of interest statement

Declaration of interests The authors declare no competing interests.

Figures

Figure 1:
Figure 1:. Cohousing better recapitulates vaccine-induced transcriptional signatures observed in humans.
(A and B) Mice from 3 different pet stores over a 34-month period were housed with SPF C57BL/6 mice. CD44 expression by bloodborne CD8+ T cells was determined 60 days after cohousing and (A) graphed by date of experiment or (B) volume plot of all animals combined, n=1031. 16.68% of CD8+ T cells expressed CD44 in age-matched SPF B6 mice (dotted line in A). (C) Multidimensional scaling plot of serology from cohoused mice at 60 days post cohousing, n=719. Distances represent similarities in past exposure to 18 pathogens. (D) Model demonstrating experimental design for comparing vaccinated SPF and dirty mice to vaccinated humans. (E and G) PBMCs were harvested on −3 and 3-days post vaccination with 2019-2020 QIV or AQIV. Vaccine responsive genes were generated comparing day 3 to −3 and these lists were queried humans vaccinated with TIV (GSE48024) or ATIV GSE74975 and compared by GSEA. Normalized enrichment score (NES) (F and H) Gene Ontology (GO) of mouse genes enriched in humans with and adjusted p value <0.01 using Panther. For (F) plotted GO terms had false discovery rate (FDR) <0.01 and fold enrichment (FE) >10. For (H) plotted GO terms had FDR <0.05 and FE >5.
Figure 2:
Figure 2:. SPF and dirty mice exhibit similar primary responses to influenza virus.
Dirty and SPF mice were infected with either 40 PFU of PR8 (A to B and E to F) or 5000 PFU Cal/09 (C to D). Animals evaluated for weight loss (A and C) and pulmonary virus titers on indicated days post infection (dpi) (B and D). Dotted line, limit of detection (LOD) 37.5. At 50+ dpi, serum was assessed by ELISA to detect IgG1-, IgG2b- and IgG2c- PR8-specific antibodies (E). At 10, 55 and 84 dpi lungs were harvested and the number of H-2Db-PA224/NP366+ CD44+ CD8+ T cells from the lung was determined (F). Data (A to D) are representative of 4 and 2 independent experiments for PR8 and Cal/09, respectively with 4-9 mice per group. These data (E) are a combination of 5 independent experiments with at least 7 mice per group. These data (H) are a combination of 5 independent experiments with at least 5 mice per group. Significance (B, D, and F) was determined using student unpaired two-tailed t-test. Significance (E) was determined using AUC and one-way ANOVA. Error bars indicate mean ± SEM. *p < 0.05, ** p < 0.01, *** p < 0.001.
Figure 3:
Figure 3:. Reduced immunogenicity and efficacy of live attenuated vaccination in dirty mice.
SPF and dirty mice were untreated or vaccinated with 1000 PFU LAIV i.n. (A) Serum harvested at 30 days post vaccination (dpv) was assessed for anti-PR8 antibodies. (B) 30 days after vaccination mice were challenged with 1000 PFU PR8 and weight loss was monitored. Animals that lost >25% of starting weight were euthanized. (C) Pulmonary virus titer at 3 days post challenge (dpc). (D) Antibodies from (A) were evaluated for neutralization of PR8. Dotted line (C) LOD 37.5, (D) LOD 14. The data (A) are a combination of 2 independent experiments with at least 10 mice per group. The data (B-D) are a combination of 2 independent experiments with at least 6 mice per group. Significance (A) was determined using AUC and one-way ANOVA. Significance (C-D) was determined using one-way ANOVA. Error bars indicate mean ± SEM. *p < 0.05, ** p < 0.01, *** p < 0.001, **** p < 0.0001.
Figure 4:
Figure 4:. Reduced immunogenicity and efficacy of split killed vaccination with and without adjuvant in dirty mice.
(A to D) SPF and dirty mice were untreated or vaccinated with Cal/09 split vaccine with or without AddaVax i.m. (A) Serum harvested at 30 dpv was assessed for anti-Cal/09 vaccine antibodies. (B) 30 dpv mice were challenged with 30,000 PFU Cal/09 and weight loss was monitored. (C) Pulmonary virus titer at 3 dpc. (D) Microneutralization. (E to G) SPF and dirty mice were untreated or vaccinated with 2019-2020 QIV with or without AddaVax i.m. (E) Serum harvested at 30 dpv was assessed for anti-QIV antibodies (F) Antibody avidity from (E) measured after exposure to chaotropic NaSCN. (G) 30 days after vaccination mice were challenged with 75,000 PFU Cal/09. Pulmonary virus titer at 3 dpc. Dotted line (C, and G), LOD 37.5. The data (A) are representative of 2 independent experiments with at least 6 mice per group. The data (B-G) are a combination of 2 independent experiments with at least 6 mice per group. Significance (A and E) was determined using AUC and one-way ANOVA. Significance (C-D and F-G) was determined using one-way ANOVA. Error bars indicate mean ± SEM. *p < 0.05, ** p <0.01, *** p < 0.001, **** p < 0.0001.
Figure 5:
Figure 5:. Memory CD8+ T cells fail to protect dirty mice upon influenza virus challenge.
SPF and dirty mice were untreated or vaccinated with 1000 PFU X31 and were challenged after 30 days with 1000 PFU PR8. Animals were evaluated for weight loss (A) and pulmonary virus titers on 3 dpc (B). Dotted line, LOD 37.5. (C) Number of H-2Db-NP366+ CD8+ T cells in the lung at 30 dpv (left) or 3 dpc (right) (D) On 3 dpc, the percentage of H-2Db-NP366+ CD8+ T cells that are Ki67+ from the lung, mediastinal lymph node (mLN) and spleen. (E to F) IFN-γ expression H-2Db-NP366+ CD8+ T cells was determined 31 dpv ex vivo (E), or 3 dpc in vivo (F). (G to I) Whole lungs were harvested and RNA was extracted for RNA-seq from untreated, 31 dpv and 2 dpc SPF and dirty mice. Multidimensional scaling plot demonstrating transcript alterations between groups (G). Heatmap of differentially expressed genes (H). (I) Gene ontology analysis was performed using Panther on genes in each cluster with an adjusted p value <0.01 and LogFC >0.5, FDR <0.01, and FE >20. The data (A-E) are combined from 2-3 independent experiments with at least 6 animals per group. The data (F) are from 1 of 2 representative experiments. Significance (B) was determined using one-way ANOVA. Significance (C to F) was determined using student unpaired two-tailed t-test. Error bars indicate mean ± SEM. *p < 0.05, ** p < 0.01, *** p < 0.001, **** p <0.0001.

Comment in

References

    1. Anderson KG, Mayer-Barber K, Sung H, Beura L, James BR, Taylor JJ, Qunaj L, Griffith TS, Vezys V, Barber DL, and Masopust D (2014). Intravascular staining for discrimination of vascular and tissue leukocytes. Nat Protoc 9, 209–222. 10.1038/nprot.2014.005. - DOI - PMC - PubMed
    1. Beura LK, Hamilton SE, Bi K, Schenkel JM, Odumade OA, Casey KA, Thompson EA, Fraser KA, Rosato PC, Filali-Mouhim A, et al. (2016). Normalizing the environment recapitulates adult human immune traits in laboratory mice. Nature 532, 512–516. 10.1038/nature17655. - DOI - PMC - PubMed
    1. Bouvier NM (2018). The Future of Influenza Vaccines: A Historical and Clinical Perspective. Vaccines (Basel) 6. 10.3390/vaccines6030058. - DOI - PMC - PubMed
    1. Bracci L, Canini I, Venditti M, Spada M, Puzelli S, Donatelli I, Belardelli F, and Proietti E (2006). Type I IFN as a vaccine adjuvant for both systemic and mucosal vaccination against influenza virus. Vaccine 24 Suppl 2, S2–56–57. 10.1016/j.vaccine.2005.01.121. - DOI - PubMed
    1. Bucasas KL, Franco LM, Shaw CA, Bray MS, Wells JM, Nino D, Arden N, Quarles JM, Couch RB, and Belmont JW (2011). Early patterns of gene expression correlate with the humoral immune response to influenza vaccination in humans. J Infect Dis 203, 921–929. 10.1093/infdis/jiq156. - DOI - PMC - PubMed

Substances

LinkOut - more resources