. 2021 Nov 9;37(6):109920.
doi: 10.1016/j.celrep.2021.109920. Epub 2021 Oct 15.

An airway organoid-based screen identifies a role for the HIF1α-glycolysis axis in SARS-CoV-2 infection

Affiliations

An airway organoid-based screen identifies a role for the HIF1α-glycolysis axis in SARS-CoV-2 infection

Xiaohua Duan et al. Cell Rep. .

Abstract

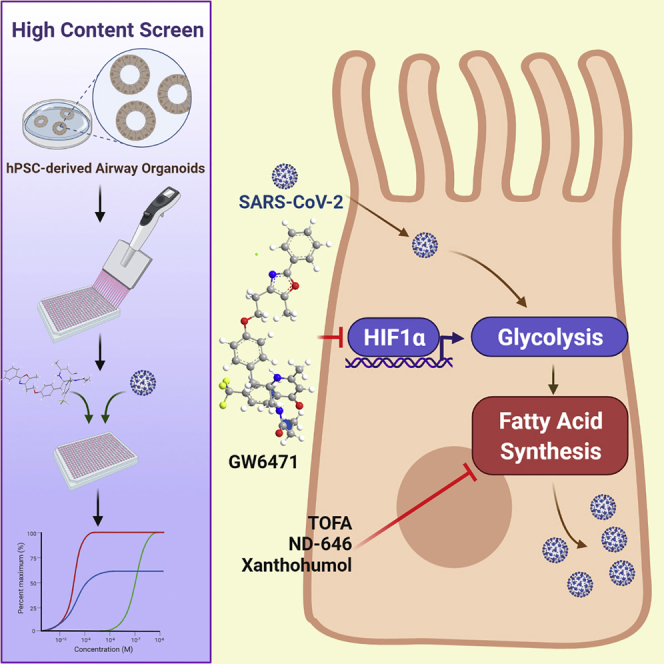
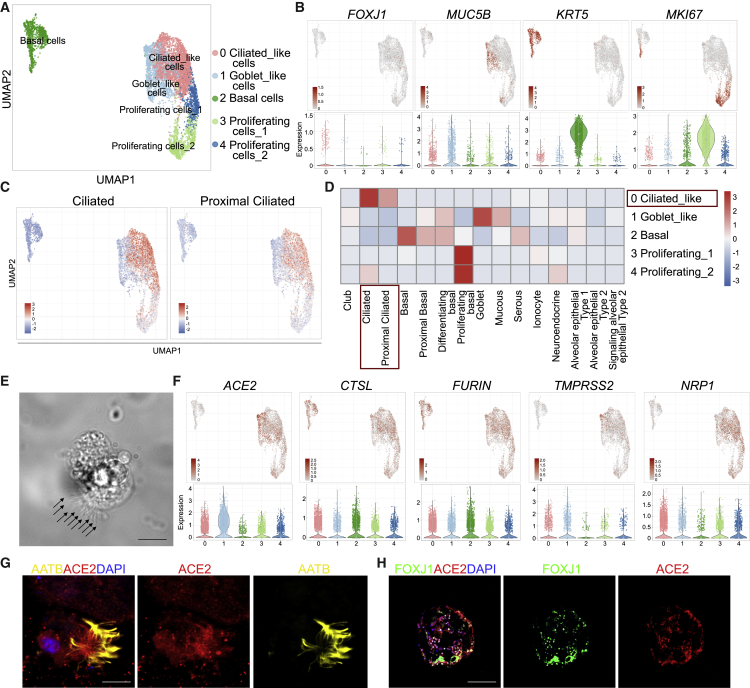
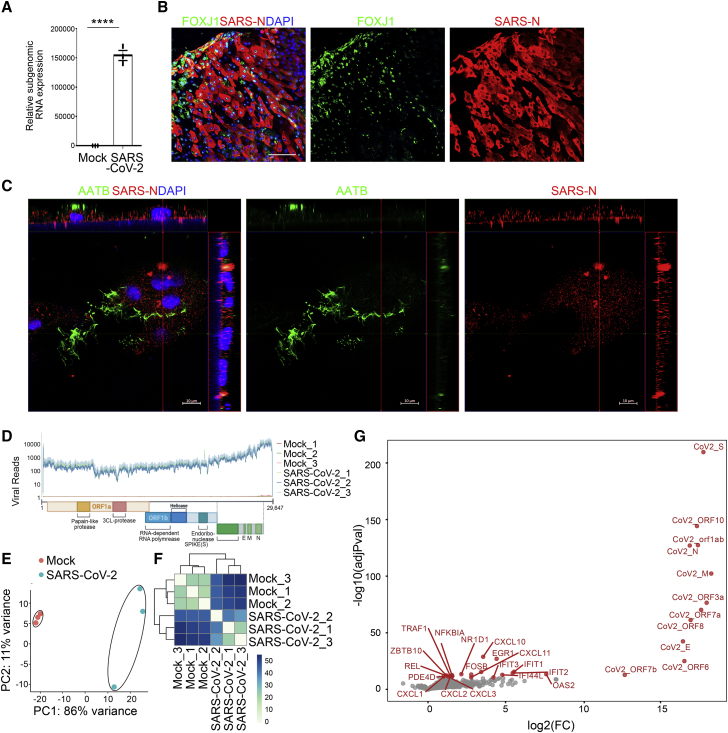
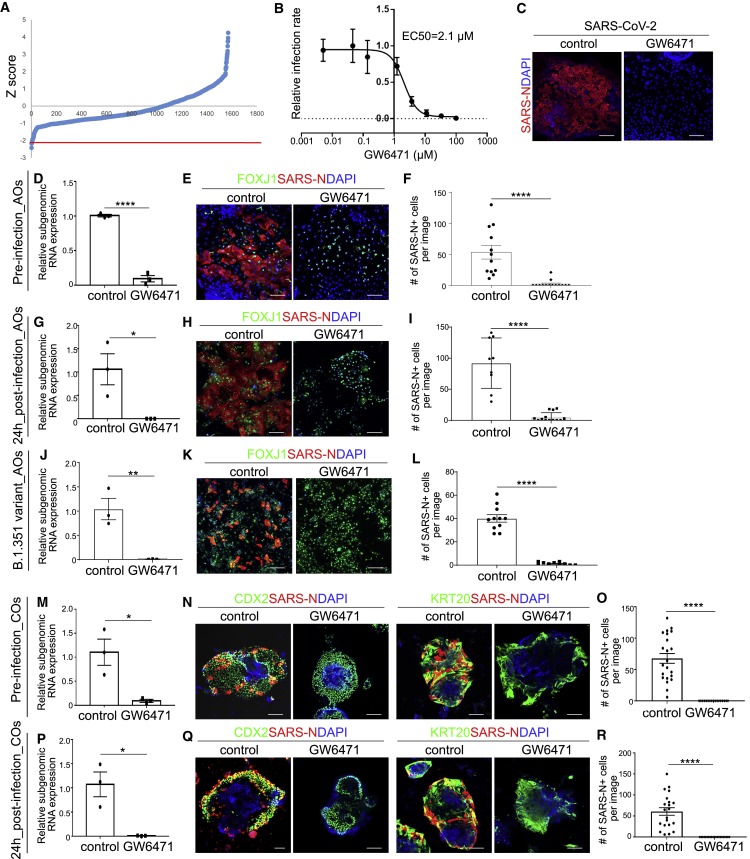
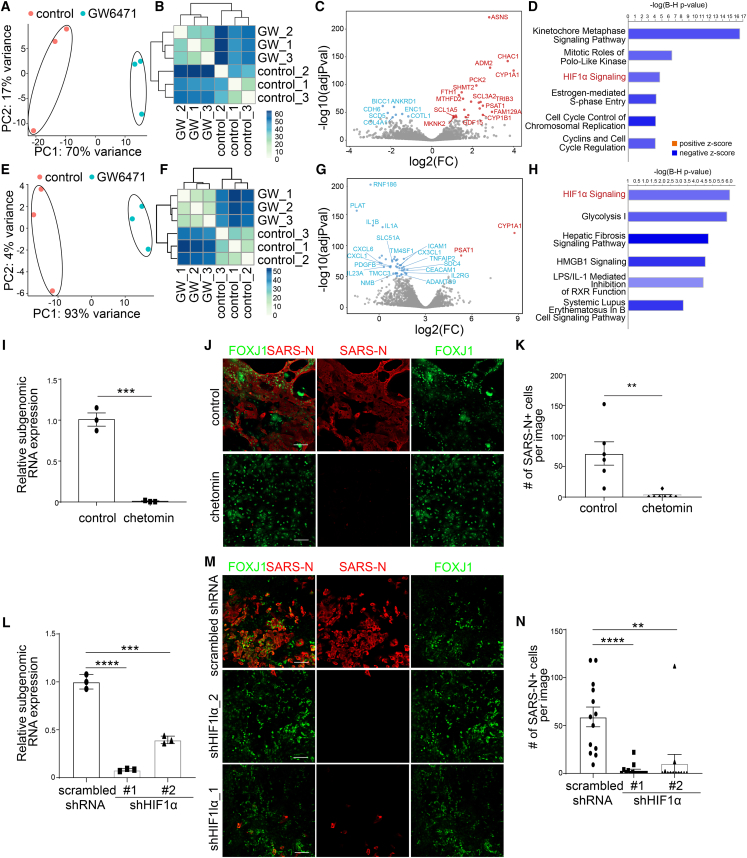
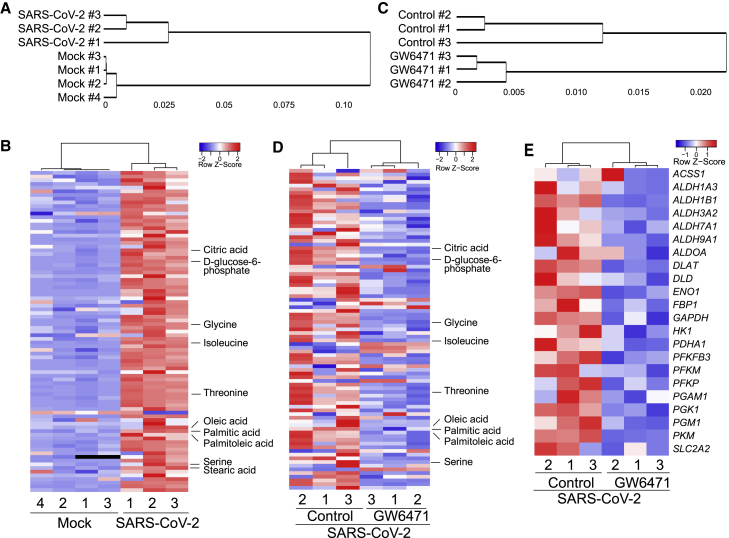
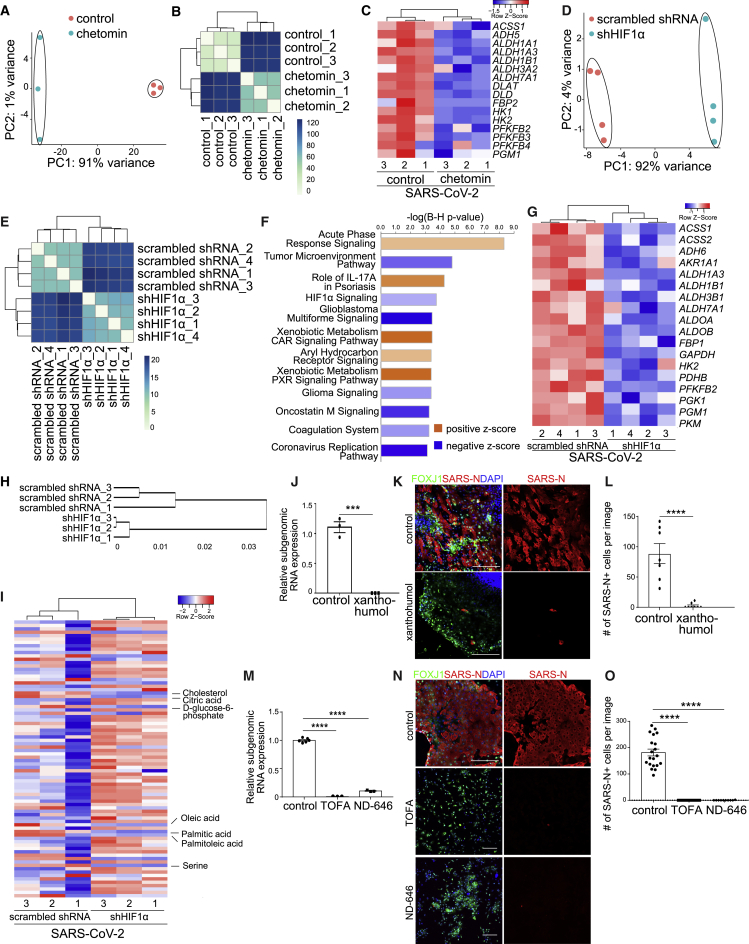
It is urgent to develop disease models to dissect mechanisms regulating severe acute respiratory syndrome coronavirus 2 (SARS-CoV-2) infection. Here, we derive airway organoids from human pluripotent stem cells (hPSC-AOs). The hPSC-AOs, particularly ciliated-like cells, are permissive to SARS-CoV-2 infection. Using this platform, we perform a high content screen and identify GW6471, which blocks SARS-CoV-2 infection. GW6471 can also block infection of the B.1.351 SARS-CoV-2 variant. RNA sequencing (RNA-seq) analysis suggests that GW6471 blocks SARS-CoV-2 infection at least in part by inhibiting hypoxia inducible factor 1 subunit alpha (HIF1α), which is further validated by chemical inhibitor and genetic perturbation targeting HIF1α. Metabolic profiling identifies decreased rates of glycolysis upon GW6471 treatment, consistent with transcriptome profiling. Finally, xanthohumol, 5-(tetradecyloxy)-2-furoic acid, and ND-646, three compounds that suppress fatty acid biosynthesis, also block SARS-CoV-2 infection. Together, a high content screen coupled with transcriptome and metabolic profiling reveals a key role of the HIF1α-glycolysis axis in mediating SARS-CoV-2 infection of human airway epithelium.

Keywords: GW4671; SARS-CoV-2; airway organoid; fatty acid synthesis; high content drug screen; hypoxia-inducible factor 1-alpha.


Conflict of interest statement

Declaration of interests R.E.S. is on the scientific advisory board of Miromatrix. T.R.E. and S.C. are the co-founders of OncoBeat.

Figures

None
Graphical abstract
Figure 1
Figure 1
Single-cell RNA-seq analysis of hPSC-AOs (A) Uniform manifold approximation and projection (UMAP) plot illustrating five cell clusters in the hPSC-AOs. n = 1 biological replicate. (B) UMAP and violin plots showing the expression of genes FOXJ1, MUC5B, KRT5, and MKI67. (C) Enrichment analysis of hPSC-AOs using genes highly expressed in adult human ciliated or proximal ciliated cells. (D) Correlation analysis of genes with cell fates in hPSC-AOs and adult human lung cells. (E) Phase contrast image of a representative ciliated-like cell. Scale bar, 30 μm. (F) UMAP and violin plots showing the expression of SARS-CoV-2 entry factors, including ACE2, CTSL, FURIN, TMPRSS2, and NRP1. (G) Representative confocal images of hPSC-AOs co-stained with antibodies recognizing ACE2 and cilia marker acetyl-α-tubulin (AATB). 4′,6-diamidino-2-phenylindole (DAPI) stains nuclei. Scale bar, 20 μm. (H) Representative confocal images of hPSC-AOs co-stained with antibodies recognizing ACE2 and ciliated cell marker FOXJ1. DAPI stains nuclei. Scale bar, 100 μm. See also Figure S1 and Video S1.
Figure 2
Figure 2
hPSC-AOs are permissive to SARS-CoV-2 infection (A) Relative SARS-CoV-2 RNA expression levels in hPSC-AOs at 48 hpi (MOI = 0.2). Total viral RNA from infected hPSC-AOs was analyzed by qRT-PCR for the presence of N transcripts relative to ACTB. (B) Representative confocal images of hPSC-AOs at 48 hpi (MOI = 0.2) co-stained with antibodies recognizing SARS-CoV-2 nucleocapsid (SARS-N) protein and ciliated cell marker FOXJ1. Scale bar, 100 μm. (C) Representative 3D confocal images of hPSC-AOs at 48 hpi (MOI = 0.2) co-stained with antibodies recognizing SARS-N and AATB. Scale bar, 10 μm. (D) Read coverage on viral transcriptome in the mock- and SARS-CoV-2-infected hPSC-AOs (MOI = 0.2). Schematic shows the SARS-CoV-2 genome. Coverage is normalized per million reads. (E and F) PCA (E) and sample clustering (F) on the mock- and SARS-CoV-2-infected hPSC-AOs. (G) Volcano plot showing the gene expression changes between mock- and SARS-CoV-2-infected hPSC-AOs. Data in (A) are presented as mean ± SEM (n = 3 biological replicates). The p values were calculated by unpaired two-tailed Student’s t test. ∗∗∗∗p < 0.0001. See also Video S2.
Figure 3
Figure 3
An hPSC-AO-based high-throughput chemical screen identifies GW6471 that blocks SARS-CoV-2 infection (A) Primary screening results. The x axis is the compound number. The y axis is the Z score. Red line indicates Z score = −2. (B) Efficacy curve of GW6471. Data are presented as mean ± SD. n = 3 biological replicates. (C) Representative confocal images of control or GW6471-treated hPSC-AOs at 48 hpi (MOI = 0.2). Scale bar, 100 μm. (D) qRT-PCR analysis for viral N subgenomic RNA in hPSC-AOs, which were pretreated with control or 10 μM GW6471 at 48 hpi (MOI = 0.2). Data are presented as mean ± SEM. n = 3 biological replicates. (E and F) Representative confocal images (E) and quantification (F) of SARS-N in hPSC-AOs, which were pretreated with control or 10 μM GW6471 at 48 hpi (MOI = 0.2). Scale bar, 100 μm. Data are presented as mean ± SEM. n = 6 biological replicates. (G) Relative SARS-CoV-2 viral RNA expression levels at 48 hpi in hPSC-AOs infected with SARS-CoV-2 virus (MOI = 0.2) and 24 h later exposed to control or 10 μM GW6471 treatment. Data are presented as mean ± SEM. n = 3 biological replicates. (H and I) Representative confocal images (H) and quantification (I) of SARS-N at 48 hpi of hPSC-AOs infected with SARS-CoV-2 virus (MOI = 0.2) and 24 h later exposed to control or 10 μM GW6471 treatment. Scale bar, 100 μm. Data are presented as mean ± SEM. n = 6 biological replicates. (J) qRT-PCR analysis for viral N single-guide RNA (sgRNA) at 48 hpi of hPSC-AOs, which were pretreated with control or 10 μM GW6471 (variant B.1.351, MOI = 0.2). Data are presented as mean ± SEM. n = 3 biological replicates. (K and L) Representative confocal images (K) and quantification (L) of SARS-N at 48 hpi of hPSC-AOs, which were pretreated with control or 10 μM GW6471 (variant B.1.351, MOI = 0.2). Scale bar, 100 μm. Data are presented as mean ± SEM. n = 6 biological replicates. (M) qRT-PCR analysis for viral N sgRNA at 48 hpi of hPSC-COs, which were pretreated with control or 10 μM GW6471 (MOI = 3). Data are presented as mean ± SEM. n = 3 biological replicates. (N and O) Representative confocal images (N) and quantification (O) at 48 hpi of SARS-N of hPSC-COs, which were pretreated with control or 10 μM GW6471 (MOI = 3). Scale bar, 100 μm. Data are presented as mean ± SEM. n = 6 biological replicates. (P) Relative SARS-CoV-2 viral RNA expression levels at 48 hpi of hPSC-AOs infected with SARS-CoV-2 virus (MOI = 3) and 24 h later followed by control or 10 μM GW6471 treatment. Data are presented as mean ± SEM. n = 3 biological replicates. (Q and R) Representative confocal images (Q) and quantification (R) of SARS-N at 48 hpi of hPSC-AOs infected with SARS-CoV-2 virus (MOI = 3) and 24 h later followed by control or 10 μM GW6471 treatment. Scale bar, 100 μm. Data are presented as mean ± SEM. n = 6 biological replicates. The p values were calculated by unpaired two-tailed Student’s t test. p < 0.05 and ∗∗∗p < 0.0001. See also Figures S2 and S3 and Table S1.
Figure 4
Figure 4
GW6471 blocks SARS-CoV-2 infection by inhibiting the HIF1α pathway (A and B) PCA (A) and sample clustering (B) on the control- and 10 μM GW6471-treated hPSC-AOs at 48 hpi (MOI = 0.2). (C) Volcano plot showing the expression changes between control- and 10 μM GW6471-treated hPSC-AOs at 48 hpi (MOI = 0.2). (D) Enriched pathways in GW6471- versus control-treated hPSC-AOs at 48 hpi. (E and F) PCA (E) and sample clustering (F) on the control- and 10 μM GW6471-treated hPSC-COs at 48 hpi (MOI = 1). (G) Volcano plot showing the expression changes between control- and 10 μM GW6471-treated hPSC-COs at 48 hpi (MOI = 1). (H) Enriched pathways in GW6471- versus control-treated hPSC-COs at 48 hpi. (I) qRT-PCR analysis for viral N sgRNA of hPSC-AOs treated with control or 1 μM chetomin at 48 hpi (MOI = 0.2). Data are presented as mean ± SEM. n = 3 biological replicates. (J and K) Representative confocal images (J) and quantification (K) of SARS-N+ cells of hPSC-AOs, which were treated with control or 1 μM chetomin at 48 hpi (MOI = 0.2). Scale bar, 100 μm. Data are presented as mean ± SEM. n = 6 biological replicates. (L) qRT-PCR analysis for viral N sgRNA of hPSC-AOs expressing shHIF1α or scrambled shRNA at 48 hpi (MOI = 0.2). Data was presented as mean ± SEM. n = 3 biological replicates. (M and N) Representative confocal images (M) and quantification (N) of SARS-N+ cells of hPSC-AOs expressing shHIF1α or scrambled shRNA at 48 hpi (MOI = 0.2). Scale bar, 100 μm. Data are presented as mean ± SEM. n = 6 biological replicates. The p values were calculated by unpaired two-tailed Student’s t test. ∗∗∗p < 0.001 and ∗∗∗∗p < 0.001. See also Figures S3 and S4 and Tables S2 and S3.
Figure 5
Figure 5
Metabolic profiling identifies a key role for glycolysis in SARS-CoV-2 infection (A and B) Hierarchical clustering analysis (A) and heatmap (B) of metabolic profiles for mock- or SARS-CoV-2 (MOI = 0.2)-infected hPSC-AOs at 48 hpi. n = 4 biological replicates for mock and N = 3 biological replicates for SARS-CoV-2. (C and D) Hierarchical clustering analysis (C) and heatmap (D) of metabolic profiles for control- or 10 μM GW6471-treated hPSC-AOs at 48 hpi (MOI = 0.2). n = 3 biological replicates. (E) Heatmap of genes encoding enzymes involved in the glycolytic pathway of control- or 10 μM GW6471-treated hPSC-AOs at 48 hpi (MOI = 0.2). n = 3 biological replicates.
Figure 6
Figure 6
HIF1α regulates glycolysis in SARS-CoV-2-infected hPSC-AOs (A and B) PCA (A) and sample clustering (B) analysis of control- and 1 μM chetomin-treated hPSC-AOs at 48 hpi (MOI = 0.2). n = 3 biological replicates. (C) Heatmap of genes encoding enzymes involved in the glycolytic pathway of control- or 1 μM chetomin-treated hPSC-AOs at 48 hpi (MOI = 0.2). (D–F) PCA (D), sample clustering (E), and IPA (F) analysis of the hPSC-AOs expressing shHIF1α or scrambled shRNA at 48 hpi (MOI = 0.2). n = 3 biological replicates. (G) Heatmap of genes encoding enzymes involved in the glycolytic pathway in the hPSC-AOs expressing shHIF1α or scrambled shRNA at 48 hpi (MOI = 0.2). (H and I) Hierarchical clustering analysis (H) and heatmap (I) of metabolic profiles of the hPSC-AOs expressing shHIF1α or scrambled shRNA at 48 hpi (MOI = 0.2). n = 3 biological replicates. (J) qRT-PCR analysis for viral N sgRNA at 48 hpi of hPSC-AOs treated with control or 10 μM xanthohumol (MOI = 0.2). Data are presented as mean ± SEM. n = 3 biological replicates. (K and L) Representative confocal images (K) and quantification (L) of SARS-N+ cells at 48 hpi of hPSC-AOs, which were treated with control or 10 μM xanthohumol (MOI = 0.2). Scale bar, 100 μm. Data are presented as mean ± SEM. n = 6 biological replicates. (M) qRT-PCR analysis for viral N sgRNA at 48 hpi of hPSC-AOs treated with control or 3 μM TOFA or 3 μM ND-646 (MOI = 0.2). Data are presented as mean ± SEM. n = 3 biological replicates. (N and O) Representative confocal images (N) and quantification (O) of SARS-N+ cells at 48 hpi of hPSC-AOs, which were treated with control or 3 μM TOFA or 3 μM ND-646 (MOI = 0.2). Scale bar, 100 μm. Data are presented as mean ± SEM. n = 6 biological replicates. Data are presented as mean ± SEM. The p values were calculated by unpaired two-tailed Student’s t test. p < 0.05 and ∗∗∗p < 0.001. See also Figure S4 and Table S4.

Comment in

References

    1. Anders S., Pyl P.T., Huber W. HTSeq--a Python framework to work with high-throughput sequencing data. Bioinformatics. 2015;31:166–169. - PMC - PubMed
    1. Appelberg S., Gupta S., Svensson Akusjärvi S., Ambikan A.T., Mikaeloff F., Saccon E., Végvári Á., Benfeitas R., Sperk M., Ståhlberg M., et al. Dysregulation in Akt/mTOR/HIF-1 signaling identified by proteo-transcriptomics of SARS-CoV-2 infected cells. Emerg. Microbes Infect. 2020;9:1748–1760. - PMC - PubMed
    1. Bakhache W., Neyret A., McKellar J., Clop C., Bernard E., Weger-Lucarelli J., Briant L. Fatty acid synthase and stearoyl-CoA desaturase-1 are conserved druggable cofactors of Old World Alphavirus genome replication. Antiviral Res. 2019;172:104642. - PubMed
    1. Berenguer J., Ryan P., Rodríguez-Baño J., Jarrín I., Carratalà J., Pachón J., Yllescas M., Arriba J.R., Muñoz E.A., Divasson P.G., et al. Characteristics and predictors of death among 4035 consecutively hospitalized patients with COVID-19 in Spain. Clin. Microbiol. Infect. 2020;26:1525–1536. - PMC - PubMed
    1. Blanco-Melo D., Nilsson-Payant B.E., Liu W.C., Uhl S., Hoagland D., Møller R., Jordan T.X., Oishi K., Panis M., Sachs D., et al. Imbalanced Host Response to SARS-CoV-2 Drives Development of COVID-19. Cell. 2020;181:1036–1045.e9. - PMC - PubMed

Publication types

Substances

Supplementary concepts