

Effects of covid-19 pandemic on life expectancy and premature mortality in 2020: time series analysis in 37 countries
- PMID: 34732390
- PMCID: PMC8564739
- DOI: 10.1136/bmj-2021-066768
Effects of covid-19 pandemic on life expectancy and premature mortality in 2020: time series analysis in 37 countries
Abstract
Objective: To estimate the changes in life expectancy and years of life lost in 2020 associated with the covid-19 pandemic.
Design: Time series analysis.
Setting: 37 upper-middle and high income countries or regions with reliable and complete mortality data.
Participants: Annual all cause mortality data from the Human Mortality Database for 2005-20, harmonised and disaggregated by age and sex.
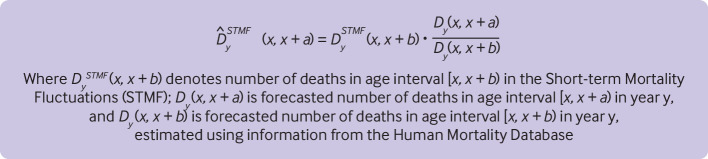
Main outcome measures: Reduction in life expectancy was estimated as the difference between observed and expected life expectancy in 2020 using the Lee-Carter model. Excess years of life lost were estimated as the difference between the observed and expected years of life lost in 2020 using the World Health Organization standard life table.
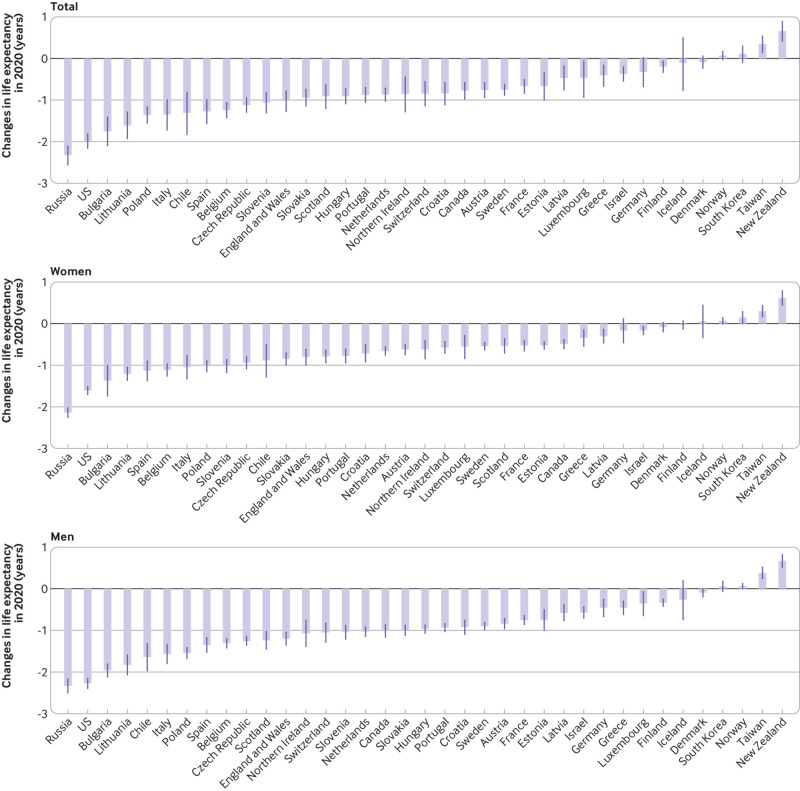
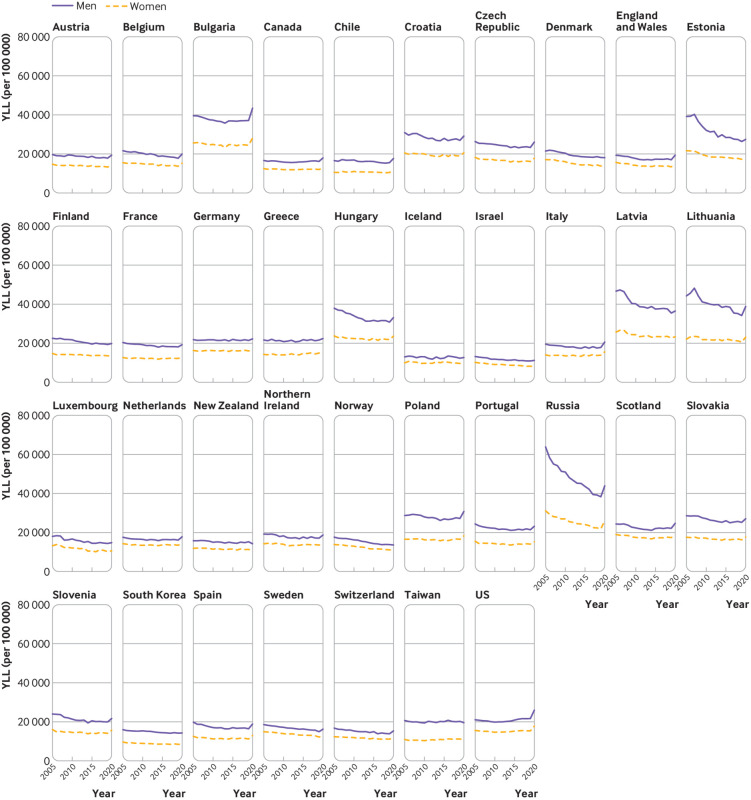
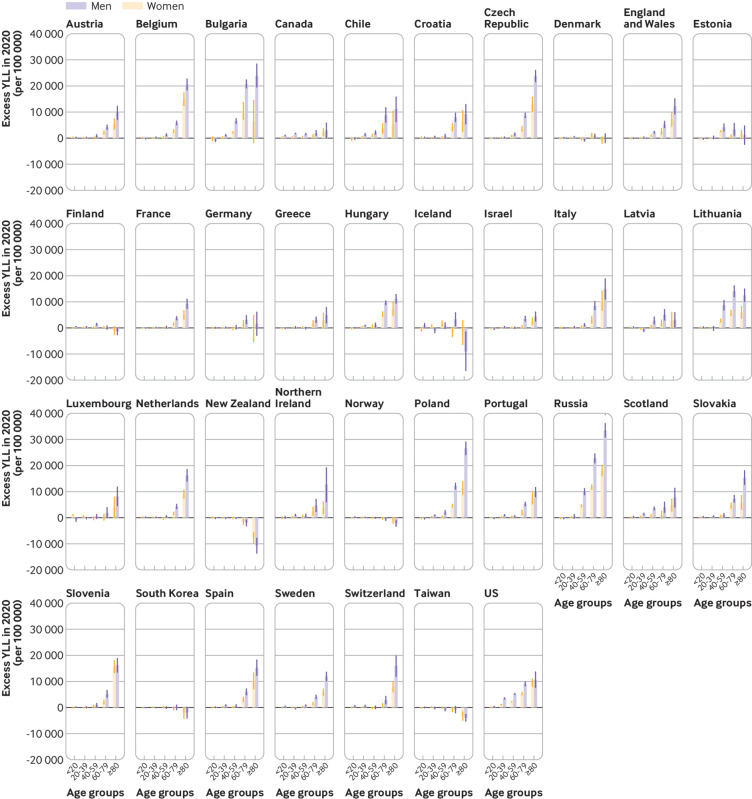
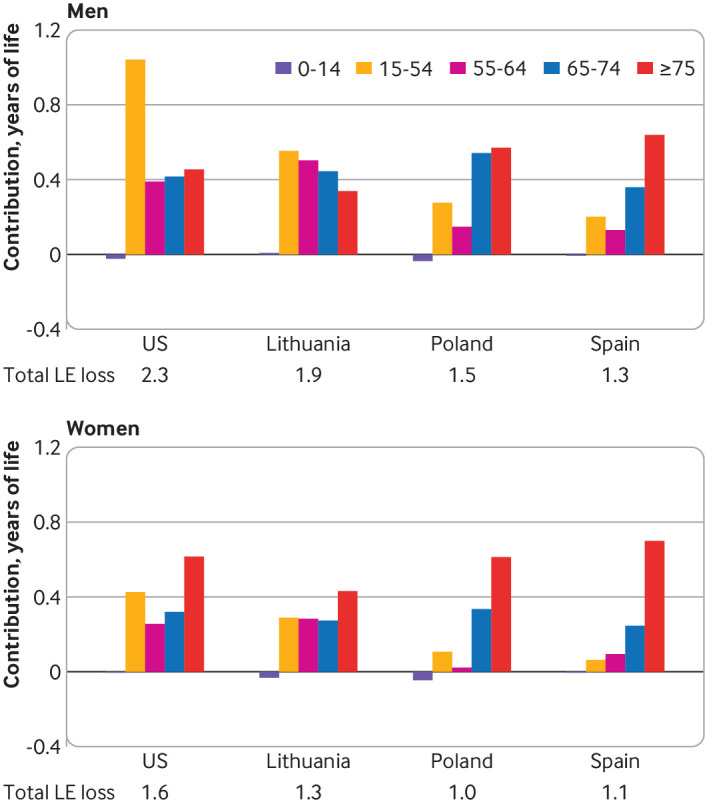
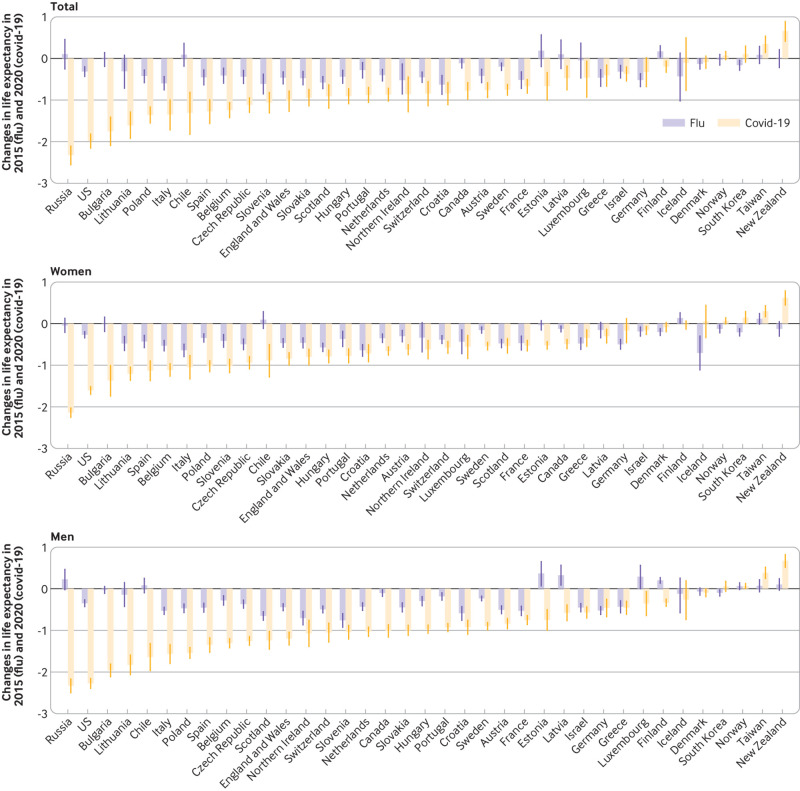
Results: Reduction in life expectancy in men and women was observed in all the countries studied except New Zealand, Taiwan, and Norway, where there was a gain in life expectancy in 2020. No evidence was found of a change in life expectancy in Denmark, Iceland, and South Korea. The highest reduction in life expectancy was observed in Russia (men: -2.33, 95% confidence interval -2.50 to -2.17; women: -2.14, -2.25 to -2.03), the United States (men: -2.27, -2.39 to -2.15; women: -1.61, -1.70 to -1.51), Bulgaria (men: -1.96, -2.11 to -1.81; women: -1.37, -1.74 to -1.01), Lithuania (men: -1.83, -2.07 to -1.59; women: -1.21, -1.36 to -1.05), Chile (men: -1.64, -1.97 to -1.32; women: -0.88, -1.28 to -0.50), and Spain (men: -1.35, -1.53 to -1.18; women: -1.13, -1.37 to -0.90). Years of life lost in 2020 were higher than expected in all countries except Taiwan, New Zealand, Norway, Iceland, Denmark, and South Korea. In the remaining 31 countries, more than 222 million years of life were lost in 2020, which is 28.1 million (95% confidence interval 26.8m to 29.5m) years of life lost more than expected (17.3 million (16.8m to 17.8m) in men and 10.8 million (10.4m to 11.3m) in women). The highest excess years of life lost per 100 000 population were observed in Bulgaria (men: 7260, 95% confidence interval 6820 to 7710; women: 3730, 2740 to 4730), Russia (men: 7020, 6550 to 7480; women: 4760, 4530 to 4990), Lithuania (men: 5430, 4750 to 6070; women: 2640, 2310 to 2980), the US (men: 4350, 4170 to 4530; women: 2430, 2320 to 2550), Poland (men: 3830, 3540 to 4120; women: 1830, 1630 to 2040), and Hungary (men: 2770, 2490 to 3040; women: 1920, 1590 to 2240). The excess years of life lost were relatively low in people younger than 65 years, except in Russia, Bulgaria, Lithuania, and the US where the excess years of life lost was >2000 per 100 000.
Conclusion: More than 28 million excess years of life were lost in 2020 in 31 countries, with a higher rate in men than women. Excess years of life lost associated with the covid-19 pandemic in 2020 were more than five times higher than those associated with the seasonal influenza epidemic in 2015.
© Author(s) (or their employer(s)) 2019. Re-use permitted under CC BY. No commercial re-use. See rights and permissions. Published by BMJ.
Conflict of interest statement
Competing interests: All authors have completed the ICMJE uniform disclosure form at www.icmje.org/coi_disclosure.pdf and declare: NI, SL, and VMS are the members of the WHO-UN DESA Technical Advisory Group on Covid-19 mortality assessment. NI, SL, and BL are employed by the Clinical Trial Service Unit and Epidemiological Studies Unit, which receives research grants from industry that are governed by University of Oxford contracts that protect its independence and has a staff policy of not taking personal payments from industry; further details can be found at www.ndph.ox.ac.uk/files/about/ndph-independence-of-research-policy-jun-20.pdf. SL reports grants from the Medical Research Council (MRC), and research funding from the US Centers for Disease Control and Prevention Foundation (with support from Amgen) unrelated to this study. MW reports research funding from the British Heart Foundation, Cancer Research UK, Economic and Social Research Council, Medical Research Council, National Institute for Health Research, and Wellcome Trust unrelated to this study. KK is a member of the UK Scientific Advisory Group for Emergency (SAGE), and Independent SAGE; no support from any organisation for the submitted work.
Figures


References
Publication types
MeSH terms
Grants and funding
LinkOut - more resources
Full Text Sources
Medical