. 2022 Feb 1;71(2):184-205.
doi: 10.2337/db21-0490.

Metabolic and Metabo-Clinical Signatures of Type 2 Diabetes, Obesity, Retinopathy, and Dyslipidemia

Affiliations

Metabolic and Metabo-Clinical Signatures of Type 2 Diabetes, Obesity, Retinopathy, and Dyslipidemia

Noha A Yousri et al. Diabetes. .

Abstract

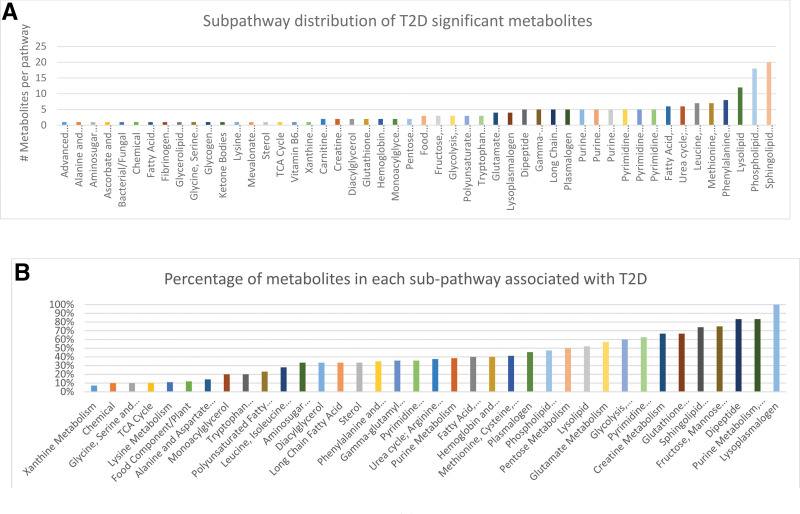
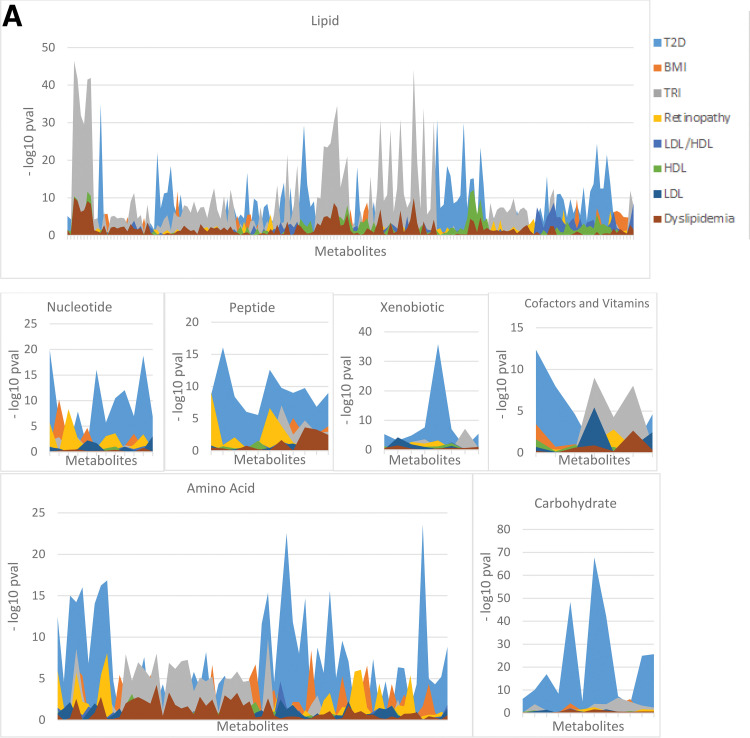
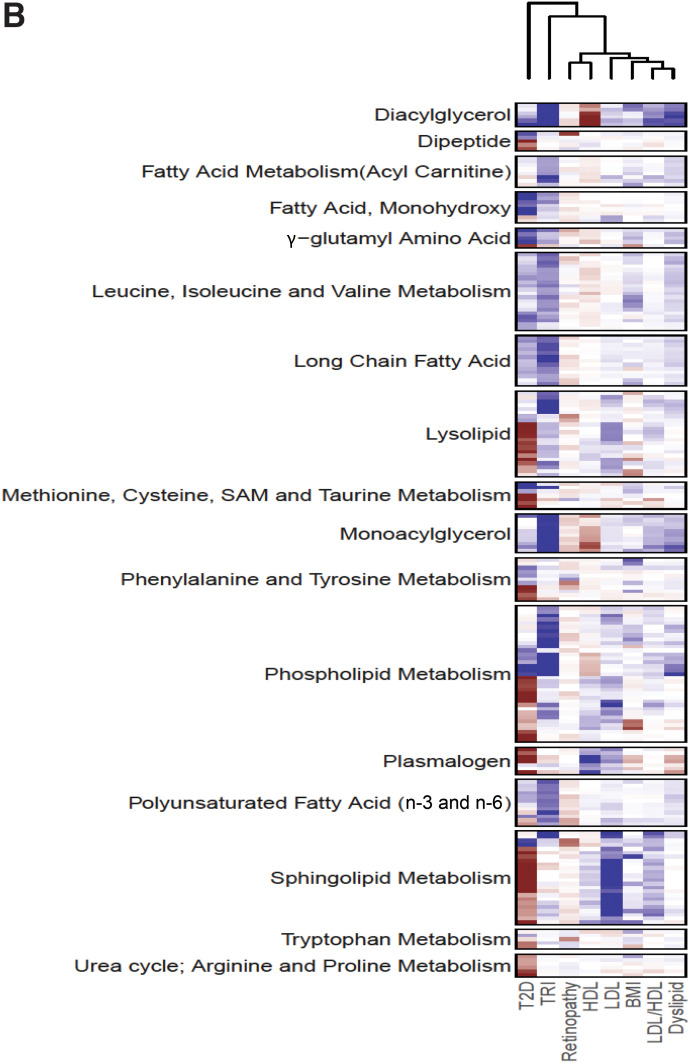
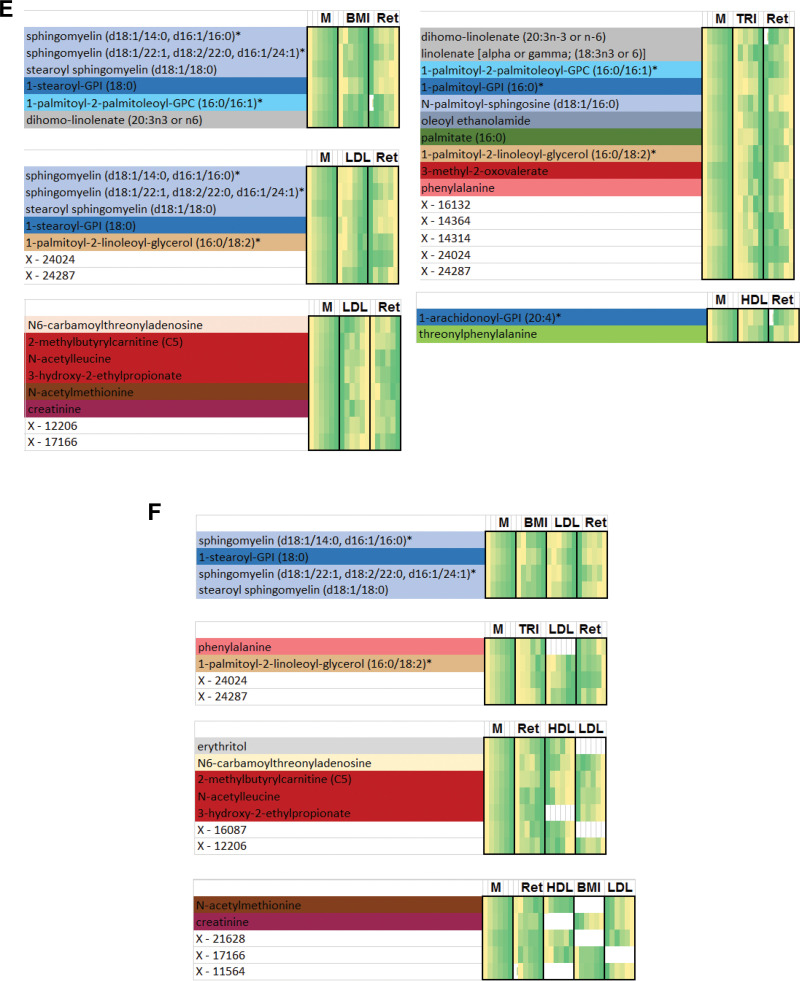
Macro- and microvascular complications of type 2 diabetes (T2D), obesity, and dyslipidemia share common metabolic pathways. In this study, using a total of 1,300 metabolites from 996 Qatari adults (57% with T2D) and 1,159 metabolites from an independent cohort of 2,618 individuals from the Qatar BioBank (11% with T2D), we identified 373 metabolites associated with T2D, obesity, retinopathy, dyslipidemia, and lipoprotein levels, 161 of which were novel. Novel metabolites included phospholipids, sphingolipids, lysolipids, fatty acids, dipeptides, and metabolites of the urea cycle and xanthine, steroid, and glutathione metabolism. The identified metabolites enrich pathways of oxidative stress, lipotoxicity, glucotoxicity, and proteolysis. Second, we identified 15 patterns we defined as "metabo-clinical signatures." These are clusters of patients with T2D who group together based on metabolite levels and reveal the same clustering in two or more clinical variables (obesity, LDL, HDL, triglycerides, and retinopathy). These signatures revealed metabolic pathways associated with different clinical patterns and identified patients with extreme (very high/low) clinical variables associated with extreme metabolite levels in specific pathways. Among our novel findings are the role of N-acetylmethionine in retinopathy in conjunction with dyslipidemia and the possible roles of N-acetylvaline and pyroglutamine in association with high cholesterol levels and kidney function.


Figures

Figure 1
Figure 1
Subpathway distribution of T2D significant metabolites. A: The number of T2D metabolites in each pathway. B: Percentage of T2D metabolites in each pathway compared with the total number of metabolites in the pathway.
Figure 2
Figure 2
A: Pathway associations with clinical variables. The y-axis shows the –log10 P value for all metabolites in each pathway, and the x-axis represents the metabolites in this pathway. The peaks present the −log10 P values, while the areas under the peaks are only used for a better visualization of the P values. B: Pathway associations with eight clinical variables. Clustered heat map of (Sign[β] ∗ −log10 [P value]) of metabolite associations with the clinical variables displaying 17 subpathways that have >5 metabolites from the 373 identified metabolites. Deep blue indicates the highest positive association, and deep red indicates the lowest negative association.
Figure 2
Figure 2
A: Pathway associations with clinical variables. The y-axis shows the –log10 P value for all metabolites in each pathway, and the x-axis represents the metabolites in this pathway. The peaks present the −log10 P values, while the areas under the peaks are only used for a better visualization of the P values. B: Pathway associations with eight clinical variables. Clustered heat map of (Sign[β] ∗ −log10 [P value]) of metabolite associations with the clinical variables displaying 17 subpathways that have >5 metabolites from the 373 identified metabolites. Deep blue indicates the highest positive association, and deep red indicates the lowest negative association.
Figure 3
Figure 3
A selected set of subnetworks from the largest 11 GGM subnetworks constructed from significant partial correlation of 373 metabolites associated with any of the 8 clinical variables. The larger the node, the more phenotypes are associated with the metabolite (up to six phenotypes can be associated with metabolites). If four or more metabolites are associated only with a single clinical variable, the border of the node is colored: a red border indicates association with TRI only, and a blue border indicates association with T2D only. Monoacylglycerol/phospholipid/PUFAs (17 metabolites) (A), monohydroxy fatty acids (B), carbohydrates/sugars (C), fungal/xenobiotic/unknowns (D), fatty acid subnetwork (LCFA/PUFAs) (13 metabolites) (E), and dipeptides and unknowns (F).
Figure 3
Figure 3
A selected set of subnetworks from the largest 11 GGM subnetworks constructed from significant partial correlation of 373 metabolites associated with any of the 8 clinical variables. The larger the node, the more phenotypes are associated with the metabolite (up to six phenotypes can be associated with metabolites). If four or more metabolites are associated only with a single clinical variable, the border of the node is colored: a red border indicates association with TRI only, and a blue border indicates association with T2D only. Monoacylglycerol/phospholipid/PUFAs (17 metabolites) (A), monohydroxy fatty acids (B), carbohydrates/sugars (C), fungal/xenobiotic/unknowns (D), fatty acid subnetwork (LCFA/PUFAs) (13 metabolites) (E), and dipeptides and unknowns (F).
Figure 4
Figure 4
Flow diagram illustrating the identification of metabo-clinical signatures is shown in A. A magnified example metabo-clinical signature shown in B. CF show all metabo-clinical signatures of patients with T2D for the clinical variables BMI, TRI, LDL, HDL, and retinopathy (see Supplementary Table 12B for magnified detailed views of all signatures). In each heat map, the metabolite block (M) shows the levels of each metabolite in six clusters (metabolites are color coded by their subpathway), followed by a block for each clinical variable to show the signature of that variable as per the clusters of each metabolite in the first block. In each heat map block, clusters are sorted on the means of the metabolite, and the deeper green indicates a higher value, while a lighter yellow is the opposite. Clinical variable names are displayed on the top side of the heat map, where M indicates the metabolites block and Ret indicates retinopathy. Signatures combining BMI, LDL, HDL, and TRI: four identified metabo-clinical signatures of two combined variables (C) and two identified metabo-clinical signatures of three combined clinical variables (D). Signatures combining retinopathy with BMI, LDL, HDL, and TRI: five identified metabo-clinical signatures combining two clinical variables (E) and four identified metabo-clinical signatures of three or more combined clinical variables (F). Rows with empty cells indicate that the correlation of the metabolite with the clinical variable is <80%.
Figure 4
Figure 4
Flow diagram illustrating the identification of metabo-clinical signatures is shown in A. A magnified example metabo-clinical signature shown in B. CF show all metabo-clinical signatures of patients with T2D for the clinical variables BMI, TRI, LDL, HDL, and retinopathy (see Supplementary Table 12B for magnified detailed views of all signatures). In each heat map, the metabolite block (M) shows the levels of each metabolite in six clusters (metabolites are color coded by their subpathway), followed by a block for each clinical variable to show the signature of that variable as per the clusters of each metabolite in the first block. In each heat map block, clusters are sorted on the means of the metabolite, and the deeper green indicates a higher value, while a lighter yellow is the opposite. Clinical variable names are displayed on the top side of the heat map, where M indicates the metabolites block and Ret indicates retinopathy. Signatures combining BMI, LDL, HDL, and TRI: four identified metabo-clinical signatures of two combined variables (C) and two identified metabo-clinical signatures of three combined clinical variables (D). Signatures combining retinopathy with BMI, LDL, HDL, and TRI: five identified metabo-clinical signatures combining two clinical variables (E) and four identified metabo-clinical signatures of three or more combined clinical variables (F). Rows with empty cells indicate that the correlation of the metabolite with the clinical variable is <80%.

References

    1. Yousri NA, Mook-Kanamori DO, Selim MM, et al. . A systems view of type 2 diabetes-associated metabolic perturbations in saliva, blood and urine at different timescales of glycaemic control. Diabetologia 2015;58:1855–1867 - PMC - PubMed
    1. Wilson PW, Meigs JB, Sullivan L, Fox CS, Nathan DM, D’Agostino RB Sr. Prediction of incident diabetes mellitus in middle-aged adults: the Framingham Offspring Study. Arch Intern Med 2007;167:1068–1074 - PubMed
    1. Krauss RM. Lipids and lipoproteins in patients with type 2 diabetes. Diabetes Care 2004;27:1496–1504 - PubMed
    1. Ng TW, Khan AA, Meikle PJ. Investigating the pathogenesis and risk of type 2 diabetes: clinical applications of metabolomics. Clin Lipidol 2012;7:641–659
    1. Tomkin GH, Owens D. Diabetes and dyslipidemia: characterizing lipoprotein metabolism. Diabetes Metab Syndr Obes 2017;10:333–343 - PMC - PubMed

Publication types

MeSH terms