. 2021 Nov 3;12(1):6355.
doi: 10.1038/s41467-021-26666-1.

Forest defoliator outbreaks alter nutrient cycling in northern waters

Affiliations

Forest defoliator outbreaks alter nutrient cycling in northern waters

Samuel G Woodman et al. Nat Commun. .

Abstract

Insect defoliators alter biogeochemical cycles from land into receiving waters by consuming terrestrial biomass and releasing biolabile frass. Here, we related insect outbreaks to water chemistry across 12 boreal lake catchments over 32-years. We report, on average, 27% lower dissolved organic carbon (DOC) and 112% higher dissolved inorganic nitrogen (DIN) concentrations in lake waters when defoliators covered entire catchments and reduced leaf area. DOC reductions reached 32% when deciduous stands dominated. Within-year changes in DOC from insect outbreaks exceeded 86% of between-year trends across a larger dataset of 266 boreal and north temperate lakes from 1990 to 2016. Similarly, within-year increases in DIN from insect outbreaks exceeded local, between-year changes in DIN by 12-times, on average. As insect defoliator outbreaks occur at least every 5 years across a wider 439,661 km2 boreal ecozone of Ontario, we suggest they are an underappreciated driver of biogeochemical cycles in forest catchments of this region.


Conflict of interest statement

The authors declare no competing interests.

Figures

Fig. 1
Fig. 1. Defoliator outbreaks reduce forest cover.
We calculated the monthly leaf area index (LAI) across 12 catchments in Ontario, Canada from 1985 to 2016. For visualization purposes, monthly catchment-level averages of LAI were grouped into three equal-width bins for the proportion of the catchment area defoliated and points show the corresponding mean ± SE. However, slopes were estimated to models fitted to non-binned data with N = 384 per month (Supplementary Table 2). The mean value of each bin is displayed with the corresponding range in parentheses. The shaded area is the typical senescence period for the southern boreal forest. Upper arrows illustrate general life stages of phytophagous insects while lower arrows show leaf phenology. Asterisks (*) denote a statistically significant effect of the percentage of catchment damaged on LAI within a given month calculated using estimated marginal means (see Supplementary Table 2). Conditional Rc2 = 0.81.
Fig. 2
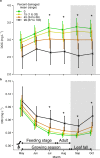
Fig. 2. Less dissolved organic carbon (DOC) and more dissolved organic nitrogen (DIN) in lake water during defoliator outbreaks.
Mean (±SE) (a) monthly DOC and (b) DIN concentration averaged across 12 lakes from 1985 to 2016. For visualization purposes, monthly catchment-level averages of DOC and DIN were grouped into three equal-width bins for the percent catchment area defoliated and points show the corresponding mean ± SE. However, slopes were estimated to models fitted to non-binned data with N = 289–340 and 270–320 per month for DOC and DIN, respectively (Supplementary Table 2). The mean value of each bin is displayed with the corresponding range in parentheses. Shaded area is the typical period of leaf senescence for the southern boreal forests. Upper arrows illustrate the general life stages of phytophagous insects while lower arrows show leaf senescence. Asterisks (*) denote a statistically significant effect of the percentage of catchment damaged on either DOC or DIN within a given month calculated using estimated marginal means (see Supplementary Table 2). Conditional Rc2 = 0.63 and 0.64 in a and b, respectively.
Fig. 3
Fig. 3. Dissolved organic carbon (DOC) declines more strongly with insect defoliation in catchments with a greater proportion of deciduous stands.
For visualization purposes, lines are mean DOC averaged across months at the 25th, 50th, and 75th percentiles for the proportion of pure deciduous forest stands in a catchment. Points (±SE) were extracted at zero and for the three equal-width bins describing the observed proportion of defoliated catchment area (0.15, 0.45, and 0.99; n = 48 to 1800) reported in Figs. 1 and 2. The dashed line denotes a non-statistically significant trend at low proportions of deciduous stands. Conditional Rc2 = 0.63.
Fig. 4
Fig. 4. Defoliator outbreaks offset increases in lake water dissolved organic carbon (DOC) concentrations observed across northern waters.
Bars represent the number of lakes that showed either an increase (black; n = 247) or decrease (open; n = 15) in DOC between 1990 and 2016. Four lakes showed no change in DOC and are omitted from the plot. The vertical dashed line is the mean decline in DOC averaged across ice-free months estimated during defoliator outbreaks over the same study period from 12 catchments in Ontario, Canada. The shaded area represents the 95% CI for the change in DOC calculated via the emmeans package.
Fig. 5
Fig. 5. Half of all surveyed lake catchments in Ontario, Canada experience defoliator outbreaks at least every 5 years.
a Bars are the number of catchments with lakes ≥5 ha where insect defoliator outbreaks occurred between 1 and ≥15 times from 1990 and 2016 (n = 48,286). The dashed line is the median number of outbreaks per catchment across the 22-year interval. b Cumulative proportion of catchments with at least one insect outbreak between 1990 and 2016 (n = 60,430). Outbreaks were defined where ≥50% of the catchment area was defoliated by aerial observation.

References

    1. Fowler D, et al. The global nitrogen cycle in the twenty-first century. Philos. Trans. R. Soc. B Biol. Sci. 2013;368:20130164. doi: 10.1098/rstb.2013.0164. - DOI - PMC - PubMed
    1. Drake TW, Raymond PA, Spencer RGM. Terrestrial carbon inputs to inland waters: a current synthesis of estimates and uncertainty. Limnol. Oceanogr. Lett. 2018;3:132–142. doi: 10.1002/lol2.10055. - DOI
    1. Tanentzap AJ, et al. Terrestrial support of lake food webs: synthesis reveals controls over cross-ecosystem resource use. Sci. Adv. 2017;3:e1601765. doi: 10.1126/sciadv.1601765. - DOI - PMC - PubMed
    1. Michalzik B, Kalbitz K, Park JH, Solinger S, Matzner E. Fluxes and concentrations of dissolved organic carbon and nitrogen – a synthesis for temperate forests. Biogeochemistry. 2001;52:173–205. doi: 10.1023/A:1006441620810. - DOI
    1. Williamson CE, Morris DP, Pace ML, Olson OG. Dissolved organic carbon and nutrients as regulators of lake ecosystems: Resurrection of a more integrated paradigm. Limnol. Oceanogr. 1999;44:795–803. doi: 10.4319/lo.1999.44.3_part_2.0795. - DOI

Publication types