. 2021 Nov 3;11(1):21565.
doi: 10.1038/s41598-021-99091-5.

Gene-level analysis of rare variants in 379,066 whole exome sequences identifies an association of GIGYF1 loss of function with type 2 diabetes

Collaborators, Affiliations

Gene-level analysis of rare variants in 379,066 whole exome sequences identifies an association of GIGYF1 loss of function with type 2 diabetes

Aimee M Deaton et al. Sci Rep. .

Abstract

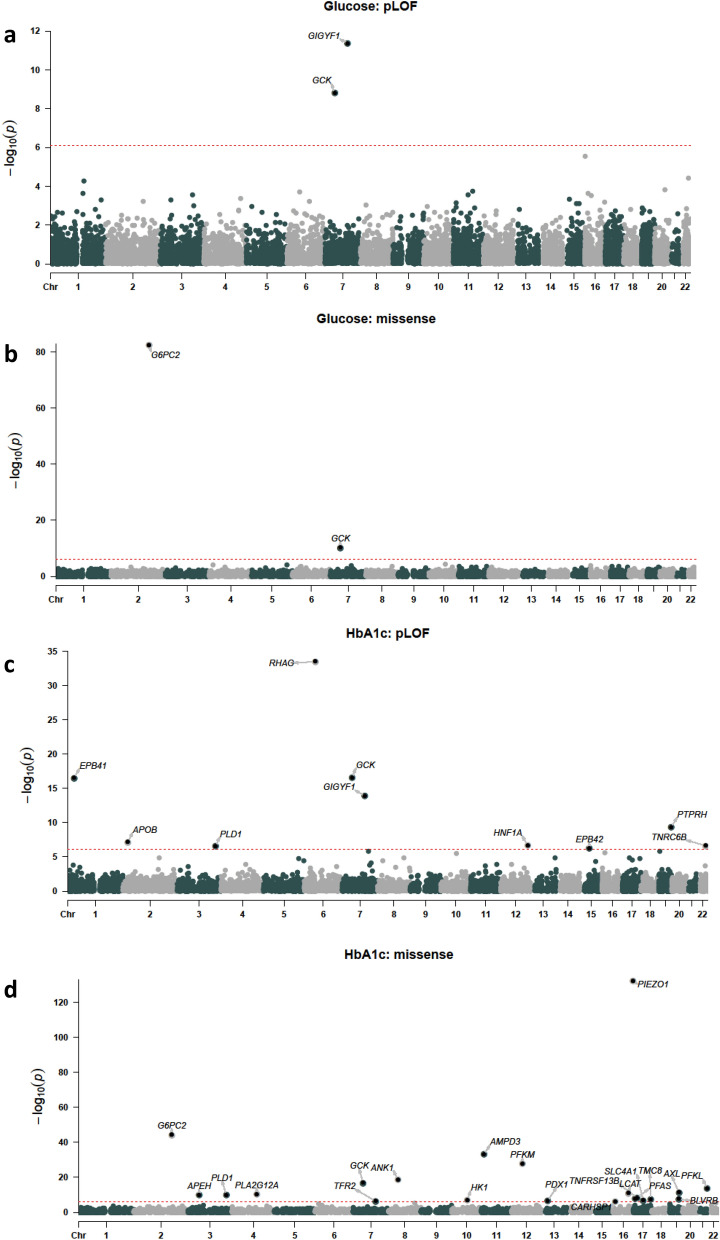
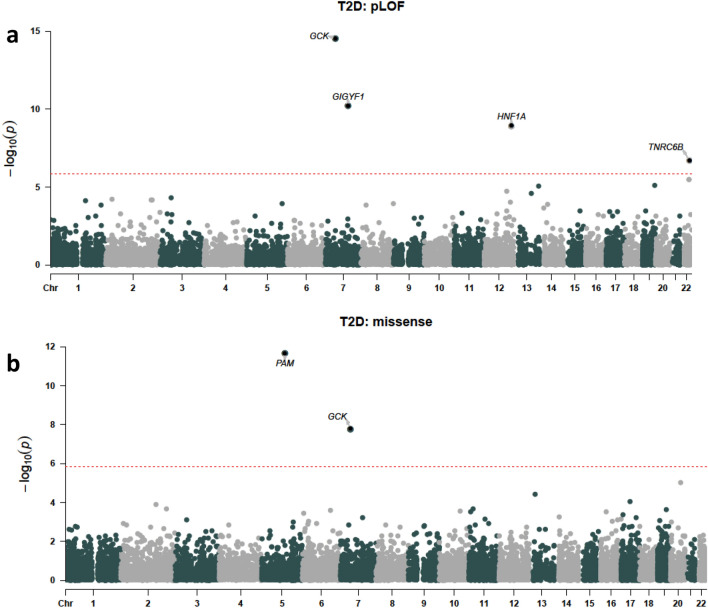
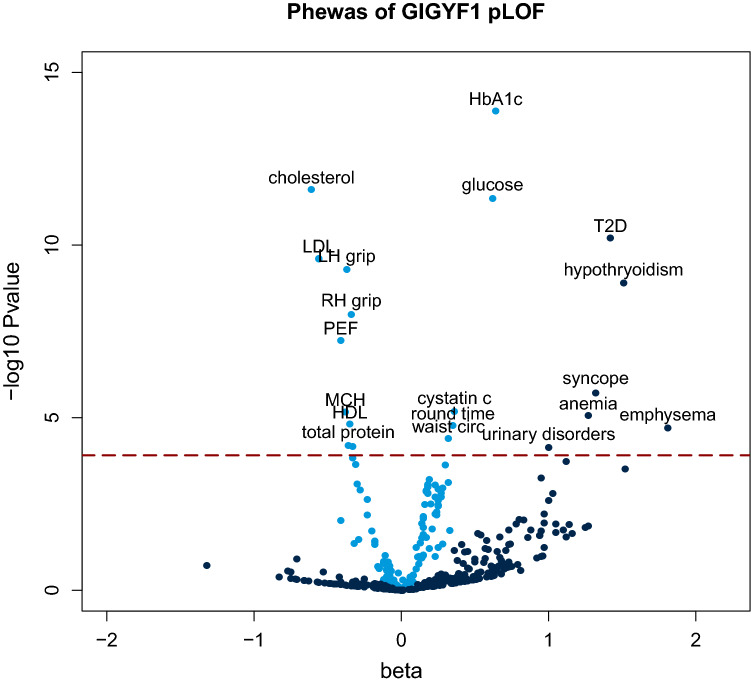
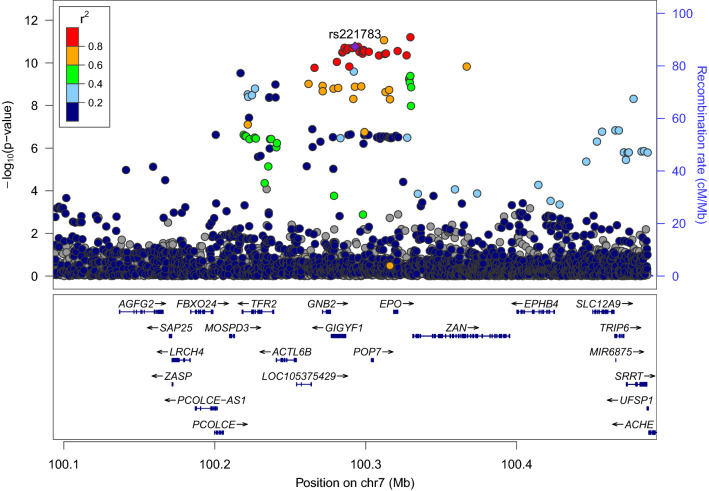
Sequencing of large cohorts offers an unprecedented opportunity to identify rare genetic variants and to find novel contributors to human disease. We used gene-based collapsing tests to identify genes associated with glucose, HbA1c and type 2 diabetes (T2D) diagnosis in 379,066 exome-sequenced participants in the UK Biobank. We identified associations for variants in GCK, HNF1A and PDX1, which are known to be involved in Mendelian forms of diabetes. Notably, we uncovered novel associations for GIGYF1, a gene not previously implicated by human genetics in diabetes. GIGYF1 predicted loss of function (pLOF) variants associated with increased levels of glucose (0.77 mmol/L increase, p = 4.42 × 10⁻¹²) and HbA1c (4.33 mmol/mol, p = 1.28 × 10⁻¹⁴) as well as T2D diagnosis (OR = 4.15, p = 6.14 × 10⁻¹¹). Multiple rare variants contributed to these associations, including singleton variants. GIGYF1 pLOF also associated with decreased cholesterol levels as well as an increased risk of hypothyroidism. The association of GIGYF1 pLOF with T2D diagnosis replicated in an independent cohort from the Geisinger Health System. In addition, a common variant association for glucose and T2D was identified at the GIGYF1 locus. Our results highlight the role of GIGYF1 in regulating insulin signaling and protecting from diabetes.


Conflict of interest statement

A.D, L.W., M.P., A.F.C., L.B., G.H. and P.N. are employees and stockholders of Alnylam Pharmaceuticals. P.A., L.L. and A.B. are employees and stockholders of Regeneron Pharmaceuticals.

Figures

Figure 1
Figure 1
Gene-level associations with glucose and HbA1c levels. (A) pLOF associations with glucose levels. (B) Damaging missense variant (CADD score ≥ 25) associations with glucose levels. (C) pLOF associations with HbA1c. (D) Damaging missense variant associations with HbA1c levels. The red line indicates the threshold for significance, genes with significant associations are labeled.
Figure 2
Figure 2
Gene-level associations with T2D. (A) pLOF associations. (B) Damaging missense variant (CADD score ≥ 25) associations. The red line indicates the threshold for significance, genes with significant associations are labeled.
Figure 3
Figure 3
PheWAS of GIGYF1 pLOF. The x-axis is the beta (effect size in standard deviations) for the association and the y-axis is − log10 (p-value). Quantitative traits are colored light blue and ICD10 diagnoses colored dark blue. Phenome-wide significant associations are labeled. The dashed line indicates the p-value threshold for phenome-wide significance. Protein; total protein, RH grip; right hand grip strength, round time: time to complete round (cognitive test), LH grip; left hand grip strength, PEF; peak expiratory flow.
Figure 4
Figure 4
Locus plot of glucose associations at the GIGYF1 locus. Association results for array genotyped and imputed variants are shown. The purple diamond represents the lead variant rs221783. Other variants are colored according to correlation (R2) with this marker (legend at top-left). The region displayed is chr7: 100092914–100492914. Genomic coordinates are for hg19.

References

    1. King EA, Davis JW, Degner JF. Are drug targets with genetic support twice as likely to be approved? Revised estimates of the impact of genetic support for drug mechanisms on the probability of drug approval. PLoS Genet. 2019;15:e1008489. doi: 10.1371/journal.pgen.1008489. - DOI - PMC - PubMed
    1. Nelson MR, et al. The support of human genetic evidence for approved drug indications. Nat. Genet. 2015;47:856–860. doi: 10.1038/ng.3314. - DOI - PubMed
    1. Nguyen PA, Born DA, Deaton AM, Nioi P, Ward LD. Phenotypes associated with genes encoding drug targets are predictive of clinical trial side effects. Nat. Commun. 2019;10:1579. doi: 10.1038/s41467-019-09407-3. - DOI - PMC - PubMed
    1. Cirulli ET, et al. Genome-wide rare variant analysis for thousands of phenotypes in over 70,000 exomes from two cohorts. Nat Commun. 2020;11:542. doi: 10.1038/s41467-020-14288-y. - DOI - PMC - PubMed
    1. Flannick J, et al. Exome sequencing of 20,791 cases of type 2 diabetes and 24,440 controls. Nature. 2019;570:71–76. doi: 10.1038/s41586-019-1231-2. - DOI - PMC - PubMed

Publication types

MeSH terms