. 2021 Nov;599(7886):645-649.
doi: 10.1038/s41586-021-04055-4. Epub 2021 Nov 3.

Striatal indirect pathway mediates exploration via collicular competition

Affiliations

Striatal indirect pathway mediates exploration via collicular competition

Jaeeon Lee et al. Nature. 2021 Nov.

Abstract

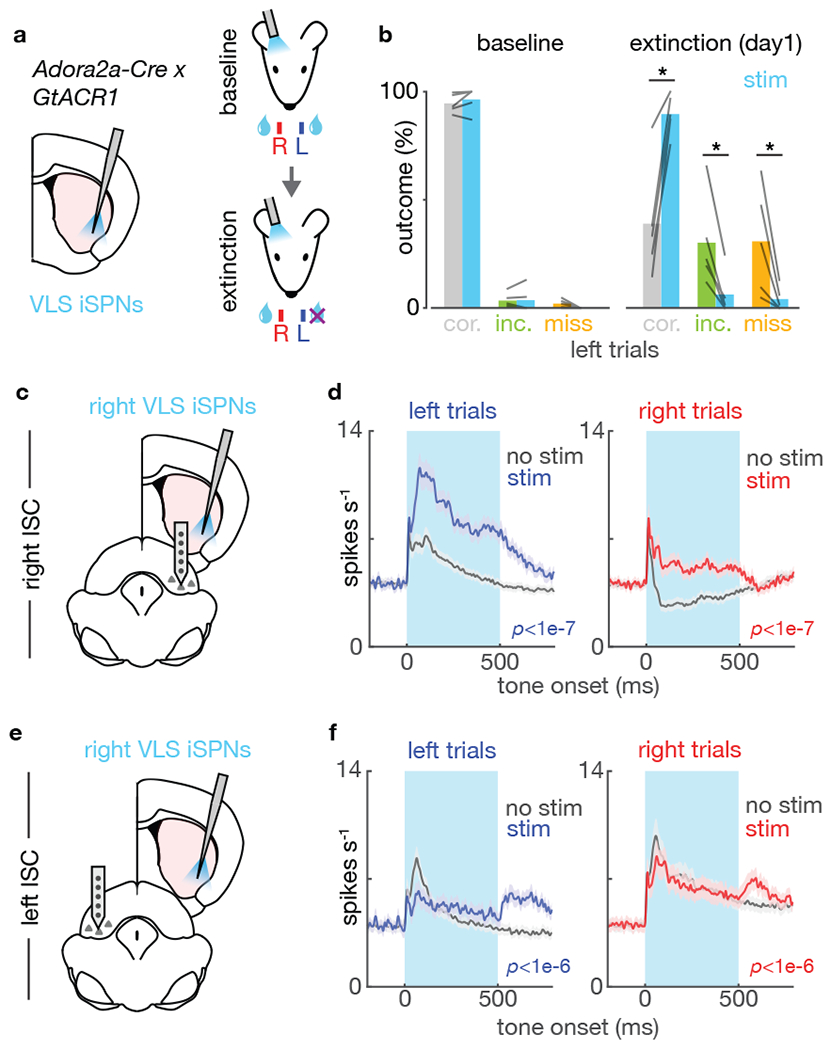
The ability to suppress actions that lead to a negative outcome and explore alternative actions is necessary for optimal decision making. Although the basal ganglia have been implicated in these processes1-5, the circuit mechanisms underlying action selection and exploration remain unclear. Here, using a simple lateralized licking task, we show that indirect striatal projection neurons (iSPN) in the basal ganglia contribute to these processes through modulation of the superior colliculus (SC). Optogenetic activation of iSPNs suppresses contraversive licking and promotes ipsiversive licking. Activity in lateral superior colliculus (lSC), a region downstream of the basal ganglia, is necessary for task performance and predicts lick direction. Furthermore, iSPN activation suppresses ipsilateral lSC, but surprisingly excites contralateral lSC, explaining the emergence of ipsiversive licking. Optogenetic inactivation reveals inter-collicular competition whereby each hemisphere of the superior colliculus inhibits the other, thus allowing the indirect pathway to disinhibit the contralateral lSC and trigger licking. Finally, inactivating iSPNs impairs suppression of devalued but previously rewarded licking and reduces exploratory licking. Our results reveal that iSPNs engage the competitive interaction between lSC hemispheres to trigger a motor action and suggest a general circuit mechanism for exploration during action selection.


Conflict of interest statement

Declaration of Interests

Dr. Sabatini is a founder and holds private equity in Optogenix. Tapered fibers that are commercially available from Optogenix were used as tools in the research.

Competing interests. B.L.S. is a founder of and holds private equity in Optogenix. Tapered fibers commercially available from Optogenix were used as tools in the research.

Figures

ED Fig.1 |
ED Fig.1 |. Histology, baseline behavior, and effects of iSPN stimulation on the next trial.
a. Example histology (left) showing CoChR expression (green) and the tapered fiber location as revealed by glial fibrillary acidic protein (GFAP) staining (magenta). Scale bar: 1 mm. The CoChR expression in striatum averaged across mice is also shown (right). b. Baseline expert behavior after two weeks of training. Percentages of correct (grey), incorrect (green) and miss (orange) outcomes for left- and right-cued trials (n=7 mice). c. left, Median lick latency measured from tone onset to spout contact for left- (blue) and right- (red) cued trials. right, Mode of inter-trial-interval for licks to the left (blue) and right (red) ports. d. Functional map of optogenetic perturbations at 8 striatal sites showing changes in percentages of incorrect (left) and miss (right) outcomes (see Fig.1e). The color and size of each circle denote the effect size and p-value (bootstrap), respectively (n=5 mice, 9 sessions). e. Effect of VLS iSPN stimulation on the next trial (n+1 trial) relative to control trials (excluding all n+1 trials). For n+1 trials, only those following left-cued trials were included as optogenetic stimulation only affected left-cued trials (i.e. contraversive to the stimulation site in the right striatum) (n=7 mice) (see Fig.1e; Methods) (n.s.: P>0.05, two-tailed t-test). f. Median latency to first lick in no stimulation trials (separated into left vs. right; blue/red) and stimulation trials (sorted into incorrect vs. correct; green/grey). Correct licks during stimulation trials to the left were delayed compared to those during no stimulation trials (P*<0.05, two-tailed t-test) (left licks: n= 6 sessions, right licks: n=9 sessions, see Methods).
ED Fig.2 |
ED Fig.2 |. Context-dependent effect of iSPN stimulation.
a, c. Effect of devaluating one motor program by extinction. An example session from one mouse showing the effects of iSPN stimulation on the left (a) or right (c) hemisphere before (pre-extinction, top) and after (post-extinction, bottom) devaluation of the right port. Each dot represents licking either to the left (blue) or right (red). Trials (rows) are sorted by being no stimulation (black) and stimulation trials (light blue). Only trials with licking cued to the port contralateral to optogenetic stimulation (right in a, left in c) are shown. b, d. Percentages of each outcome type for pre- (black, left) and post- (purple, right) extinction optogenetic stimulation trials (stim, light blue) and control trials (no stim, black). Outcomes are color-coded grey (correct), green (incorrect), and orange (miss) (n=5 mice). The selection of the incorrect port following optogenetic stimulation of iSPN on the right striatum significantly decreased after extinction (P<0.0125, one-tailed t-test), whereas it remained the same for iSPN stimulation on the left (P=0.65, one-tailed t-test). e. Effect of bilateral iSPN stimulation. Summary plots for the outcomes for no stimulation (black) and stimulation (light blue) trials, during left- (center) and right- (right) cued trials (n = 5 mice). Optogenetic stimulation significantly decreased the correct outcome rate and increased the miss outcome rate but did not change the incorrect outcome rate (**P < 0.001, two-tailed t-test; n.s.: P > 0.05). f. left, We trained a group of mice to only lick to the left spout, while still having access to both spouts. Right iSPN stimulation in these mice failed to induce licking of the right spout, supporting that stimulation-induced licking is not a hardwired motor program. right, Stimulation decreased correct outcome rate and increased the miss outcome rate, but failed to increase incorrect outcome rate (i.e. the rate of licking to the right spout which the mice were never trained to lick) (**P < 1 × 1e–8, two-tailed t-test; n.s.: P > 0.05). g. As in panel f for left VLS iSPN stimulation (*P < 0.05, two-tailed t-test; n.s.: P > 0.05). h. In mice trained on the main two-spout task, we also observed that iSPN stimulation during the inter-trial-interval (ITI), when mice rarely licked, induced ipsiversive licking although this effect emerged only after multiple stimulation sessions. Plots showing change in probability of licking after optogenetic stimulation during the ITI relative to control trials (n = 10 mice for 1st and 2nd session, n = 9 mice for 3rd session). Stimulation caused ipsilateral licking from 2nd session onward, and weakly suppressed contralateral licking relative to baseline (***P < 1x1e-4, **P < 0.005, *P < 0.05).
ED Fig.3 |
ED Fig.3 |. Unilateral inactivation of the direct pathway in VLS suppresses licking on both sides.
a. Schematic showing strategy to inhibit striatal direct pathway. Mice expressing an inhibitory opsin GtACR1 in the direct pathway (R26-CAG-LNL-GtACR1-ts-FRed-Kv2.1 x Drd1a-Cre, see methods) was implanted with a tapered fiber in the right VLS. b. Example session during which a mouse underwent direct pathway inactivation similar to the experiment described in Fig.4b (see Methods). Trials are sorted by trial type similar to that described in Fig.1d. c. Percentage trial outcome for contra trials (top) and ipsi trials (bottom). Unilateral direct pathway inactivation lead to a decrease in correct rate and an increase in miss trial rate (P***<0.0005, two-tailed t-test; n=5 mice, power = 2mW). d. Change in miss trials percentage for different power levels (0.2, 0.5 and 2mW).
ED Fig.4 |
ED Fig.4 |. VLS recipient SNr projection, effect of muscimol infusion in lSC, and direction selectivity of activity in lSC.
a-c. AAV1-Cre mediated anterograde tracing of SNr neurons downstream of VLS shows that VLS recipient SNr (VLSSNr) sends bilateral projections to contralateral and ipsilateral lSC. Interestingly, this bilateral projection was largely specific to lSC. a. left, Schematic of the AAV1-Cre anterograde trans-synaptic mapping strategy to reveal the projections of VLS-recipient SNr (VLSSNr). b. Example histology of superior colliculus: VLSSNr (green) projects to both ipsilateral lSC (i-lSC) and contralateral lSC (c-lSC). SNr is outlined with a white dotted line. Scale bars: 1mm (left panel), 100 μm (3 insets in right column). c. left column, Schematics of coronal sections and coordinates relative to bregma. VM: ventromedial thalamus; Pf: parafasciular nucleus; SC: superior colliculus; IRt/PCRt: intermediate reticular formation/parvocellular reticular formation. right column, histological examples showing SNr axons (green) labelled via anterograde tracing (see Main text, Fig.3b) and DAPI (purple). The left and right columns show contralateral and ipsilateral sides, respectively, relative to the labeled SNr cell bodies (i.e. the injection side). Midline crossing SNr axons were only seen in lateral SC. Similar results were observed in total of n=3 mice. Scale bars: 200 μm. d. Activity in lSC was necessary for the lateralized licking in the task, as muscimol, a GABAA receptor agonist, infused into lSC unilaterally reduced task performance only on trials in which the correct selection port was contralateral to the infusion site. left, Muscimol was infused unilaterally in lSC as the mouse performed the task. right, percentages of correct trials before (baseline, grey) and after (muscimol, purple) infusion. Muscimol infusion significantly impaired performance of contralateral cued trials (n=8 lSC sites, 4 mice, P**<1e-6, two-tailed t-test). e. left, Example histological section showing recording probe location (green = Dil). right, location of all probe tip location (cross). Each cross depicts one mouse. f. left, Each dot shows the average activity of one unit in the first 200 ms after tone onset (spikes/s) during contraversive trials plotted versus that in ipsiversive trials. The directional selectivity of each unit is color-coded (purple: contra; green: ipsi; grey: no preference). Overall population activity was higher during contraversive trials (P<1e-8, two-tailed t-test). right, Numbers of cells preferring contraversive or ipsiversive licking trials, or having no preference (contra-preferring: 296/673, ipsi-preferring: 139/673, no preference: 238/673). g. Mean firing rate of contraversive preferring (purple), ipsiversive preferring (green) and no preference (grey) units shown aligned to tone onset (dashed line) during contralateral and ipsilateral cued trials (contra: n= 296, ipsi: n=139; mean ± s.e.m. across units). h. Mean firing rate (z-scored relative to firing during the ITI, left) and selectivity (spikes/s, right) of all lSC units. Each row shows data for a single unit, sorted by coding preference (right column for each panel). For each coding preference, units are sorted by the timing of peak firing relative to baseline. i. Selectivity (spikes/s; activity in preferred – anti-preferred trials) aligned to tone onset (left) or 1st lick (right) for contraversive- and ipsiversive-preferring neurons (mean ± s.e.m across units). j. Mean firing rate, peak-valley timing and spike width of waveforms of units in each coding group. No significant differences were observed between groups.
ED Fig.5 |
ED Fig.5 |. Detailed analysis of lSC activity modulation after iSPN stimulation.
a. Example units that were not significantly modulated by stimulation. Peri-stimulus histogram showing no stimulation trials (left) and stimulation trials (right, light blue=laser on) during left- (blue) and right- (red) cued trials. b. Changes in firing rate (similar as in Fig.2i) but with data separated for contraversive preferring, ipsiversive preferring and no-preference units during left-cued trials (left column) and right-cued trials (right column) in right lSC (top row) and left lSC (bottom row). Only contraversive preferring neurons were significant modulated by iSPN activation in both left and right trials in left and right lSC (p-values for two-tailed t-test in the 100ms window after stimulation onset are shown). c. Changes in firing rate induced by stimulation (Δspikes s−1 = activity in stim trials – activity in no stim trials) for units in the right (top) and left (bottom) lSC for stimulation trials but including only data from the subset of sessions that had both incorrect and miss outcomes (incorrect: blue, miss: grey; Methods) and separating trials based on outcome. Changes in firing rates in right SC did not differ (n=129, P=0.40, two-tailed t-test) but changes were larger in left SC during incorrect licking vs miss trials (n=64, P=0.01, two-tailed t-test). Firing rate are show as mean ± s.e.m. across units. d. Fractions of neurons that were excited, inhibited, or unchanged by optogenetic stimulation in left- and right-cued trials for contraversive-lick-preferring (left), ipsiversive-lick-preferring (middle), and untuned (no pref, right) groups (similar analysis as Fig.2g) recorded in the left or right SC. e. iSPN activation during the ITI (e-f). Example units recorded in the left SC (left panel) and right SC (right panel). Peri-stimulus histogram shows trials during which the stimulation did (red/blue) or did not (grey) induce licking. Firing rates are given as mean ± s.e.m across trials. f. Average changes in firing rate after stimulation (Δspikes s−1) in left SC (left panel) and right SC (right panel) grouped by behavioral outcome (red/blue=lick; grey=no lick). Firing rates shown as mean ± s.e.m across units (left SC: n=225; right SC: n=201). g. Average firing rates during the 100 ms stimulation window for stimulation trials without (y-axis) vs. with (x-axis) licking. Each dot represents a single unit. P-values show significance of modulation (two-tailed t-test).
ED Fig.6 |
ED Fig.6 |. lSC anatomical projection, IRt inhibition, and analysis of lSC/IRt activity after lSC inactivation.
a. left, Schematic showing strategy to label lSC via anterograde transsynaptic cre (AAV1.Flpo, grey) in tjM1, with injection of anterograde tracer (AAV.fDIO.EYFP, green) in the lSC. right, Sagittal section showing the cell bodies around the injection site and the axonal projection on the contralateral lSC. Scale bar, 1 mm (left panel), 200 μm (2 insets in right column). b. left, Coronal section showing expression of Jaws in lSC. Inset shows cell bodies around the injection site. Scale bar, 1 mm (main panel), 50 μm (inset in top right corner). right, optical fiber tip locations. c. Coronal section showing expression of Jaws in IRt. Inset shows cell bodies around the injection site. Scale bar, 1 mm (main panel), 50 μm (inset in top right corner). d. Schematic illustrating Jaws expression in right IRt in wild type mice. e. Example session showing (as in Fig.1d) the effect of IRt inhibition on performance in left and right cued trials, as indicated. The purple rectangle shows the time of laser activation (n=4 mice). f. Quantification of trial outcomes (n=4 mice). Percentages of correct, incorrect and miss outcomes in no stimulation (grey, green and orange) and stimulation trials (purple) in left (left panel) or right (right panel) cued trials. IRt inhibition caused a significant decrease in correct rate (P*<0.05, two-tailed t-test) and increase in incorrect and miss rates (P*<0.05, two-tailed t-test) in right trials. g. Example unit in lSC that was suppressed via red laser stimulation of Jaws expressed in lSC. Laser on period is shown in purple. h. Normalized firing rate of all units recorded during left (left panel) and right (right panel) trials with stimulation (blue/red) and without (grey) stimulation. i. Quantification of Jaws inhibition for all units during left (blue) and right (red) trials (n=14 units; P*<0.05, P**<0.005, two-tailed t-test). j. Fraction of cells that were significantly modulated by contralateral lSC inhibition (similar as in Fig.3j, but repeated for different coding groups). k. Changes in firing rate after contralateral lSC inhibition (Δspikes s−1 = activity in stim trials – activity in no stim trials) for ipsiversive- (green) and contraversive (purple) preferring units during left (left panel) or right (right panel) trials. contraversive preferring but not ipsiversive preferring units were significantly modulated by contralateral lSC inhibition (p-values from two-tailed t-test shown for each group). l. Same as in h but sorted by trial outcome (incorrect=blue, miss=grey). lSC activity after contralateral lSC inhibition differentiated incorrect vs miss trials, with higher excitation during incorrect trials (P<1e-7, two-tailed t-test).
ED Fig.7 |
ED Fig.7 |. GtACR1 histology and detailed analysis of effects of iSPN inactivation on task performance and lSC activity.
a. left, Coronal section showing expression of GtACR1 in striatum in an Adora2a-Cre mouse crossed with a conditional GtACR1 mouse (see Methods). middle, Inset showing the expression of GtACR1 in iSPN. right, Coronal section showing the tapered fiber location as revealed by glial fibrillary acidic protein (GFAP) staining (magenta). Scale bar, 1 mm (left), 50 μm (middle), 1 mm (right). b. similar to Fig.4c but for ipsiversive trials relative to fiber location (right trials, see main text) during a baseline session (left) and during extinction day1 (right). iSPN inactivation caused a significant decrease in correct rate, and significant increase in correct rate during baseline sessions (P*<0.05, two-tailed t-test). c. Quantification of percentage trial outcome for contraversive/ipsiversive trials during no stimulation and stimulation trials across session number. d. Number of units in each coding group (contra/ipsi/no preference) in left and right SC in mice after left spout extinction. e. Fractions of units that were significantly modulated (as in Fig.2g). There were more excited than inhibited units in right SC (left trial: P<1e-7; right trials: P<1e-99; two-tailed binomial test), whereas there were more inhibited than excited units in the left SC (left trial: P<1e-7; right trials: P<0.05; two-tailed binomial test). f. As Fig.4g, but sorted by behavioral outcome (see Main text). Color indicates the behavioral outcome upon iSPN inactivation (blue: left lick; red: right lick; grey: no lick). Change in firing rate in both trial types and both left and right lSC differentiated behavioral outcome (p-values shown for two-tailed t-test during 100ms window after laser onset). g. Schematic diagram summarizing the results shown in panel e. The size of arrow indicates the relative magnitude of modulation (to be compared only across behavioral outcomes and not across recorded location).
ED Fig.8 |
ED Fig.8 |. Low-dimensional projection of lSC activity reveals logic of iSPNs modulation of lSC
As the activity of neurons in lSC during the task is complex and heterogenous, we used dimensionality reduction to examine if, as a whole, neuronal population dynamics in lSC could be related to behavior and help explain effects of iSPN activity manipulation. Using only activity from trials without optogenetic stimulation, we projected lSC activity onto an axis (termed coding direction, CD) that best discriminated upcoming lick choice (see Methods). The projection onto CD represents the linear combination of activity in lSC (as might be calculated by a hypothetical downstream neuron) that allows maximal choice discrimination. As expected, lSC activity along CD discriminated correct trial types (c, left panel). Furthermore, optogenetic iSPN activation pushed lSC activity along the CD away from contraversive (left) and towards ipsiversive (right) choice (c, middle and right panels), even though activity in the optogenetic trials was not used to calculate the CD. Optogenetic modulation along other dimensions orthogonal to CD (calculated by PCA on the residual non-CD activity) was minimal, indicating that iSPN activity specifically modulates lSC neural population along a trajectory that determines lick choice as opposed to behavioral features, such as lick timing (see ED Fig.9e, f). After extinction of the left spout, lSC activity no longer moved along the CD towards the left-choice despite delivery of the left cue, consistent with lack of left-port licking in these trials (d, left panel). However, after extinction of the left spout, iSPN inactivation pushed lSC activity along the CD towards the left choice (d, middle and right panel). Thus, following extinction, activity in VLS iSPN was necessary for suppression of left-choice activity in the lSC. Phrased differently, iSPN activity specifically modulates lSC activity along a choice axis away from an activity space that no longer leads to valuable outcomes. a. Schematic showing lSC neural trajectory for left (blue) and right (red) trials. Trajectories maximally diverge along the axis termed coding direction (CD, see methods) b. Schematic showing lSC units (circle) on each hemispheres projecting onto a hypothetical downstream neuron (grey circle), which controls lick direction. Projection onto CD can be thought of as activity of a hypothetical neuron whose weights achieve maximal lick choice separation (see methods). c. Mean neural trajectories of lSC (both hemispheres combined, see Methods) projected onto CD during iSPNs activation experiment (see Fig.2, Main Text). Grey dotted line shows the timing of the tone onset (t=0). left, Control trials in which mice either licked left (blue) or right (red) without stimulation. middle, Left cued trials during no stim (blue) and stim trials (light blue). right, Right cued trials during no stim (red) and stim (light blue) trials. d. Mean neural trajectories of lSC (both hemispheres combined, see Methods) projected onto CD during iSPNs inactivation experiment after extinction (see Fig.4, Main Text). Traces plotted as panel c.
ED Fig.9 |
ED Fig.9 |. Detailed analysis of low dimensional projection of lSC activity
a. Activity projections onto PCs, and different coding directions. Left (blue) and right (red) trials are shown relative to tone onset. Coding direction was defined during −100~0ms window relative to tone onset (left, CD1), 0~100ms relative to tone (center, CD2) and 100~0ms relative to first lick (right, CD3) (see Methods). CD1 was used as a control. b. PCA on the original data (without first calculating and removing CD2 information as in Figure 5). Left/right lick (i.e. choice) information is found in PC2 (2nd column). c. Left-right choice selectivity measured from the projection of the neural activity along the indicated axes. Selectivity measures how separable the trajectories are along the selected axis. The given P-values are for comparison by one sample two tailed t-test (P***<0.0005, P*<0.05). The trajectories are well-separable along different choice axes. PCs did not reliably discriminate trial type compared to CD (except for PC5). d. Explained variance along each dimension (see Methods). CD explained the most variance in the data (20.5 ± 2.3%). Explained variances for CD, CD+PC1+PC2, and CD+PC1~PC5 are shown. All error bars show bootstrapped standard error across units. e. Projections of neural activity as a function of time relative to the tone onset shown along PC3 (left), PC4 (middle) and PC5 (right). Data are shown for left- (top, blue) and right- (bottom, red) cued trials. The dotted lines show activity in no stim trials and thick lines that in stim trials. Light blue rectangle shows stimulation on window. f. Changes in activity during the stimulation window (100 ms) for each projection after stimulation (Δproject. modulation) along different dimensions during left- (blue) and right- (red) cued trials. Stimulation modulates activity the mostly along CD. P-values show significance of modulation (two-tailed t-test). g. similar analysis as panel f for iSPN inactivation (Main Fig.4, ED Fig.8d, see methods). P-values show significance of modulation (two-tailed t-test).
ED Fig.10 |
ED Fig.10 |. Circuit mechanism of contra lSC excitation, and model of exploration via iSPNs-Colliculus
a-d. Potential circuit mechanisms by which iSPN could excite contra lSC. Color indicates the direction of modulation after iSPN activation, and shapes indicates cell type (triangle: excitatory; circle: inhibitory). Note that all these mechanisms are not mutually exclusive and a combination of these might occur together. We provide evidence for model a and b, in which inhibition lSC in one hemisphere disinhibit lSC on the opposite hemisphere (Fig. 3). a. Long-range inhibitory projection crossing the midline could mediate contra lSC excitation. In this scenario, iSPN will cause SNr to be excited, suppressing ipsi lSC, which in turn will disinhibit contra lSC. b. Long-range excitatory projection innervating local inhibitory interneurons could mediate this effect. c. A region outside SC (grey patch) could mediate the disinhibitory effect (e.g. nucleus isthmus; see main text). d. Separate population of SNr neurons could innervate ipsi and contra lSC. In this scenario, iSPN activation would lead to bidirectional modulation of SNr neurons, with ipsi lSC projecting SNr neurons being excited, and contra lSC projecting SNr neurons being inhibited. e. Schematic diagram of the exploration model proposed. iSPN integrate information about the outcome of specific action performed in a specific context. The function of iSPN to learn which actions lead to a negative outcome and suppress them in the future. iSPN can then suppress the target action that lead to the negative outcome. Via disinhibition within SC, this leads to a rapid execution of a competing motor program. Although the circuit from specific iSPN to target action is hardwired, competitive interaction within SC is more dynamic and tunable so the same activation of iSPN can lead to different actions depending on the availability of the competing motor program.
Fig.1 |
Fig.1 |. iSPN activation in ventrolateral striatum induces ipsiversive movements
a, Stimulation protocol: CoChR (green) was expressed in Adora2a-Cre mouse and implanted with two tapered fibers. Each circle (blue) indicates a stimulation site. b. Trial structure of the lateralized licking task. c. Stimulation protocol: the laser (light blue) is turned on in a random subset (~30%) of trials for 100 ms starting 25 ms after tone onset. d. Each row shows behavior in a single trial with each dot representing a lick to the left (blue) or right (red) port timed relative to tone onset. Trials are sorted by trial type (top: left-cued trials, bottom: right-cued trials) and further divided into no stimulation trials (black) and optogenetic stimulation trials (light blue). The far-right column shows the trial outcomes labeled as correct (gray), incorrect (green), or miss (orange). e. Summary of functional perturbations (percentage of correct choices, Δcorrect) induced by optogenetic stimulation on left- or right-cued trials. Each circle indicates a striatal stimulation site with the color and size denoting the effect size and p-value (bootstrap), respectively (n=5 mice, 9 sessions). Stimulation in the VLS most perturbed performance (Δcorrect=−82%, P<1e-5). f. Trial outcomes with and without VLS stimulation (n=9 sessions) showing that stimulation (light blue bars) significantly decreased correct (grey), and increased incorrect (green) and miss (orange) rates (P**<0.001, P<0.01, two-tailed t-test). correct (grey).
Figure 2 |
Figure 2 |. Bilateral and opposite modulation of lSC hemispheres by iSPN activation
a. Schematic of extracellular recording in lSC on either side of the brain in Adora-Cre mice expressing CoChR in VLS and performing the task. b. Peri-stimulus time histogram of activities of two example units. Correct left (blue) and right (red) cued trials are shown, aligned to either tone onset or the 1st lick (dashed lines). c. Firing rate (orange) and firing rate selectivity (light blue) aligned to tone onset and 1st lick (dashed lines). Solid line shows the average and shaded areas the SEM across units (n=673 units; 7 mice). d. Schematic of stimulation of iSPN in the right VLS while recording in the right (top) or left (bottom) lSC. e. Peri-stimulus time histograms of activities for two example units recorded in either right (top) or left (bottom) lSC in left- (blue) and right- (red) cued trials either without (no stim, left panels) or with (stim, right panels) optogenetic stimulation (shown in light blue). f. Average firing rate of lSC units in the right (top) and left (bottom) lSC during left- (blue) and right- (red) cued trials (stimulation in blue/red; no stimulation in grey). Only units that had directional selectivity during no stimulation trials are shown (right SC: n=249, left SC: n=186). Stimulation decreased activity of neurons in the right SC (left trials: P<1e-19; right trials: P<1e-10, two-tailed t-test) and increased activity of neurons in the left SC (left trials: P<1e-8; right trials: P<1e-5, two-tailed t-test comparing average activity during the 100 ms of stimulation). g. Fractions of units that were significantly modulated. Cells were excited (red), inhibited (blue) or showed no change (grey). There were more inhibited than excited units in right SC (left trial: P<1e-10; right trial: P<1e-10; two-tailed binomial test), and more excited than inhibited units in the left SC (left trial: P<1e-26; right trials: P<1e-15; two-tailed binomial test).
Figure 3 |
Figure 3 |. Unilateral inhibition of lSC mimics iSPN activation
a. Schematic illustrating Jaws expression in the right lSC in wild type mice (WT). b. lSC inhibition caused a significant decrease in correct and increase in incorrect rates (P*<0.05, two-tailed t-test) in left trials (n=6 mice). c. Schematic illustrating the optical fiber in the right lSC and recording electrode in the left lSC. d. Mean firing rate of all left lSC units in left- (left panel) and right- (right panel) cued trials with (blue/red) and without (grey) stimulation (n=152 units, 4 mice). The laser-on period is shown in purple. Stimulation (right lSC inactivation) increased firing rate for both left and right trials (left trials: P<1e-18; right trials: P<1e-8, two-tailed t-test). Only directionally selective units are shown. e. Fractions of units that were significantly excited (red) or inhibited (blue) and that were unaffected (grey). There were more excited vs inhibited units (left trials: P<1e-99; right trials: P<1e-3; two-tailed binomial test).
Figure 4 |
Figure 4 |. iSPN activity is necessary for suppression of unrewarded action and for exploration of an alternative action.
a. Schematic showing a tapered fiber targeting right VLS in an Adora2a-Cre; GtACR1 mouse expressing the inhibitory opsin in iSPN. iSPN in VLS were inactivated during baseline and after extinction on the left spout. b. iSPN inactivation significantly increased correct rate and decreased incorrect and miss rates in left trials (P*<0.05, two-tailed t-test) (n=5 mice). c. iSPN in the right VLS were inactivated while an extracellular recording was performed in the right lSC (same side). d. Mean firing rate of all directionally selective right lSC units in left- (left panel) and right- (right panel) cued trials during stimulation (blue/red) and no stimulation trials (right lSC=179 units, 5 mice). The laser-on period is shown in light blue. P-values shown for stim vs no stim in the first 100ms window after laser onset (two-tailed t-test, see Methods). e, f As in panels c, d for recordings on the left lSC (contralateral of the stimulation side) (left lSC=166 units, 5 mice). P-values shown for stim vs no stim (two-tailed t-test).

References

    1. Amita H & Hikosaka O Indirect pathway from caudate tail mediates rejection of bad objects in periphery. Sci. Adv 5, eaaw9297 (2019). - PMC - PubMed
    1. Tai L-H, Lee AM, Benavidez N, Bonci A & Wilbrecht L Transient stimulation of distinct subpopulations of striatal neurons mimics changes in action value. Nat. Neurosci 15, 1281–1289 (2012). - PMC - PubMed
    1. Nonomura S et al. Monitoring and Updating of Action Selection for Goal-Directed Behavior through the Striatal Direct and Indirect Pathways. Neuron 99, 1302–1314.e5 (2018). - PubMed
    1. Parker NF et al. Reward and choice encoding in terminals of midbrain dopamine neurons depends on striatal target. Nat. Neurosci 19, 845–854 (2016). - PMC - PubMed
    1. Cox J & Witten IB Striatal circuits for reward learning and decision-making. Nat. Rev. Neurosci 20, 482–494 (2019). - PMC - PubMed

Additional References

    1. Gerfen CR, Paletzki R & Heintz N GENSAT BAC Cre-Recombinase Driver Lines to Study the Functional Organization of Cerebral Cortical and Basal Ganglia Circuits. Neuron 80, 1368–1383 (2013). - PMC - PubMed
    1. Guo ZV et al. Flow of Cortical Activity Underlying a Tactile Decision in Mice. Neuron 81, 179–194 (2014). - PMC - PubMed
    1. Mante V, Sussillo D, Shenoy KV & Newsome WT Context-dependent computation by recurrent dynamics in prefrontal cortex. Nature 503, 78–84 (2013). - PMC - PubMed
    1. Li N, Daie K, Svoboda K & Druckmann S Robust neuronal dynamics in premotor cortex during motor planning. Nature 532, 459–464 (2016). - PMC - PubMed
    1. Bro R, Acar E & Kolda TG Resolving the sign ambiguity in the singular value decomposition. J. Chemom 22, 135–140 (2008).

Publication types