. 2021 Nov;599(7886):657-661.
doi: 10.1038/s41586-021-04062-5. Epub 2021 Nov 3.

Cold-induced Arabidopsis FRIGIDA nuclear condensates for FLC repression

Affiliations

Cold-induced Arabidopsis FRIGIDA nuclear condensates for FLC repression

Pan Zhu et al. Nature. 2021 Nov.

Erratum in

Abstract

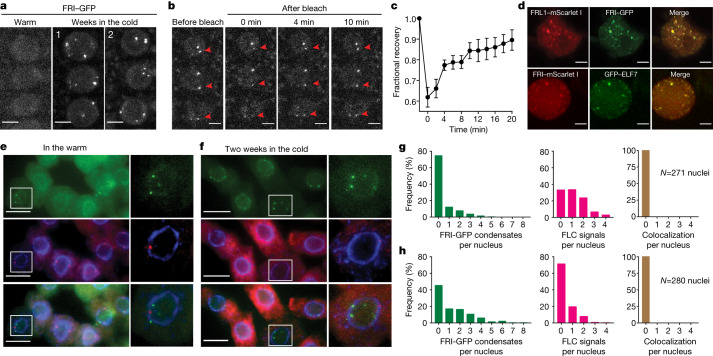
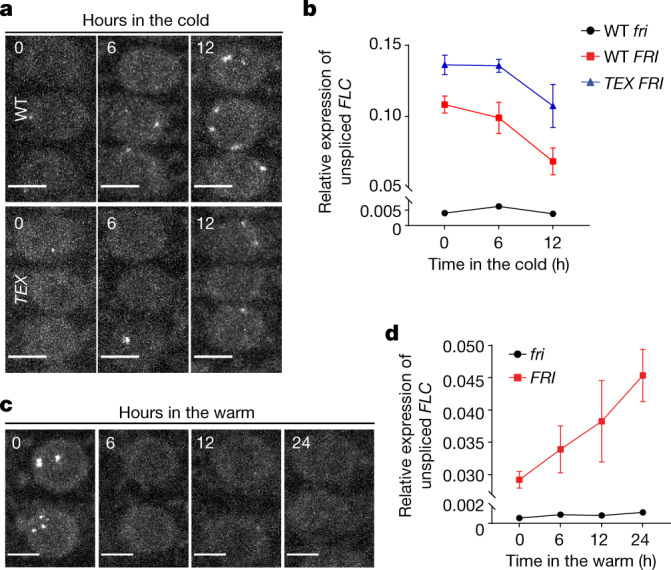
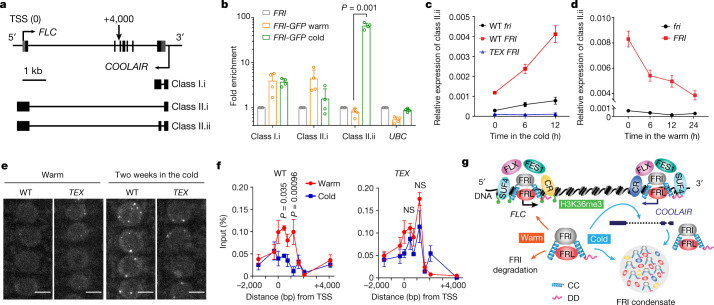
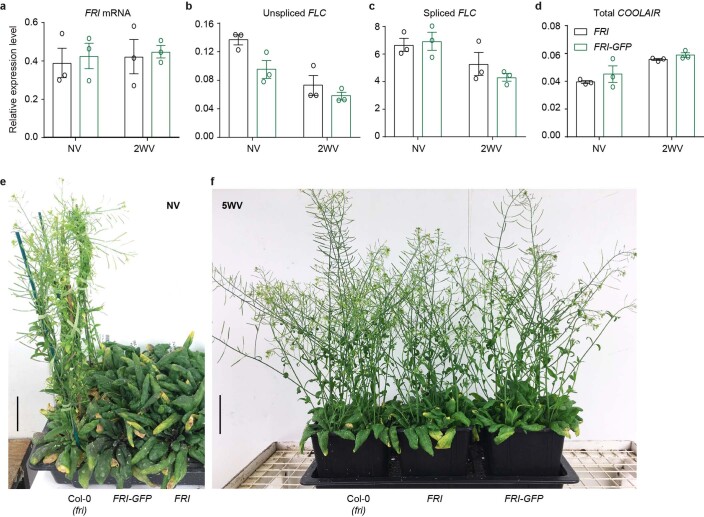
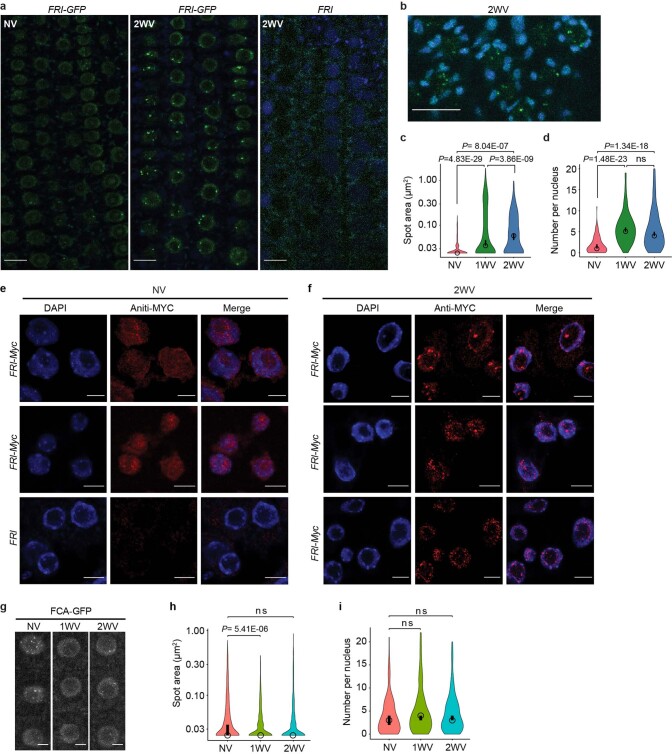
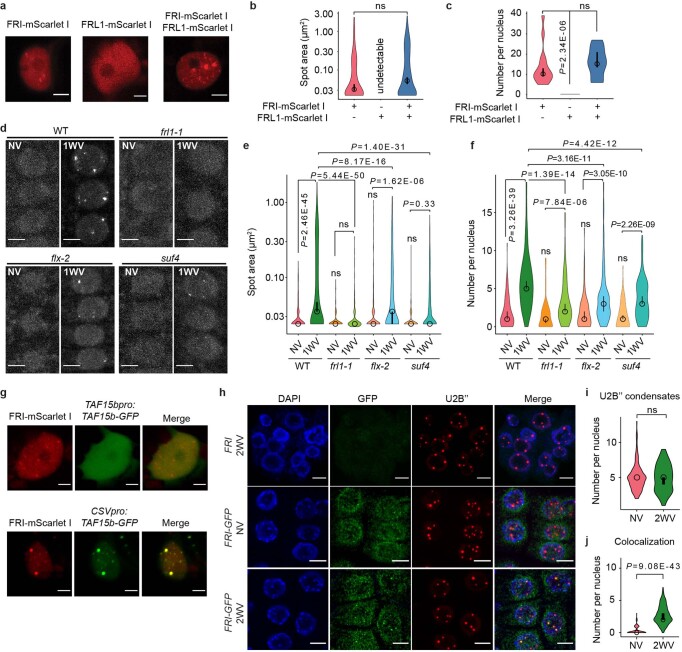
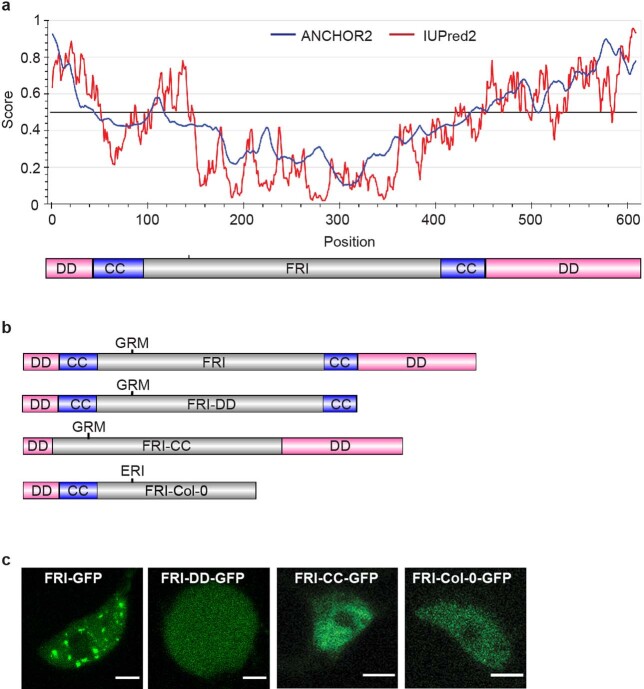
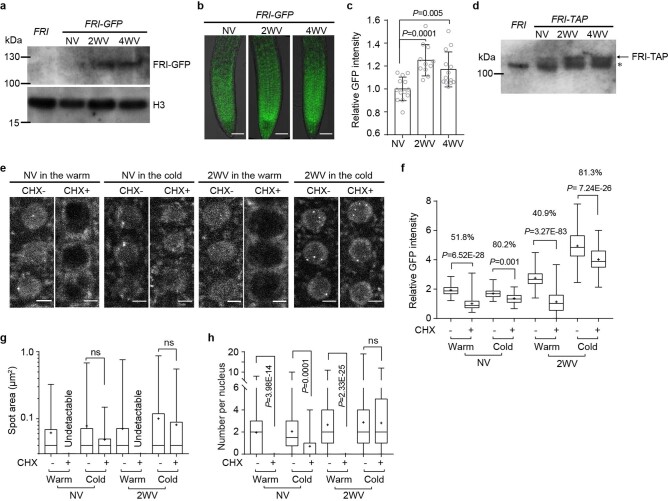
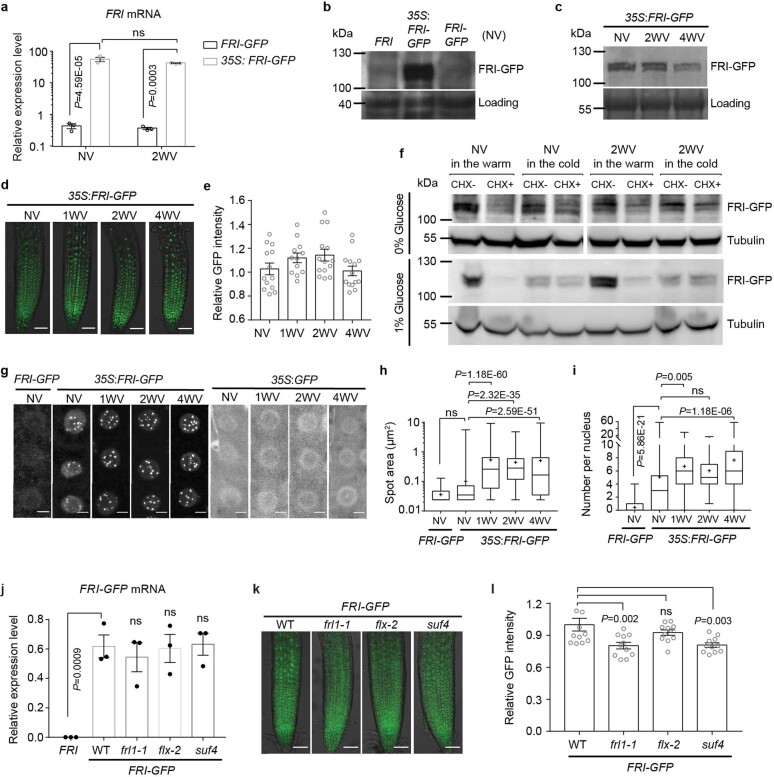
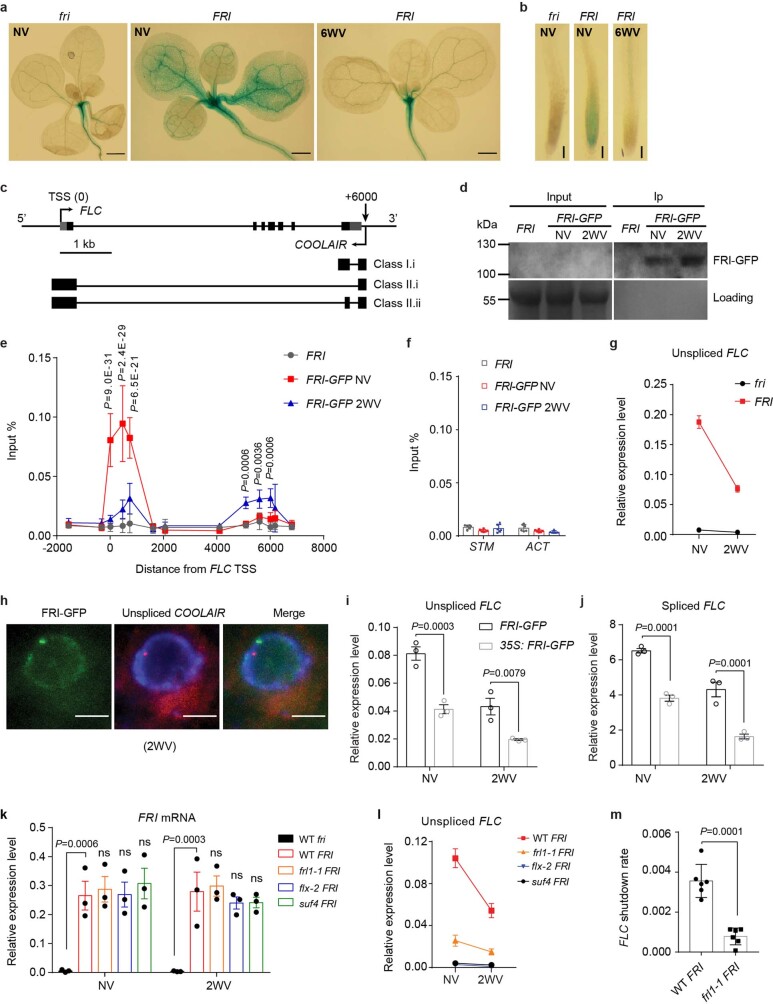
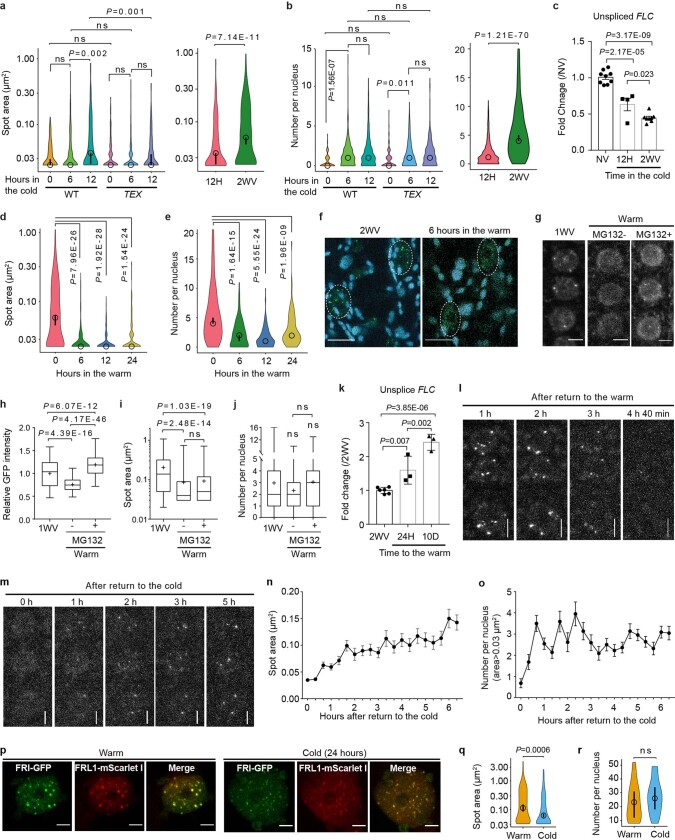
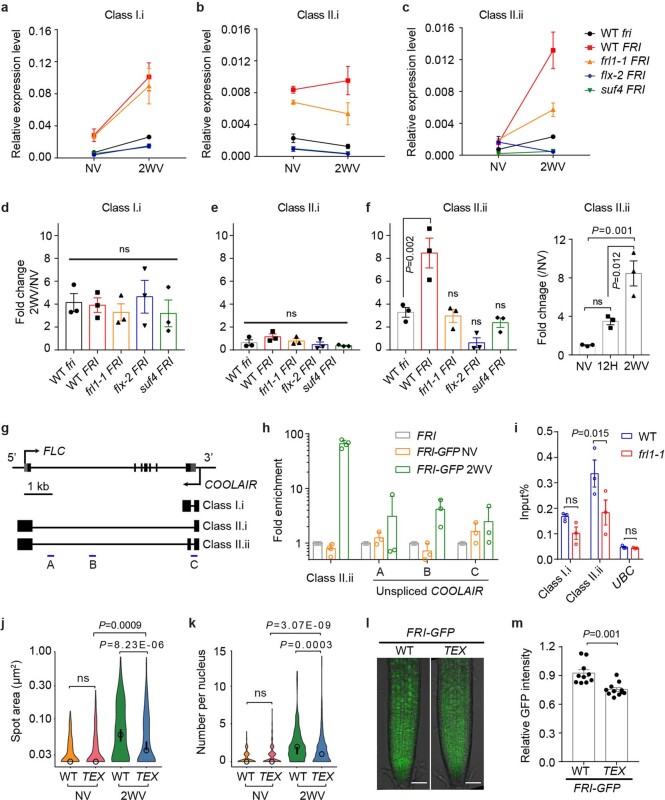
Plants use seasonal temperature cues to time the transition to reproduction. In Arabidopsis thaliana, winter cold epigenetically silences the floral repressor locus FLOWERING LOCUS C (FLC) through POLYCOMB REPRESSIVE COMPLEX 2 (PRC2)1. This vernalization process aligns flowering with spring. A prerequisite for silencing is transcriptional downregulation of FLC, but how this occurs in the fluctuating temperature regimes of autumn is unknown2-4. Transcriptional repression correlates with decreased local levels of histone H3 trimethylation at K36 (H3K36me3) and H3 trimethylation at K4 (H3K4me3)5,6, which are deposited during FRIGIDA (FRI)-dependent activation of FLC7-10. Here we show that cold rapidly promotes the formation of FRI nuclear condensates that do not colocalize with an active FLC locus. This correlates with reduced FRI occupancy at the FLC promoter and FLC repression. Warm temperature spikes reverse this process, buffering FLC shutdown to prevent premature flowering. The accumulation of condensates in the cold is affected by specific co-transcriptional regulators and cold induction of a specific isoform of the antisense RNA COOLAIR5,11. Our work describes the dynamic partitioning of a transcriptional activator conferring plasticity in response to natural temperature fluctuations, thus enabling plants to effectively monitor seasonal progression.


Conflict of interest statement

The authors declare no competing interests.

Figures

Fig. 1
Fig. 1. Cold-promoted FRI nuclear condensates are linked to FLC transcriptional shutdown.
a, Confocal microscopic images of FRI–GFP nuclear condensates in root cells in the indicated conditions. For quantitative analysis, see Extended Data Fig. 2c, d. b, c, Images (b) and quantification (c) of FRAP of FRI–GFP nuclear condensates. Time 0 indicates the time of the photobleaching pulse. Red arrows indicate the bleached condensates. Mean ± s.e.m.; n = 10 condensates in 10 cells. d, Confocal analysis of subnuclear colocalization of FRI with the co-expressed proteins in tobacco leaf nuclei. Data represent three independent experiments. e, f, Representative images (e, in the warm; f, in the cold) of nuclei expressing FRI–GFP (green) sequentially hybridized with intronic smFISH probes for FLC (red). DNA was labelled with DAPI (blue). Three independent experiments gave the same conclusion. g, h, Frequency distribution of FRI–GFP condensates (left), non-spliced FLC transcript signals (middle) and their colocalization per nucleus (right) in root cells in the warm (g) and in the cold (h). Numbers of analysed nuclei are as indicated. Scale bars, 5 μm (a, b, d); 10 μm (e, f). Source data
Fig. 2
Fig. 2. Short-term temperature fluctuations influence the formation of FRI nuclear condensates and FLC transcription.
a, c, Confocal microscopic images of FRI–GFP nuclear condensates in wild-type (WT) (top) and TEX (bottom) root cells after 0, 6 and 12 h of cold treatment (a) and in wild-type plants after they were returned to the warm for 0, 6, 12 and 24 h after a 2-week cold treatment (c). Scale bars, 5 μm. For quantitative analysis, see Extended Data Fig. 8a, b, d, e. b, d, Relative transcript level of unspliced FLC in the indicated plants within the same time course of changed temperatures in a, c by quantitative PCR with reverse transcription (RT–qPCR). Mean ± s.e.m.; n = 4 (b) and 3 (d) biologically independent experiments. Source data
Fig. 3
Fig. 3. COOLAIR promotes cold induction of FRI–GFP nuclear condensates and sequestration of FRI from the FLC promoter.
a, Schematic of FLC and COOLAIR transcripts at the FLC locus. Untranslated regions are indicated by grey boxes and exons by black boxes. kb, kilobase; TSS, transcription start site. b, RNA-IP assay of spliced COOLAIR enrichment by FRI–GFP with UBC as control. Mean ± s.d.; n = 4 replicates over 2 biologically independent experiments. Two-tailed t-test. c, d, Relative transcript level of COOLAIR class II.ii in the indicated plants within the same time course of changed temperatures as in Fig. 2 by RT–qPCR. Mean ± s.e.m.; n = 4 (c) and 3 (d) biologically independent experiments. e, Confocal images of wild-type and TEX root tip nuclei expressing FRI–GFP. Scale bars, 5 μm. For quantitative analysis, see Extended Data Fig. 9j, k. f, FRI–GFP occupancy on FLC promoter region in WT and TEX plants by CHIP. Mean ± s.e.m.; n = 3 biologically independent experiments. The exact distance from TSS referred to a. Two-way ANOVA adjusted by Sidak’s multiple comparisons test. NS, no significance. g, A working model for temperature-controlled FRI nuclear condensation in FLC transcriptional regulation. CC, coiled-coil domain; CR, co-transcriptional regulators; DD, disordered domain. Source data
Extended Data Fig. 1
Extended Data Fig. 1. Transgenic FRI-GFP is functionally equivalent to endogenous FRI.
ad, Relative expression level of FRI mRNA (a), unspliced FLC (b), spliced FLC (c) and total COOLAIR (d) in Col-0 plants with introgressive FRI (FRI) or transgenic FRI-GFP with its endogenous promoter, measured by RT–qPCR. Plants were given no cold (non-vernalization, NV) or 2 weeks of cold (2 weeks of vernalization, 2WV). Data are presented as mean ± s.e.m. of three independent biological replicates. e, f, Photographs showing flowering phenotype of Col-0 (fri), FRI-GFP and FRI plants in the warm (NV) or after 5 weeks of cold exposure (5WV). Scale bars, 5 cm Source data
Extended Data Fig. 2
Extended Data Fig. 2. Cold promotes FRI nuclear condensates in both root and leaf cells.
a, Single confocal images of NV and 2WV Arabidopsis root tip nuclei expressing FRI–GFP (green) with 2WV non-tagged FRI as a negative control. Data are represented of three independent experiments. b, Confocal images of 2WV Arabidopsis leaf nuclei expressing FRI–GFP (green). Maximum intensity projections of Z-stacks spanning the entire width of the nucleus were applied. Autofluorescence was unmixed with lambda mode (blue) (see Methods). a, b, Scale bars, 10 μm. c, d, Quantification of FRI–GFP nuclear condensate area (c) and number per nucleus (d) in root cells in Fig. 1a. An open circle indicates the median of the data and a vertical bar indicates the 95% confidence interval (CI) determined by bootstrapping. n= 391 (NV), 904 (1WV) and 494 (2WV) condensates (c) and n=181 (NV), 144 (1WV) and 130 (2WV) nuclei (d). More than 10 plants were analysed. Comparison of mean by two-way ANOVA with adjustment (Sidak’s multiple comparisons test). ns, no significance. e, f, Representative confocal immunofluorescence images of subnuclear localization of FRI–Myc (red) in NV (e) and 2WV (f) Arabidopsis root cells. Non-tagged FRI was used as a negative control. DNA was stained by DAPI (blue). Scale bars, 5 μm. g, Confocal images of Arabidopsis root tip nuclei expressing FCA–GFP after 1 week (1WV) and 2 weeks (2WV) of cold treatment. Maximum intensity projections of Z-stacks spanning the entire width of the nucleus were applied. Scale bars, 5 μm. h, i, Quantification of FCA–GFP nuclear condensate area (h) and number per nucleus (i) in root cells. An open circle indicates the median of the data and a vertical bar indicates the 95% confidence interval (CI) determined by bootstrapping. Numbers of nuclear condensates measured in (h) were 655 (NV), 839 (1WV) and 613 (2WV). Numbers of nuclei analysed in (i) were 163 (NV), 148 (1WV) and 126 (2WV). At least 10 plants in each condition were analysed. Comparison of mean by one-way ANOVA with adjustment (Sidak’s multiple comparisons test). ns, no significance Source data
Extended Data Fig. 3
Extended Data Fig. 3. FRI associates with FRL1, TAF15b and U2B′′ in nuclear condensates in vivo.
a, Confocal microscopic images of tobacco leaf nuclei with expression of FRI–mScarlet I or FRL1–mScarlet I alone or co-expression of both. Data are representative of 5 independent experiments. b, c, Quantification of FRI–mScarlet I nuclear condensate area (b) and number per nucleus (c) in tobacco leaf with or without FRL1–mScarlet I co-expressed. An open circle indicates the median of the data and a vertical bar indicates the 95% confidence interval (CI) determined by bootstrapping. Numbers of nuclear condensates measured in (b) were 204 (FRI), 0 (FRL1) and 320 (FRI+FRL1). Numbers of nuclei analysed in (c) were 15 (FRI), 16 (FRL1) and 20 (FRI+FRL1). Comparison of mean by one-way ANOVA with adjustment (Sidak’s multiple comparisons test). ns, no significance. d, Confocal microscopic images of FRI–GFP nuclear condensates in the indicated mutants. e, f, Quantification of FRI–GFP nuclear condensate area (e) and number per nucleus (f) in the indicated genotypes. An open circle indicates the median of the data and a vertical bar indicates the 95% confidence interval (CI) determined by bootstrapping. Numbers of nuclear condensates measured in (e) were (from left to right) 391, 904, 159, 437, 324, 735, 354 and 448. Numbers of nuclei analysed in (f) were (from left to right) 181, 144, 96, 105, 132, 177, 142 and 126. At least 10 plants were analysed. Comparison of mean by one-way ANOVA with adjustment (Sidak’s multiple comparisons test). ns, no significance. g, Confocal microscopic images of tobacco leaf nuclei expressing FRI–mScarlet I and TAF15b–GFP. TAF15b–GFP was driven either by its endogenous protomer or overexpressed with CSV promoter. Data are representative of 3 independent experiments. h, Immunostaining images showing relative subnuclear localization of FRI–GFP (green) to U2B′′ (red) in root cells in NV and 2WV conditions. DNA was labelled with DAPI (blue). Non-tagged FRI was used a negative control. i, j, Quantification of the total number of U2B′′ condensates per nucleus (i) and those colocalized with FRI–GFP condensates (j) in NV and 2WV conditions. An open circle indicates the median of the data and a vertical bar indicates the 95% confidence interval (CI) determined by bootstrapping. n=166 nuclei (NV) and 130 nuclei (2WV). Comparison was via two-tailed t test with Welch’s correction. ns, no significance. In all the images, scale bars, 5 μm Source data
Extended Data Fig. 4
Extended Data Fig. 4. The protein domains required for in vivo FRI condensate formation.
a, Prediction of intrinsically disordered regions in FRI protein by IUPred2A. A schematic illustration of FRI domains was shown below. DD, disordered domain, CC, coiled-coil domain and the central domain was in grey. b, Schematic illustration of full-length FRI, C-terminal disordered domain deleted FRI (FRI-DD), coiled-coil domain deleted FRI (FRI-CC) and FRI encoded in Col-0 (FRI-Col-0). The mutated amino acids in FRI-Col-0 were indicated. c, Subnuclear localization of full-length and truncated FRI–GFP in tobacco leaf nuclei. Images are representative of three independent experiments. Scale bars, 5 μm.
Extended Data Fig. 5
Extended Data Fig. 5. Stability of FRI–GFP is increased in the cold.
a, Nuclear FRI–GFP protein level in NV, 2WV and 4WV FRI–GFP transgenic plants as determined by western blots. Non-tagged FRI was used as a negative control. H3 was used as nuclear protein loading control. Data are representative of two independent experiments. For gel source data, see Supplementary Fig. 1. b, c, Confocal microscopy images of FRI–GFP in root tips of NV, 2WV and 4WV FRI–GFP transgenic plants (b) and the quantification of the fluorescence signal (c). Scale bars, 50 μm. The fluorescence intensity in cold treated samples is normalized to NV samples. Data are presented as mean ± s.e.m.; n=15 (NV), 12 (2WV) and 13 (4WV) roots. Statistical analysis was via one-way ANOVA with adjustment (Sidak’s multiple comparisons test). d, Nuclear FRI–TAP protein level in NV, 2WV and 4WV plants expressing FRI–TAP as determined by western blots. Non-tagged FRI was used as a negative control. Asterisks indicate non-specific signals. Data are representative of two independent experiments. For gel source data, see Supplementary Fig. 1. e, Confocal microscopy of Arabidopsis root tip nuclei expressing FRI–GFP in NV or 2WV plants after treated with cycloheximide (CHX) in the indicated conditions for 24 h. For example, “NV in the cold” means plants grown in NV were kept in the cold for the 24h CHX treatment. Scale bars, 5 μm. f, Quantification of nuclear fluorescence intensity in (e). The relative intensity of CHX+ to CHX- in each treatment was indicated by percentage on top. n = 136, 122, 95, 107, 144, 153, 141 and 105 root nuclei (from left to right). g, h, Box plots showing the distribution of FRI–GFP nuclear condensate area and number in (e). Numbers of nuclear condensates measured in (g) were 226, 0, 138, 46, 270, 0, 282 and 238 (from left to right) and numbers of nuclei analysed in (h) were 113, 127, 66, 80, 94, 185, 95 and 85 (from left to right). fh, At least 10 plants were analysed. Centre lines show median, box edges delineate 25th and 75th percentiles, bars extend to minimum and maximum values and ‘+’ indicates the mean value. Mean was compared by one-way ANOVA with adjustment (Sidak’s multiple comparisons test) Source data
Extended Data Fig. 6
Extended Data Fig. 6. FRI–GFP in 35S: FRI-GFP, frl1-1, flx-2 and suf4.
a, Relative transcript level of FRI mRNA in the indicated plants measured by RT–qPCR. Data are presented as mean ± s.e.m. of three independent biological replicates. Mean was compared by two-way ANOVA with adjustment (Sidak’s multiple comparisons test). ns, no significance. b, c, Total FRI–GFP protein level in the indicated plants as determined by western blots. A non-specific band (b) or ponceau staining (c) was used as loading control. Data are representative of two independent experiments. For gel source data, see Supplementary Fig. 1. d, e, Confocal microscopic images (d) and quantification of GFP fluorescence signal (e) of root tips expressing 35S: FRI-GFP. Scale bars, 50 μm. Data are presented as mean ± s.e.m., n = 13 (NV), 12 (1WV), 14 (2WV) and 14 (4WV) roots. f, Total FRI–GFP protein level in NV or 2WV 35S: FRI-GFP plants after treated with cycloheximide (CHX) in the indicated conditions for 24 h as determined by western blots. For example, “2WV in the warm” means plants after 2 weeks of cold exposure were kept in the warm condition for the 24h CHX treatment. Plants were initially grown in growth medium without glucose (see Methods) then were transferred to medium without (0%) (top) or with 1% glucose (bottom) for the 24h CHX treatment. Tubulin was used as control. Data are representative of two independent experiments. For gel source data, see Supplementary Fig. 1. g, Confocal microscopy of root tip nuclei in 35S: FRI-GFP plants (middle) with 35S: GFP (right) and NV FRI-GFP (left) as control. Maximum intensity projections of Z-stacks spanning the entire width of a nucleus were applied. Scale bars, 5 μm. Images represent 8 independent experiments. h, i, Box plots showing the distribution of FRI–GFP nuclear condensate area and number in (g). Centre lines show median, box edges delineate 25th and 75th percentiles, bars extend to minimum and maximum values and ‘+’ indicates the mean value. n = 114, 1185, 1543, 1276 and 1412 nuclear condensates in (h) and 262, 222, 205, 207 and 216 root nuclei in (i) (from left to right) were analysed. Comparison of mean was via one-way ANOVA with adjustment (Sidak’s multiple comparisons test). ns, no significance. j, Expression of FRI-GFP in NV plants with the indicated genotype, measured by RT–qPCR. Data are presented as mean ± s.e.m. of three independent biological replicates. One-way ANOVA was used for statistical analysis and P value was adjusted by Sidak’s multiple comparisons test. ns, no significance. k, Representative confocal microscopic images of FRI–GFP root tips in 2WV plants with the indicated backgrounds. Scale bars, 50 μm. l, Quantification of the fluorescence intensity in (k). Data are represented as mean ± s.e.m., n = 14 (WT), 13 (frl1-1), 13 (flx-2) and 12 (suf4) roots. One-way ANOVA was used for statistical analysis and P value was adjusted by Dunnett’s multiple comparisons test. ns, no significance Source data
Extended Data Fig. 7
Extended Data Fig. 7. FRI occupancy on the FLC promoter is reduced in the cold and correlates with FLC transcriptional shutdown.
a, b, Spatial expression patterns of a translational FLC-GUS reporter in aerial parts (a) and root tips (b) of NV and 6WV plants in fri and FRI backgrounds. Scale bars, 1 mm (a) and 100 μm (b). Data represents two independent experiments. c, Schematic illustration of FLC and COOLAIR transcripts at the FLC locus. Untranslated regions (UTR) are indicated by grey boxes and exons by black boxes. kb, kilobase. d, FRI–GFP was detected after immunoprecipitation by western blots in ChIP experiments. Ponceau staining was used as the loading control. Data are representative of three independent experiments. For gel source data, see Supplementary Fig. 1. e, f, FRI–GFP ChIP across the FLC locus (e), STM and ACT locus (f) in plants expressing FRI–GFP. Non-tagged FRI was used as negative control. The exact distance from TSS referred to (c). Data are represented as mean ± s.d. of three independent biological experiments with two technical repeats. Two-way ANOVA was performed with P values adjusted by Sidak’s multiple comparisons test. g, Unspliced FLC transcript level in NV and 2WV plants with the indicated backgrounds, measured by RT–qPCR. Data are presented as mean ± s.e.m. of three biologically independent experiments. h, Representative images of nuclei expressing FRI–GFP (green) sequentially hybridized with intronic smFISH probes for COOLAIR (red). DNA was labelled with DAPI (blue). n= 327 cells. Scale bars, 5 μm. i, j, Relative transcript level of unspliced FLC and spliced FLC in the indicated plants measured by RT–qPCR. Data were presented as mean ± s.e.m. of three independent biological replicates. Two-way ANOVA was performed with P values adjusted by Sidak’s multiple comparisons test. k, l, Relative transcript level of FRI mRNA and unspliced FLC in NV and 2WV plants with the indicated genotype, measured by RT–qPCR. Data were presented as mean ± s.e.m. of three biologically independent experiments (k) and with two technical repeats (l). Two-way ANOVA was performed with P values adjusted by Sidak’s multiple comparisons test. m, FLC transcriptional shutdown rate indicated by -Slope by Linear Regression of unspliced FLC in (l). Mean ± s.e.m., n=6 replicates over 3 biologically independent experiments. P value was through two-tailed t test with Welch’s correction Source data
Extended Data Fig. 8
Extended Data Fig. 8. FRI–GFP nuclear condensate dynamics change in response to short-term temperature fluctuations.
a, b, Quantification of FRI–GFP nuclear condensate area (a) and number per nucleus (b) in WT and TEX root cells after 0, 6 and 12 h of cold treatment in Fig. 2a. Comparisons between 12 h of cold treatment (12H) and 2WV (same data shown in Extended Data Fig. 2c, d) were presented on the right. An open circle indicates the median of the data and a vertical bar indicates the 95% confidence interval (CI) determined by bootstrapping. n = 114, 380, 505, 180, 218, 346, 505 and 494 nuclear condensates in (a) and 262, 291, 303, 214, 205, 292, 303 and 130 root nuclei in (b) (from left to right). c, Fold change on Unspliced FLC transcript level in NV plants after transferred in cold for 12 h (12H) and 2 weeks (2WV) compared to NV. d, e, Quantification of FRI–GFP nuclear condensate area (d) and number per nucleus (e) in 2WV wildtype root cells after they were returned to warm for 0, 6, 12 and 24 h in Fig. 2c. An open circle indicates the median of the data and a vertical bar indicates the 95% confidence interval (CI) determined by bootstrapping. Numbers of nuclear condensates measured in (d) were 494 (0), 223 (6), 228 (12) and 292 (24) and numbers of root nuclei analysed in (e) were 130 (0), 109 (6), 152 (12) and 95 (24). At least 10 plants were analysed for each treatment. a-e, One-way ANOVA was performed with P values adjusted by Sidak’s multiple comparisons test. ns, no significance. f, Confocal images of 2WV Arabidopsis leaf petiole nuclei expressing FRI–GFP (green) (left) and after transferred to warm conditions for 6 h (right). Maximum intensity projections of Z-stacks spanning the entire width of the nucleus were applied. Autofluorescence was unmixed with lambda mode (blue) (see Methods). Scale bars, 10 μm. Data are representative of three independent experiments. g, Confocal microscopy of Arabidopsis root tip nuclei expressing FRI–GFP after treated with MG132 in the indicated conditions for 6 h. Plants were exposed to 1 week of cold before (left). Scale bars, 5 μm. h, Quantification of nuclear fluorescence intensity in (g). Fluorescence intensity was normalized to control. n=127, 122 and 166 root nuclei. i, j, Box plot showing the distribution of FRI–GFP nuclear condensate area and number in (g). n= 227, 139 and 355 nuclear condensates in (i) and 81, 60 and 116 root nuclei in (j) (from left to right). hj, Centre lines show median, box edges delineate 25th and 75th percentiles, bars extend to minimum and maximum values and ‘+’ indicates the mean value. k, Fold change of Unspliced FLC expression level in 2WV plants after transferred in warm for 24 h (24H) and 10 days (10D) compared to NV. hk, One-way ANOVA was performed with P values adjusted by Sidak’s multiple comparisons test. ns, no significance. l, m, Time-lapse microscopy of 1WV Arabidopsis root-tip nuclei expressing FRI–GFP after transfer to warm temperature (l) or return to cold temperature after a 3-hour warm spike (m). For each microscopic image maximum intensity projections of Z-stacks spanning the entire width of the nucleus were applied. Scale bars, 5 μm. Data are representative of two independent experiments. n, o, Quantitative measurement of the area (n) and number (o) of FRI–GFP nuclear condensates with an area ≥0.03 μm2 at each time point for the time-lapse experiment related to (m) and Supplementary Video 2. Data are represented as mean ± s.e.m., n = 22 nuclei. p, Confocal microscopic images of tobacco leaf nuclei expressing FRI–GFP and FRL1–mScarlet I before and after 24 h cold. Maximum intensity projections of Z-stacks spanning the entire width of the nucleus were applied. Scale bars, 5 μm. Three independent experiments gave similar results. q, r, Quantification of FRI–GFP nuclear condensate area (q) and number per nucleus (r) in tobacco leaf nuclei before and after 24 h of cold exposure. An open circle indicates the median of the data and a vertical bar indicates the 95% confidence interval (CI) determined by bootstrapping. n = 398 (warm) and 353 (cold) nuclear condensates (q) and 17 (warm) and 13 (cold) tobacco leaf nuclei (r). Two-tailed t test with Welch’s correction. ns, no significance Source data
Extended Data Fig. 9
Extended Data Fig. 9. The association of FRI and COOLAIR is disturbed in FRI-complex mutants.
ac, Relative transcript level of spliced COOLAIR isoforms in NV and 2WV plants with the indicated genotype, measured by RT–qPCR. Data are presented as mean ± s.e.m. of three independent biological replicates. df, Fold change of spliced COOLAIR expression in 2WV plants relative to NV plants in the indicated backgrounds. Fold change of Class II.ii in 12 h cold treated plants (12H) relative to NV was compared to 2WV on the right in (f). Data are presented as mean ± s.e.m. of three independent biological replicates. One-way ANOVA was performed with P values adjusted by Sidak’s multiple comparisons test. ns, no significance. g, Schematic illustration of FLC and COOLAIR transcripts at the FLC locus. Untranslated regions (UTR) are indicated by grey boxes and exons by black boxes. kb, kilobase. h, RNA-IP assay of unspliced COOLAIR enriched by FRI–GFP in NV and 2WV plants. COOLAIR enrichment in FRI–GFP is normalized to non-tagged FRI. Data are presented as mean ± s.e.m. of three independent biological replicates. Although there are differences of the fold enrichment between NV and 2WV samples, no statistical significance was detected (two-way ANOVA). Class II.ii was shown as control. Amplicons for unspliced COOLAIR are shown in (g) by blue bars. i, RNA-IP assay of spliced COOLAIR enriched by FRI–GFP in 2WV plants in WT and frl1-1 backgrounds with UBC as control. Data are presented as mean ± s.e.m. of three independent biological replicates. Two-way ANOVA with adjustment by Sidak’s multiple comparisons test. ns, no significance. j, k, Quantification of FRI–GFP nuclear condensate area (j) and number per nucleus (k) in root cells in Fig. 3e. An open circle indicates the median of the data and a vertical bar indicates the 95% confidence interval (CI) determined by bootstrapping. Numbers of nuclear condensates measured in (j) were 114 (NV-WT), 142 (NV-TEX), 435 (2WV-WT) and 500 (2WV-TEX). Numbers of nuclei analysed in (k) were 262 (NV-WT), 214 (NV-TEX), 199 (2WV-WT) and 293 (2WVV-TEX). At least 10 plants were analysed for each treatment. One-way ANOVA with adjustment by Sidak’s multiple comparisons test. ns, no significance. l, Representative confocal microscopic images of FRI–GFP root tips in 2WV WT and TEX plants. Scale bars, 50 μm. m, Quantification of the fluorescence intensity in (l). Data are represented as mean ± s.e.m., n=10 (WT) and 11 (TEX) roots. Two-tailed t test with Welch’s correction Source data

Comment in

References

    1. Yang H, et al. Distinct phases of Polycomb silencing to hold epigenetic memory of cold in Arabidopsis. Science. 2017;357:1142–1145. doi: 10.1126/science.aan1121. - DOI - PubMed
    1. Buzas DM, Robertson M, Finnegan EJ, Helliwell CA. Transcription-dependence of histone H3 lysine 27 trimethylation at the Arabidopsis polycomb target gene FLC. Plant J. 2011;65:872–881. doi: 10.1111/j.1365-313X.2010.04471.x. - DOI - PubMed
    1. Hepworth J, et al. Absence of warmth permits epigenetic memory of winter in Arabidopsis. Nat. Commun. 2018;9:639–639. doi: 10.1038/s41467-018-03065-7. - DOI - PMC - PubMed
    1. Antoniou-Kourounioti RL, et al. Temperature sensing is distributed throughout the regulatory network that controls FLC epigenetic silencing in vernalization. Cell Syst. 2018;7:643–655. doi: 10.1016/j.cels.2018.10.011. - DOI - PMC - PubMed
    1. Csorba T, Questa JI, Sun Q, Dean C. Antisense COOLAIR mediates the coordinated switching of chromatin states at FLC during vernalization. Proc. Natl Acad. Sci. USA. 2014;111:16160–16165. doi: 10.1073/pnas.1419030111. - DOI - PMC - PubMed

Publication types