. 2021 Nov;599(7885):436-441.
doi: 10.1038/s41586-021-04088-9. Epub 2021 Nov 3.

MC3R links nutritional state to childhood growth and the timing of puberty

Affiliations

MC3R links nutritional state to childhood growth and the timing of puberty

B Y H Lam et al. Nature. 2021 Nov.

Abstract

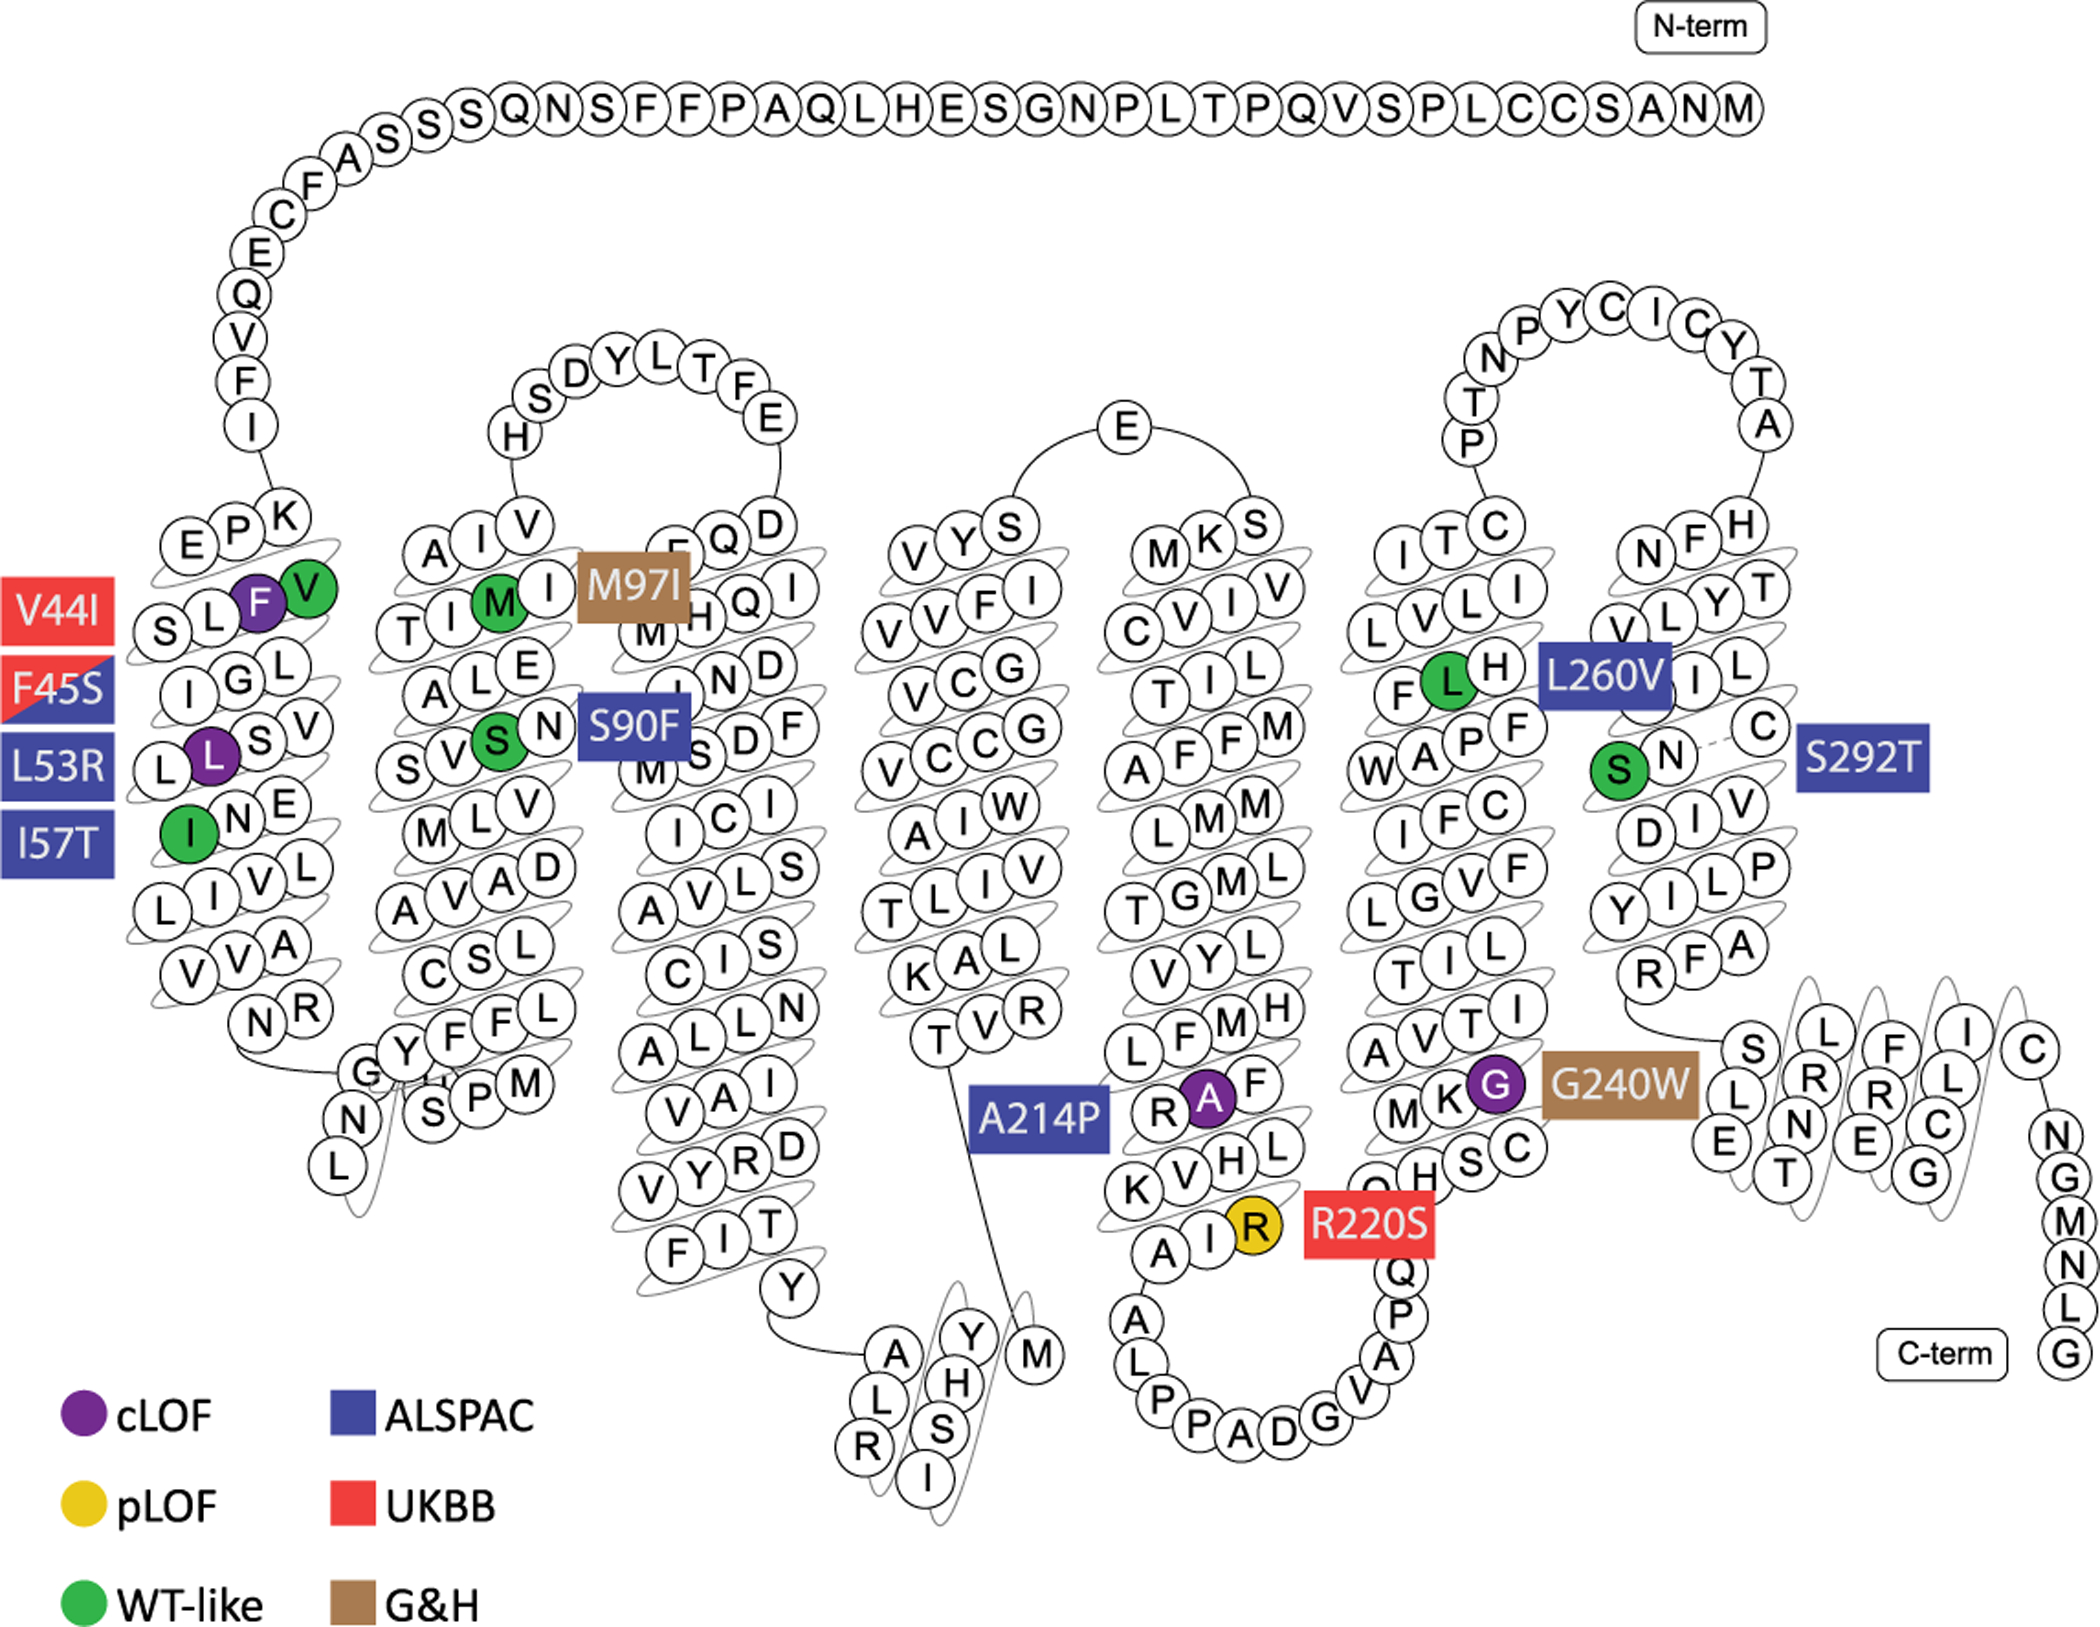
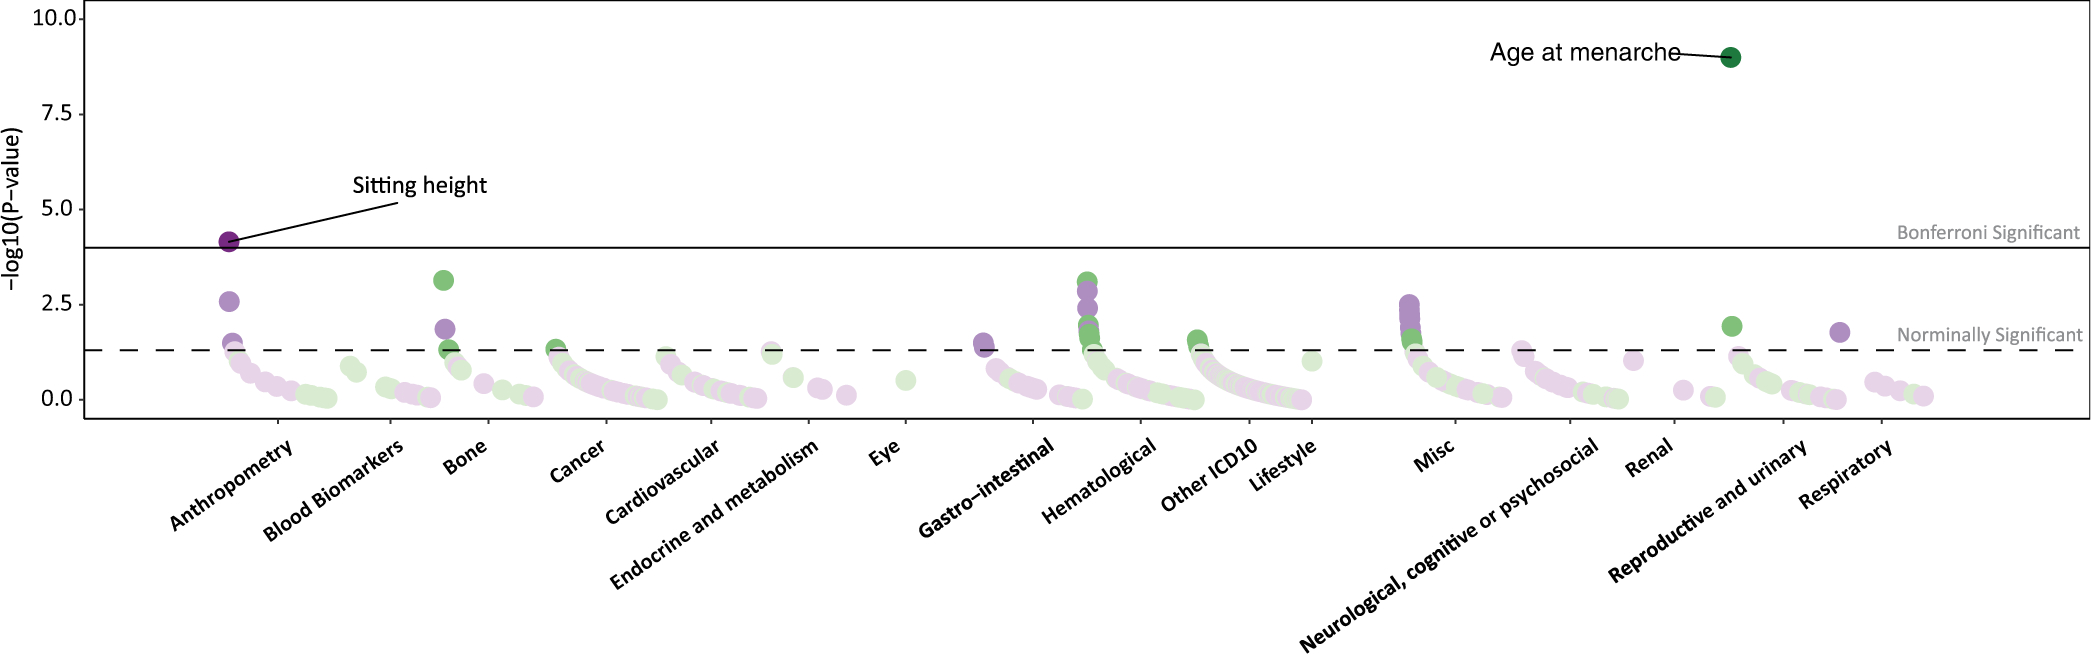
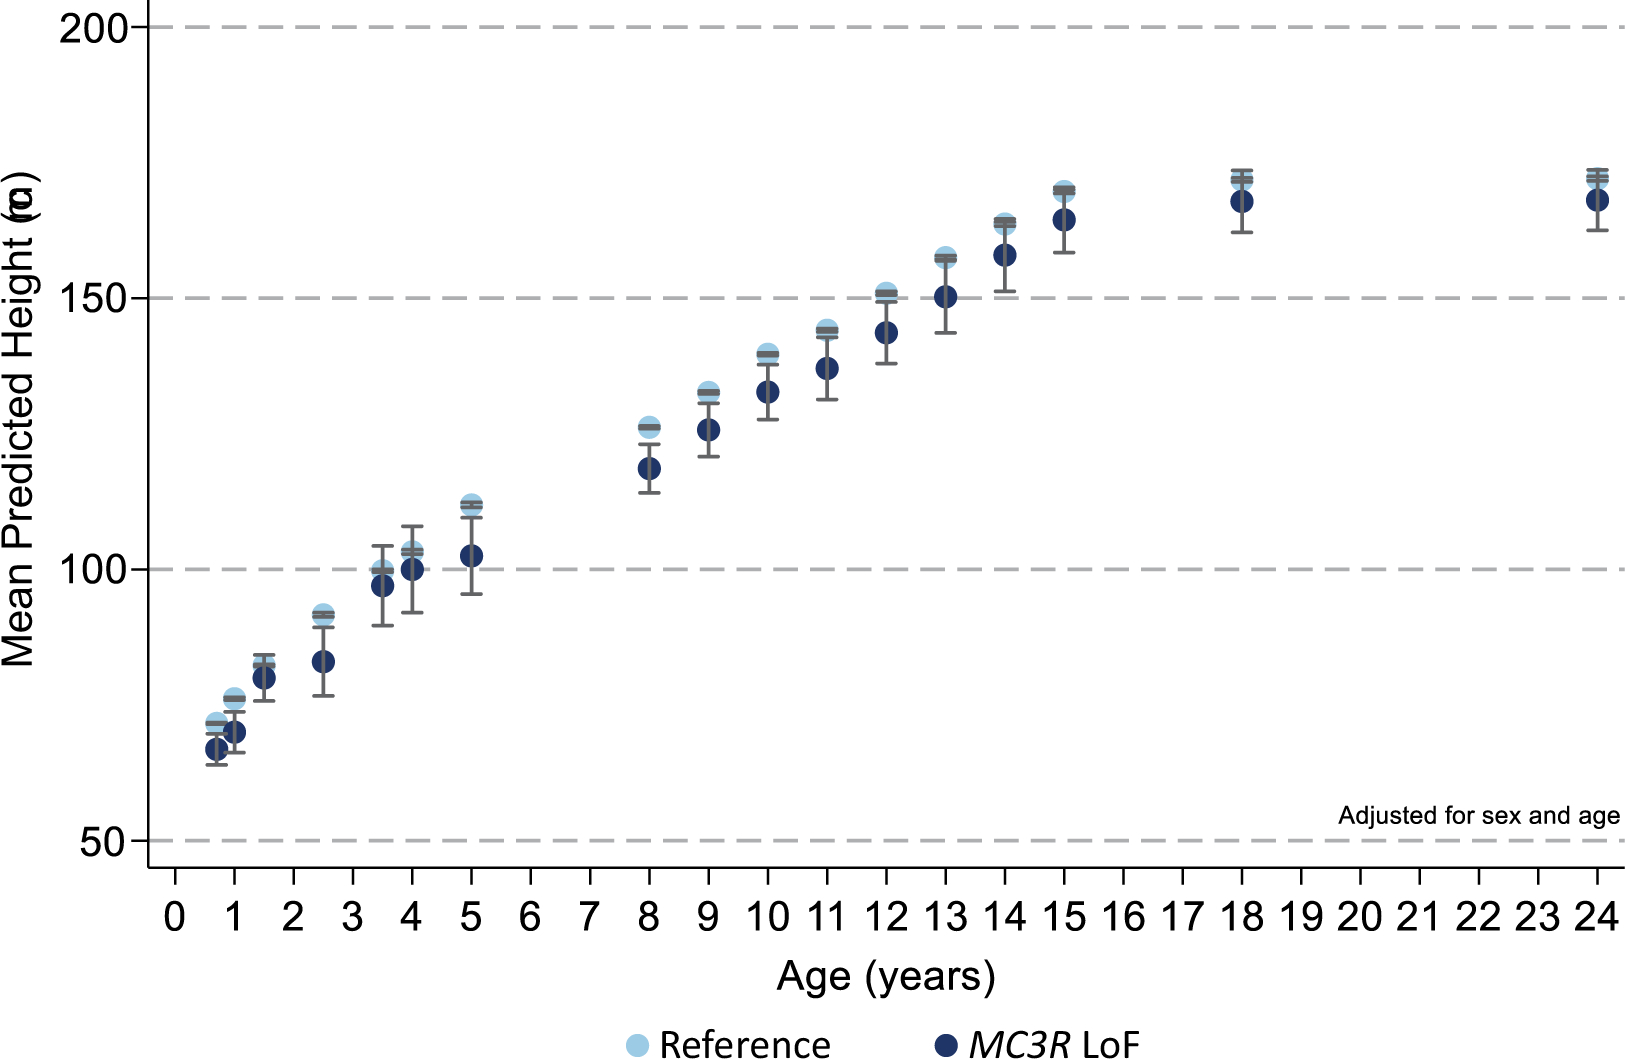
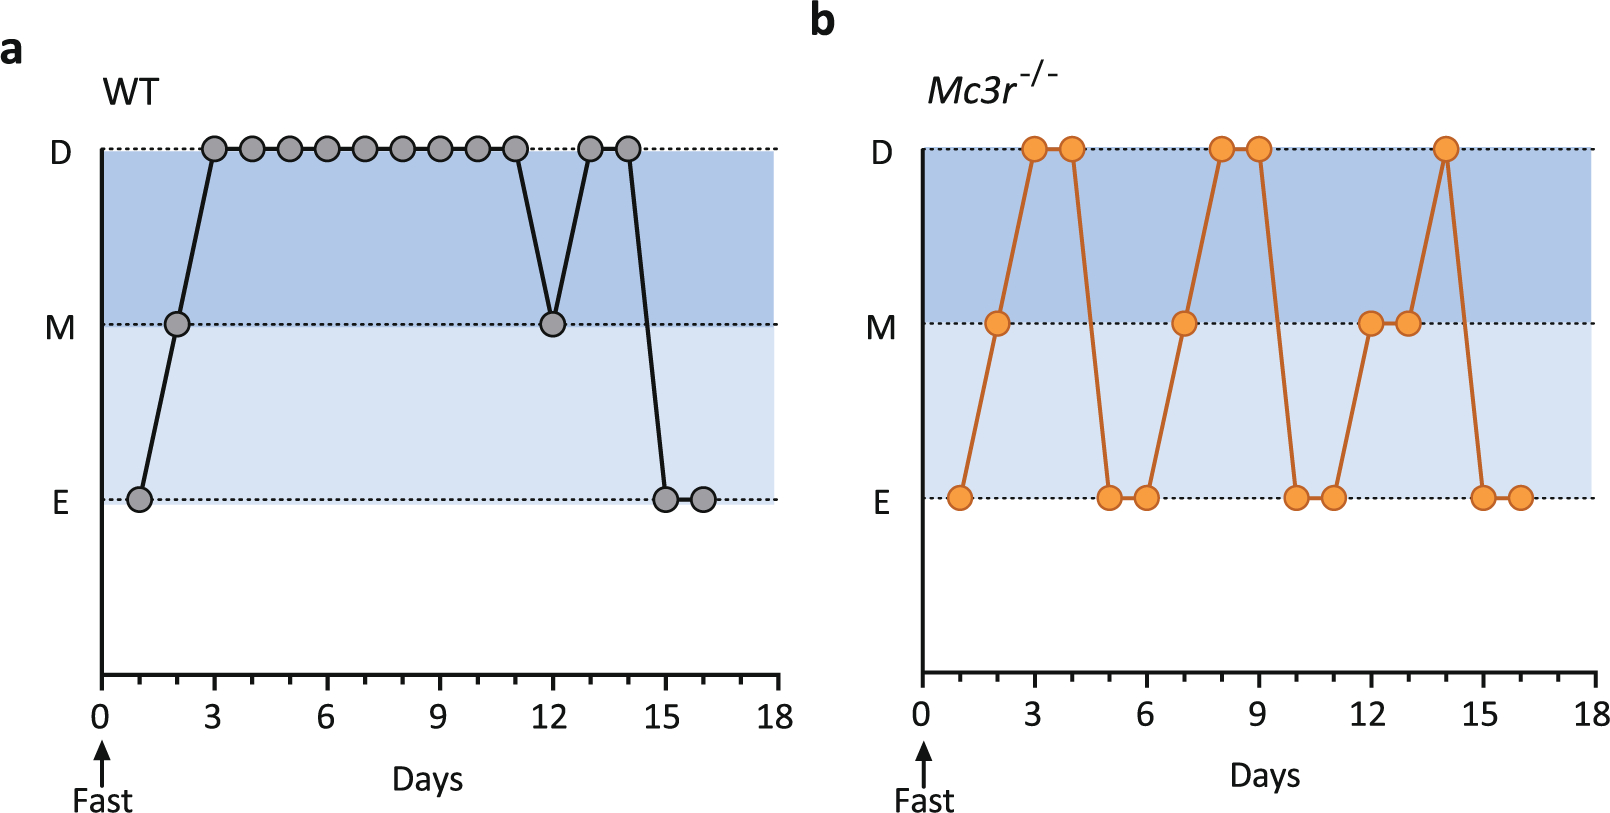
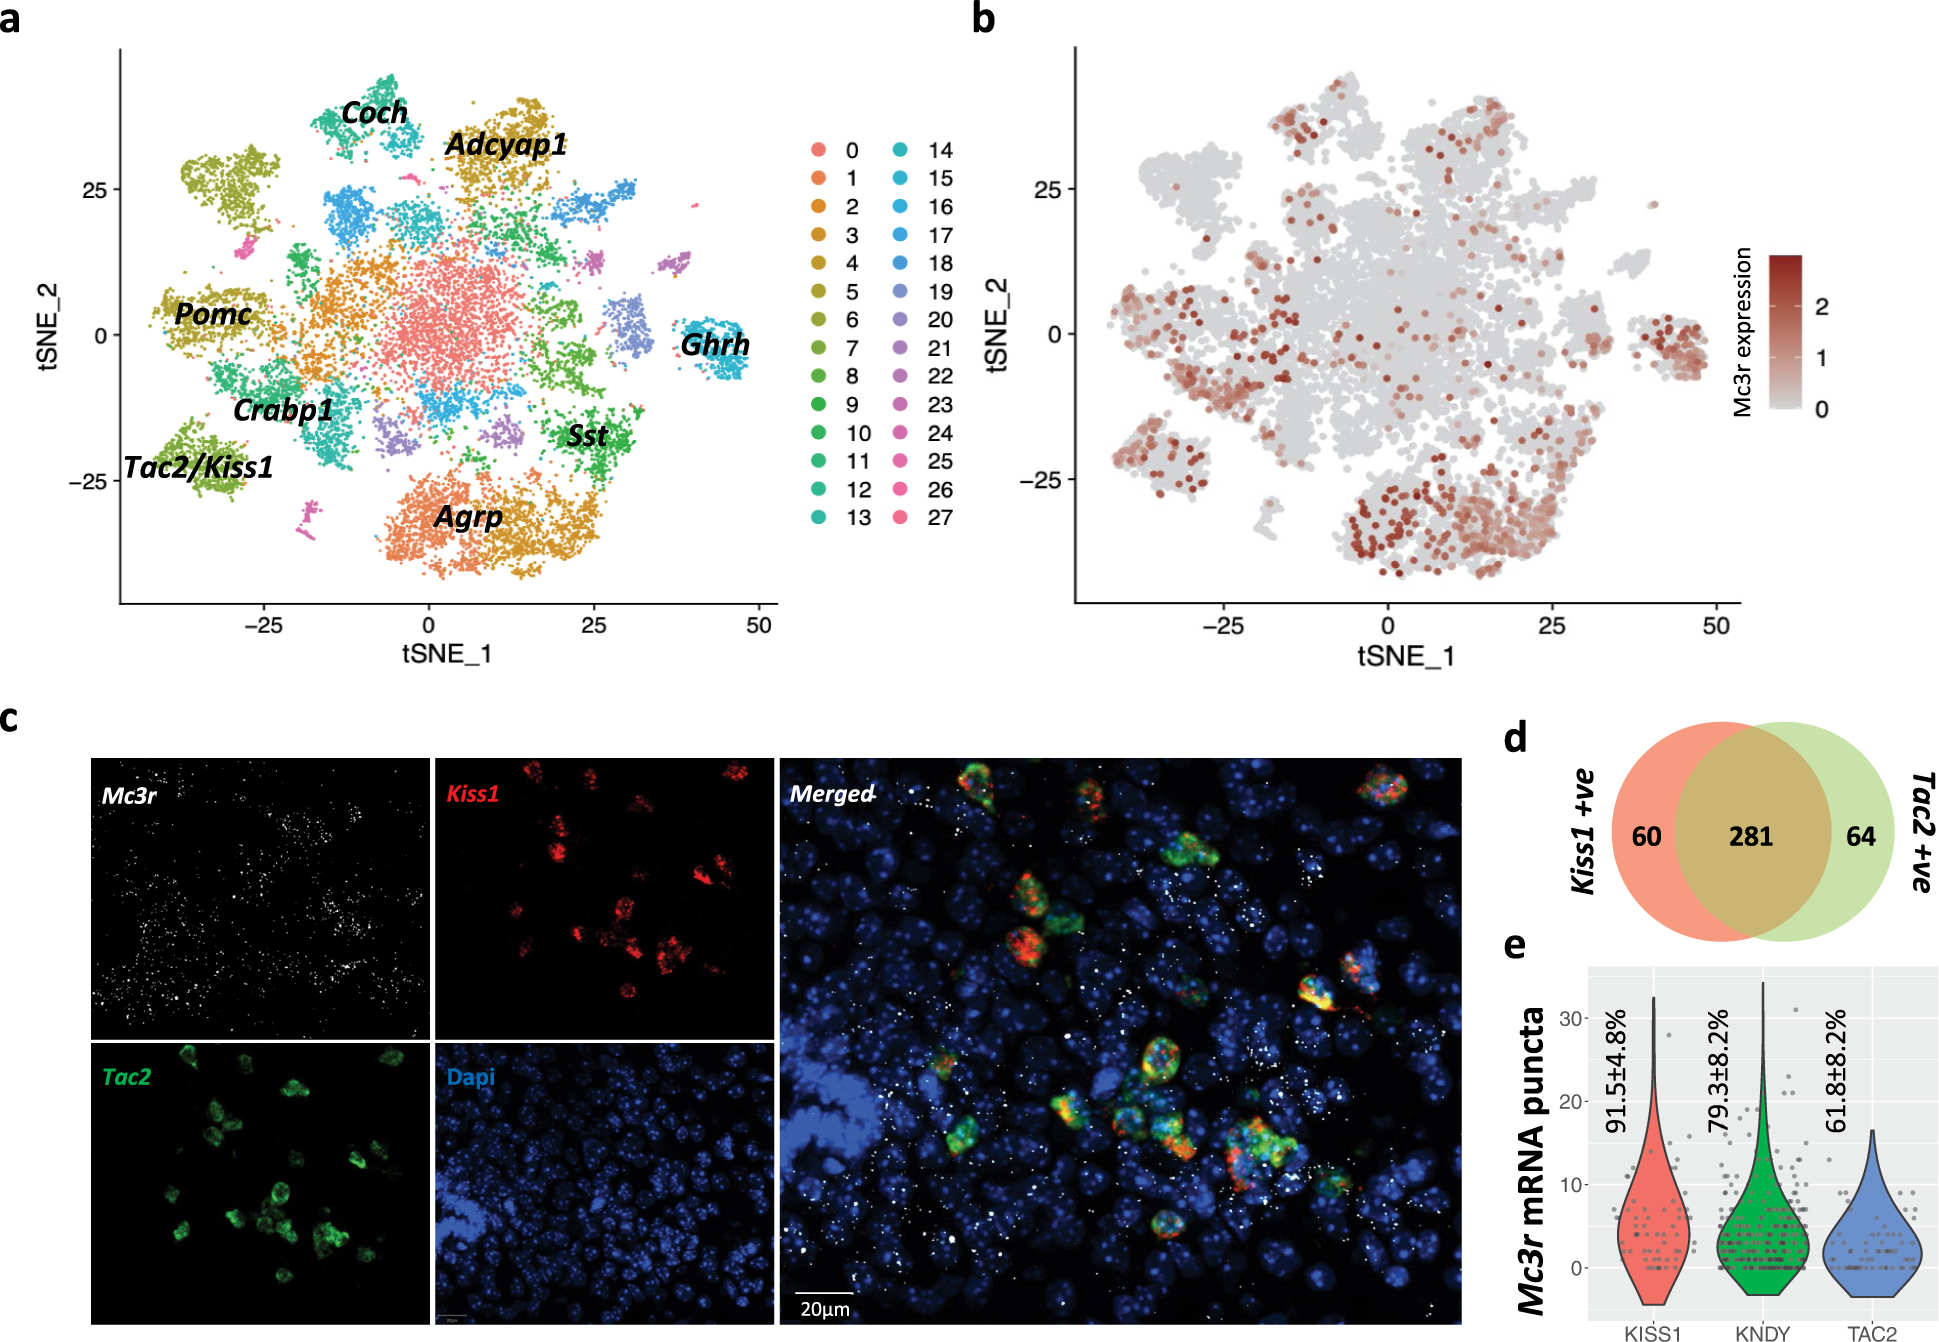
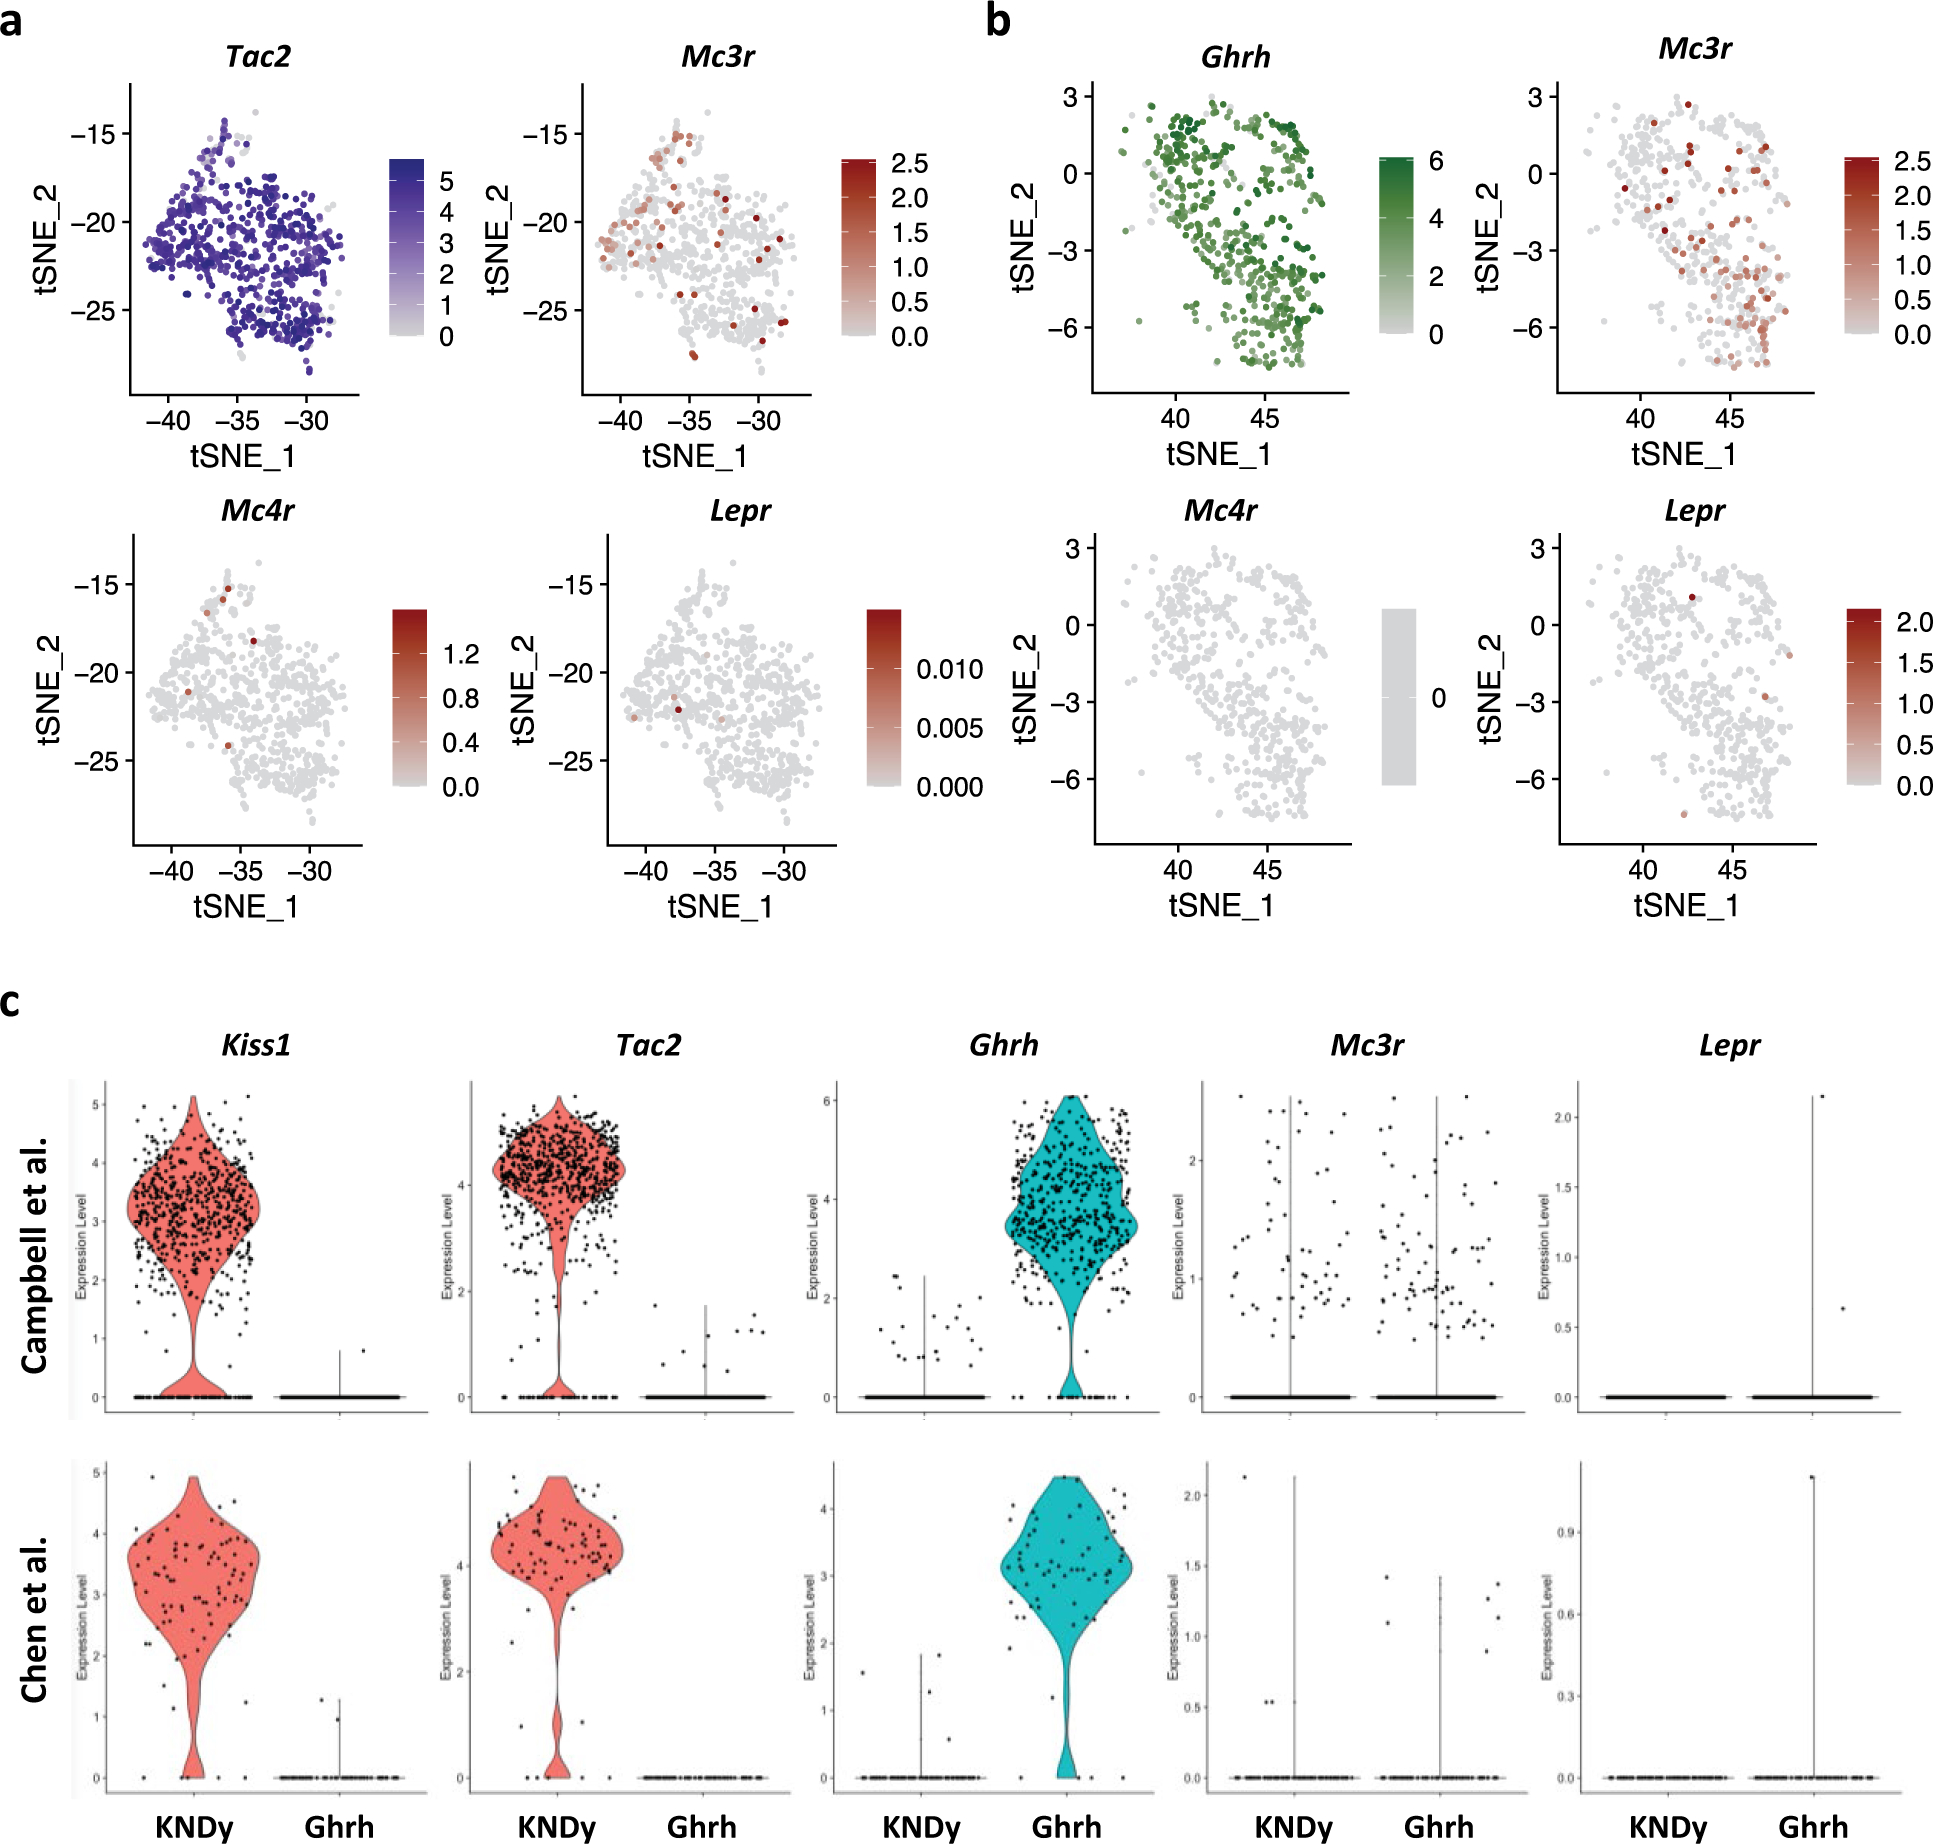
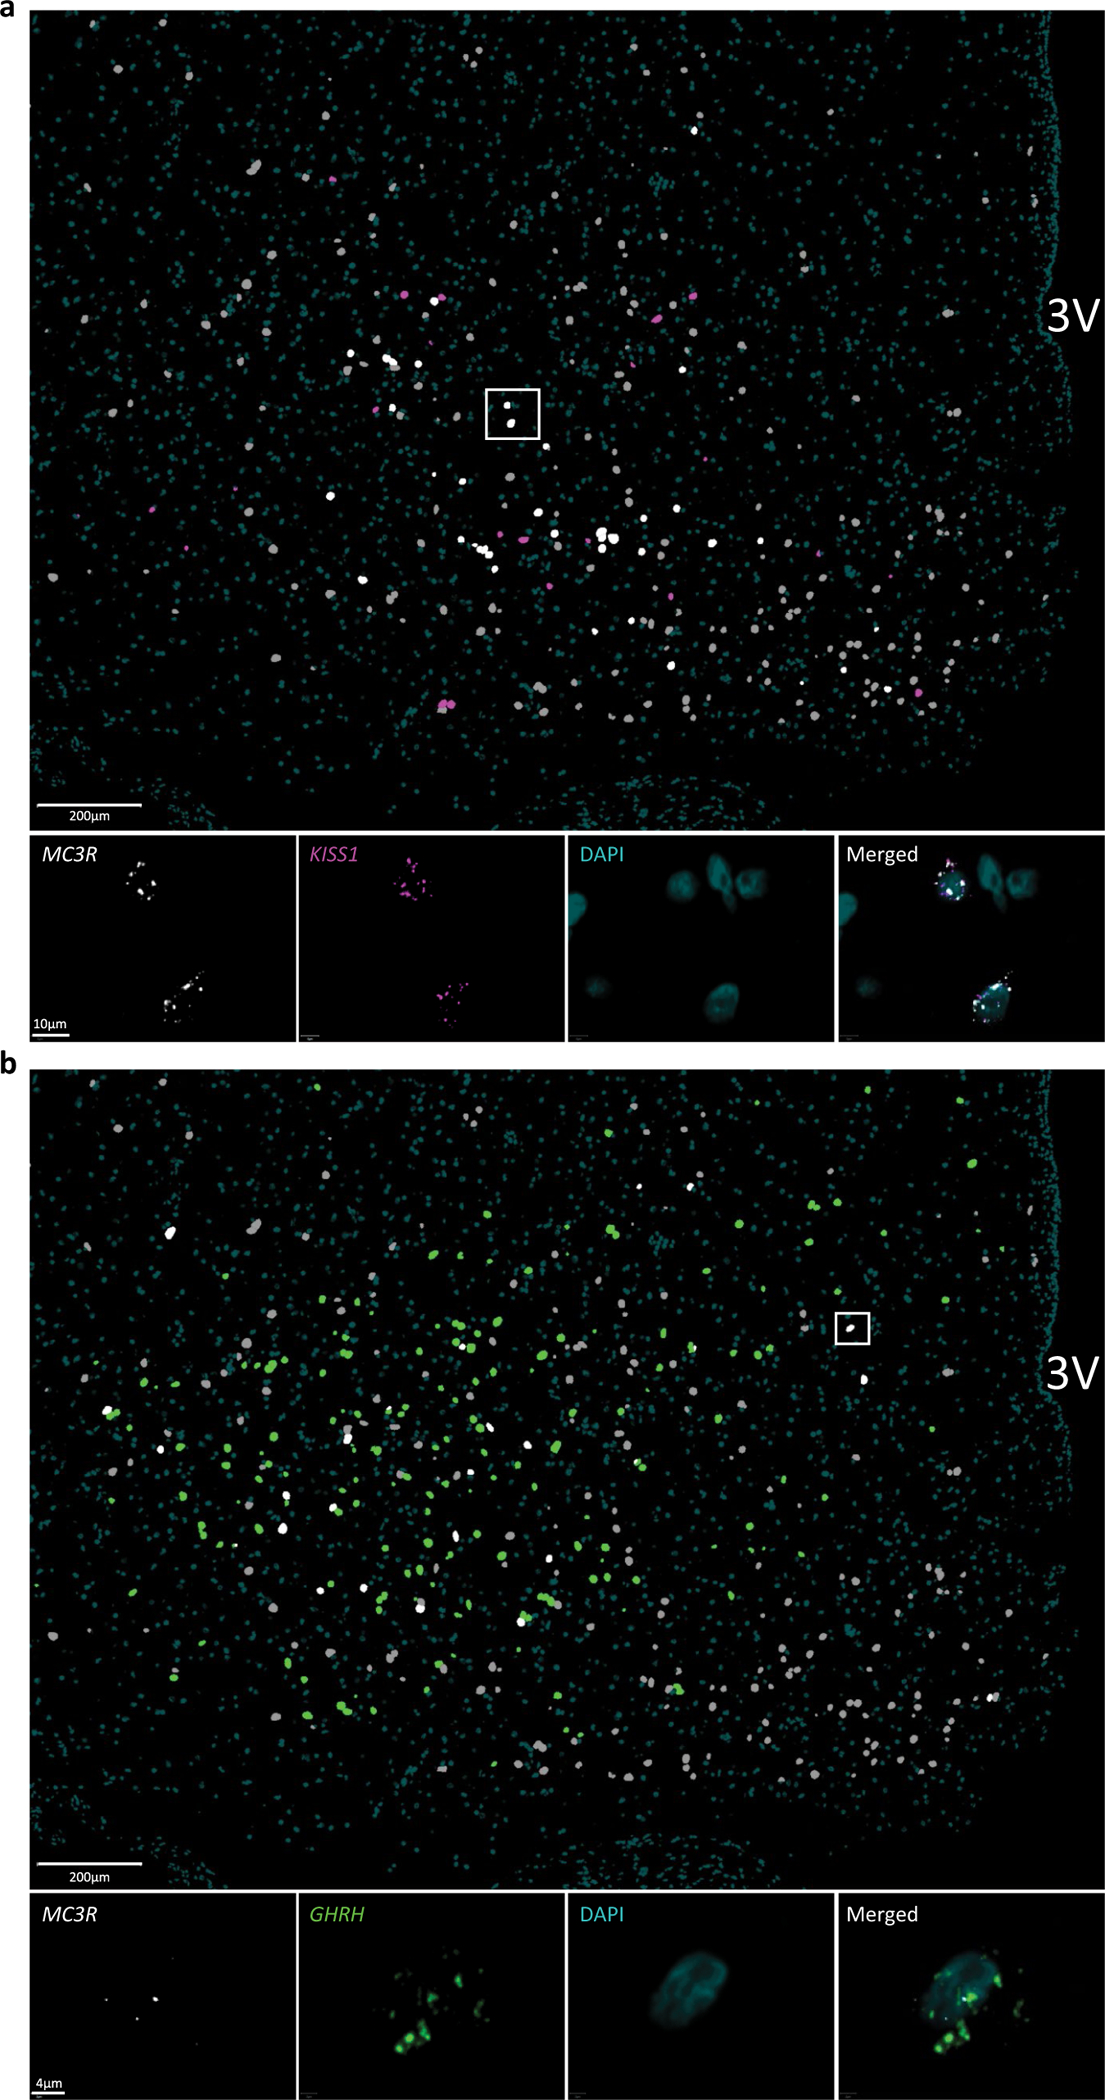
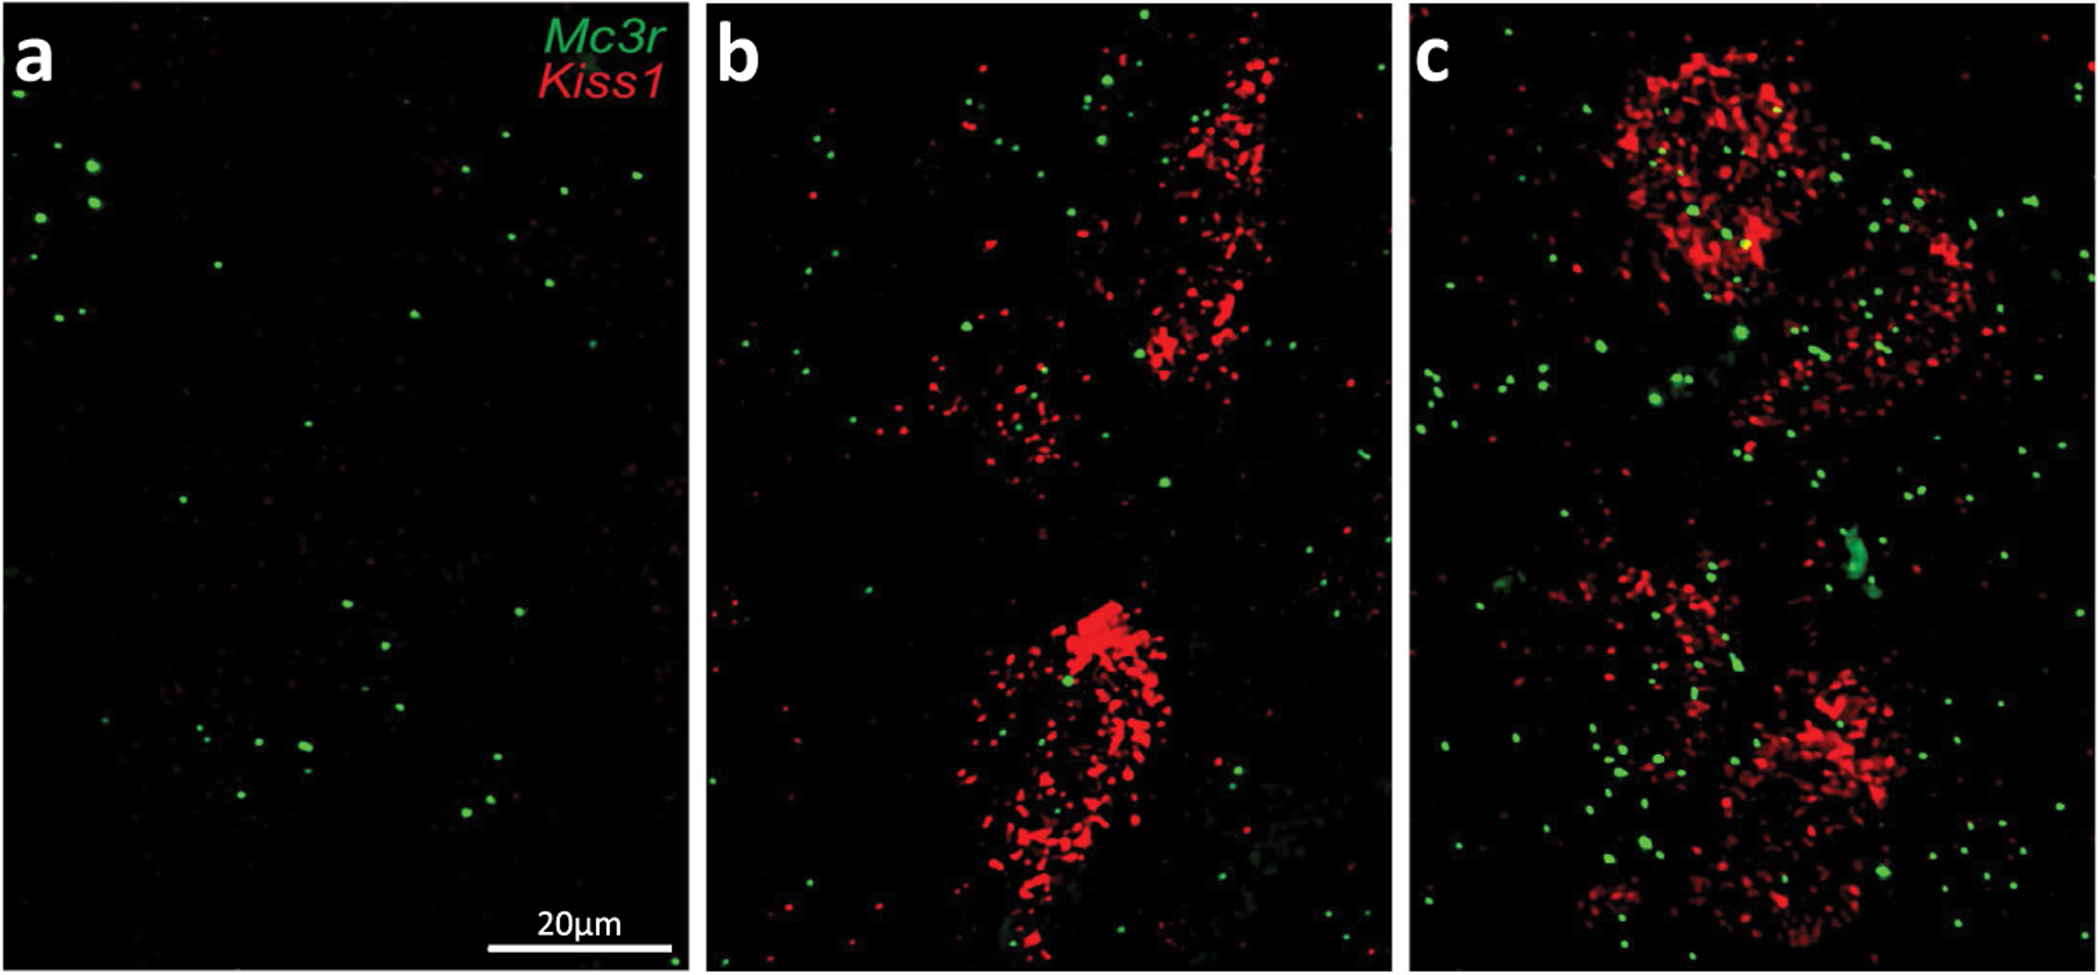
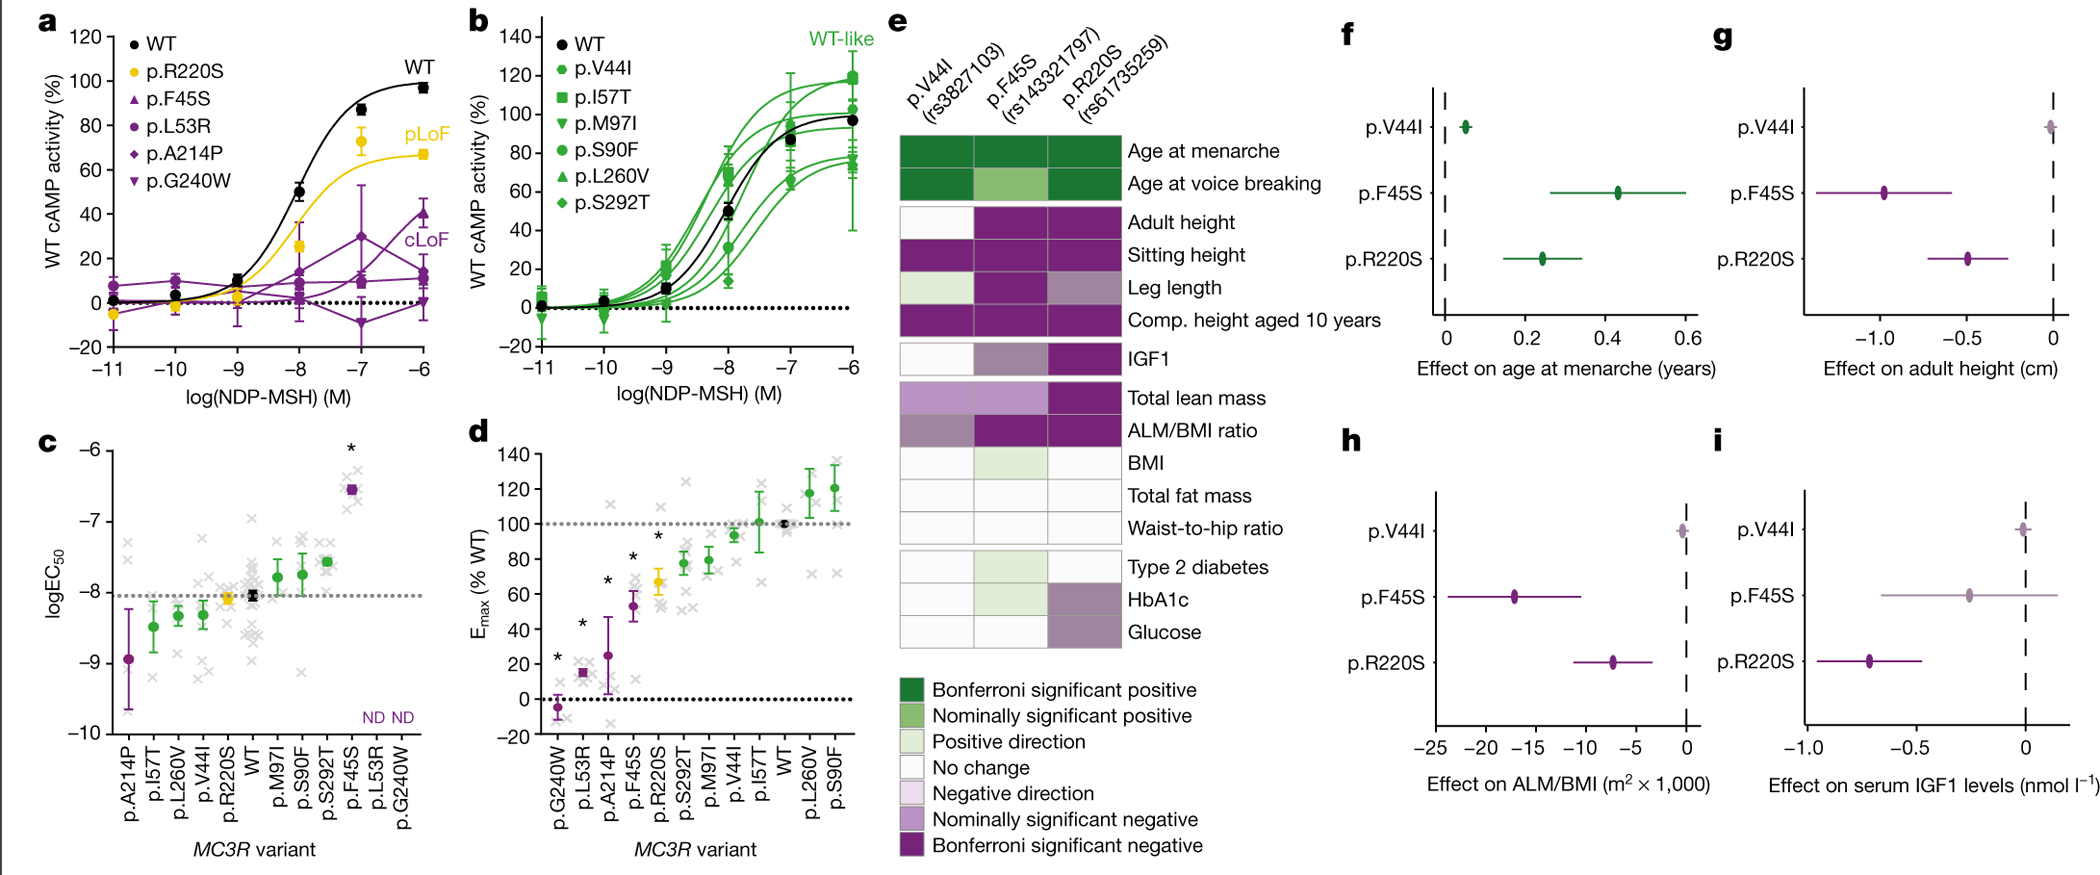
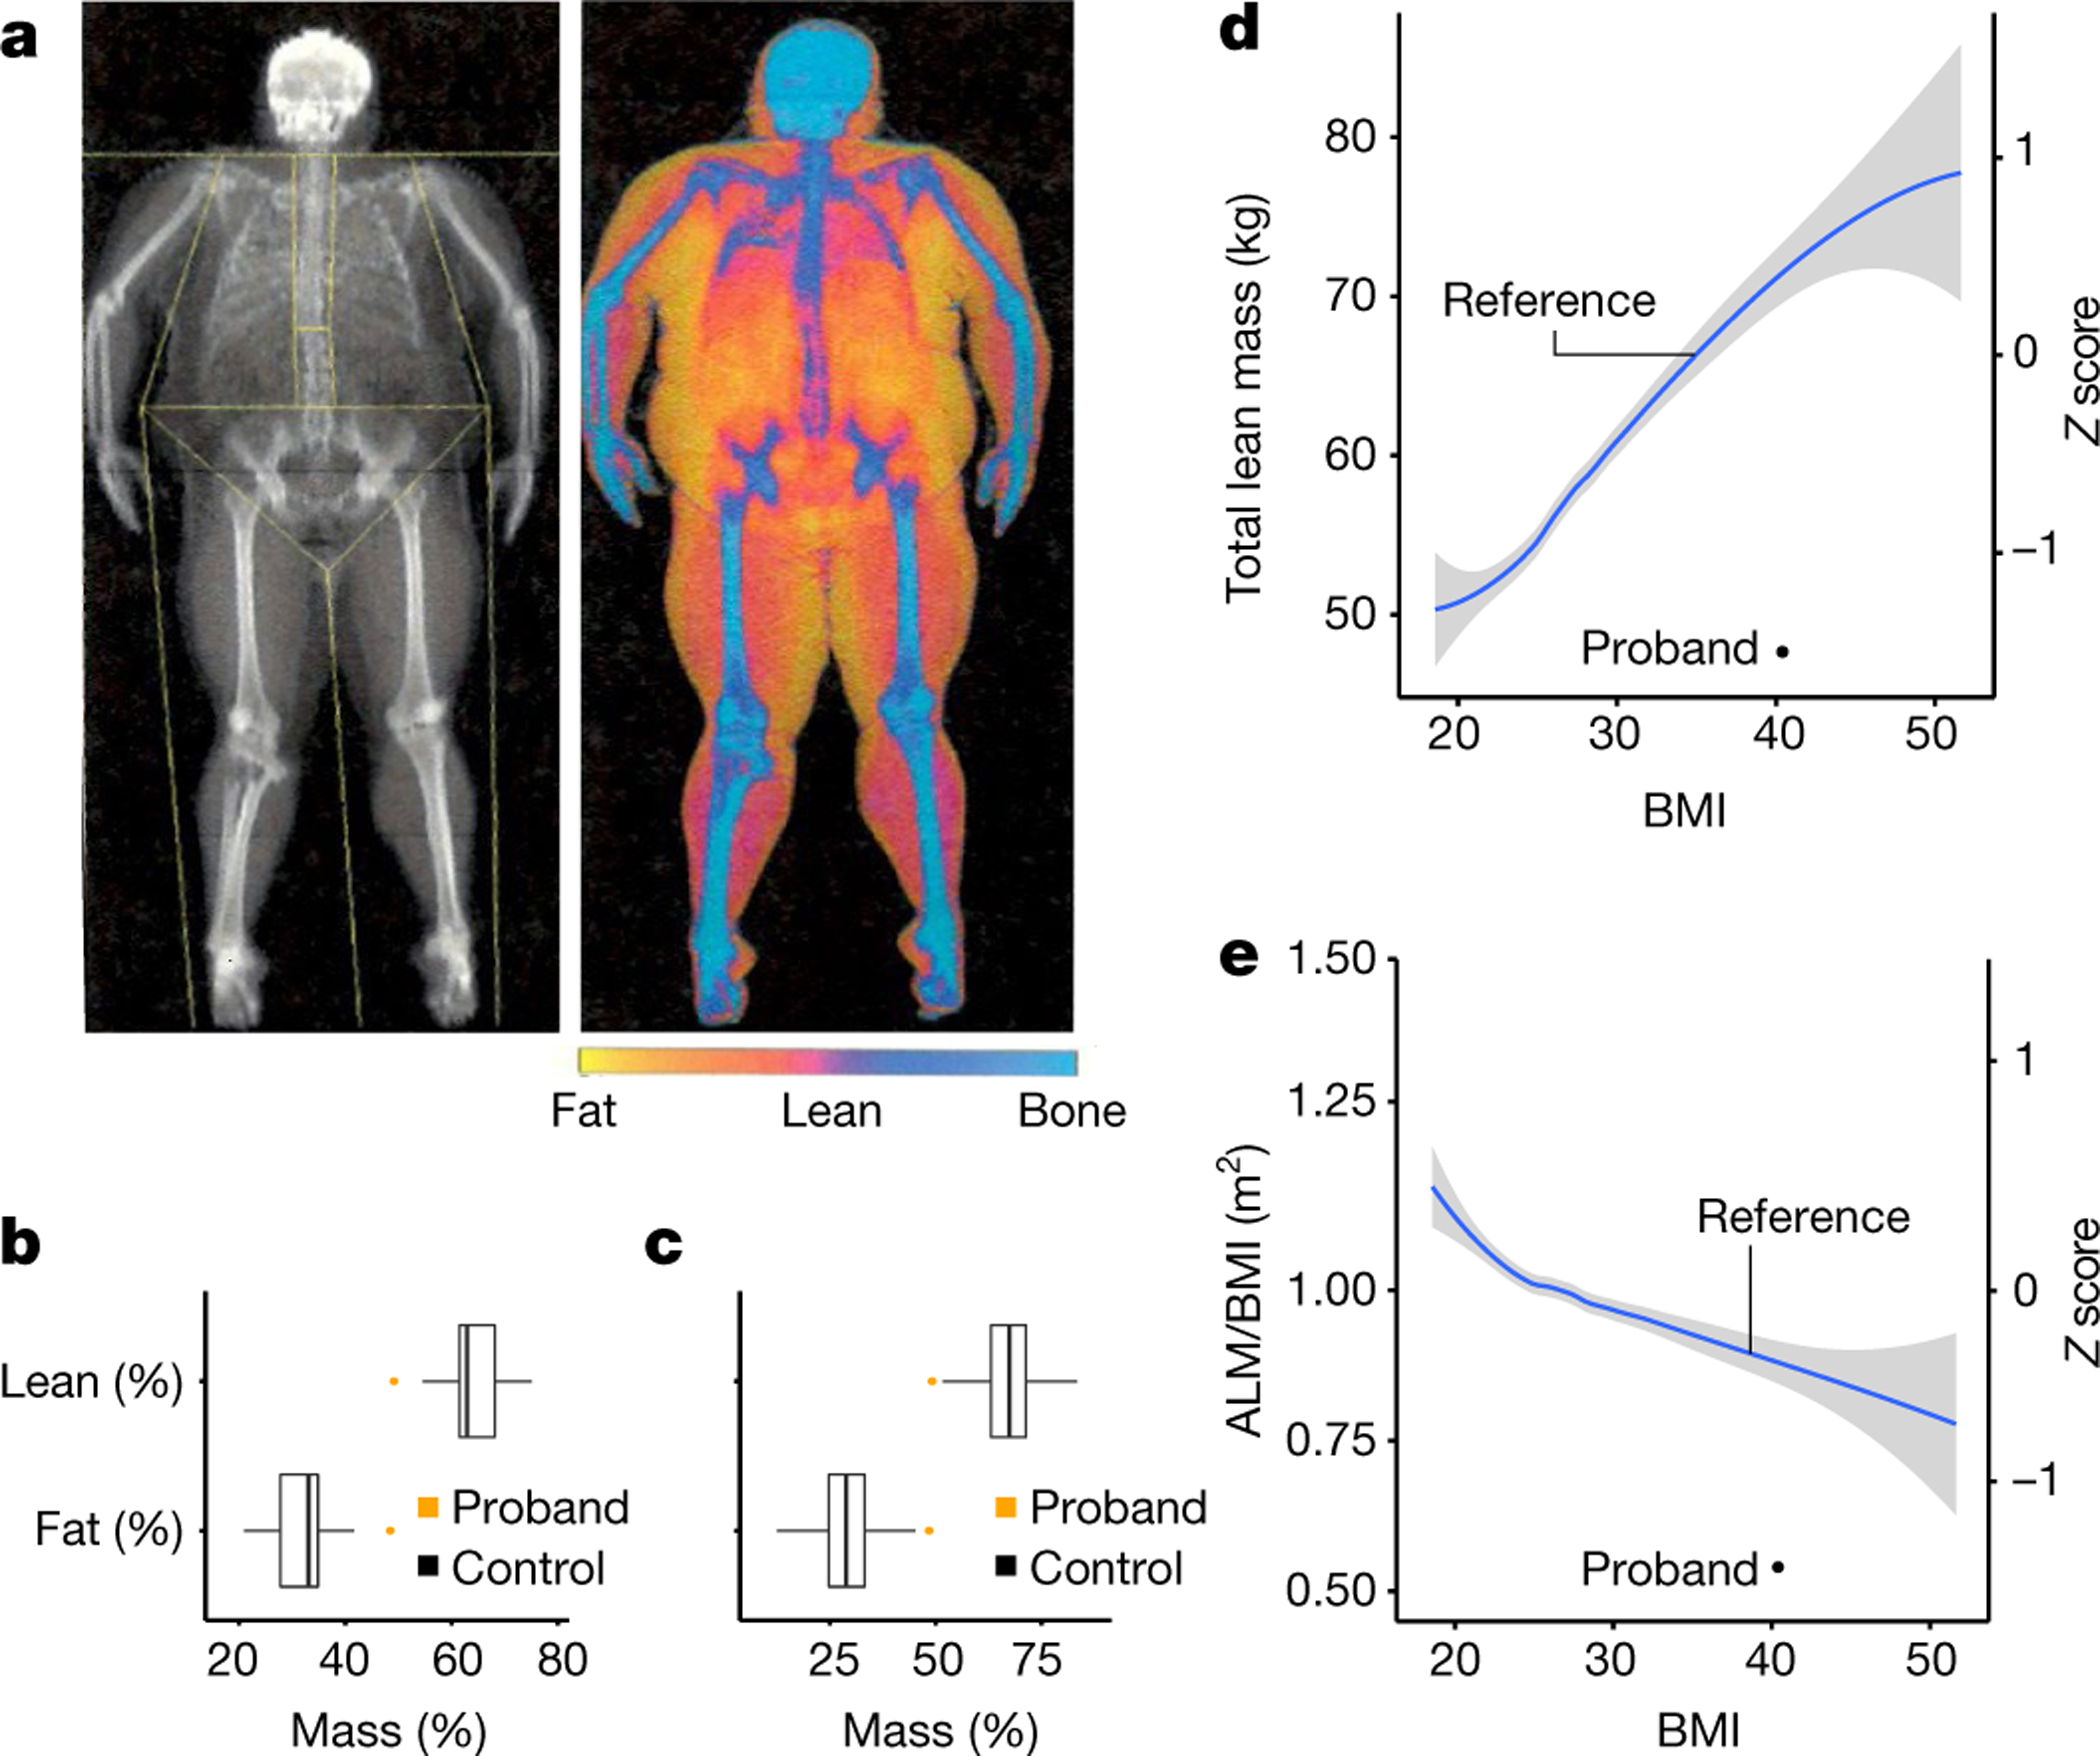
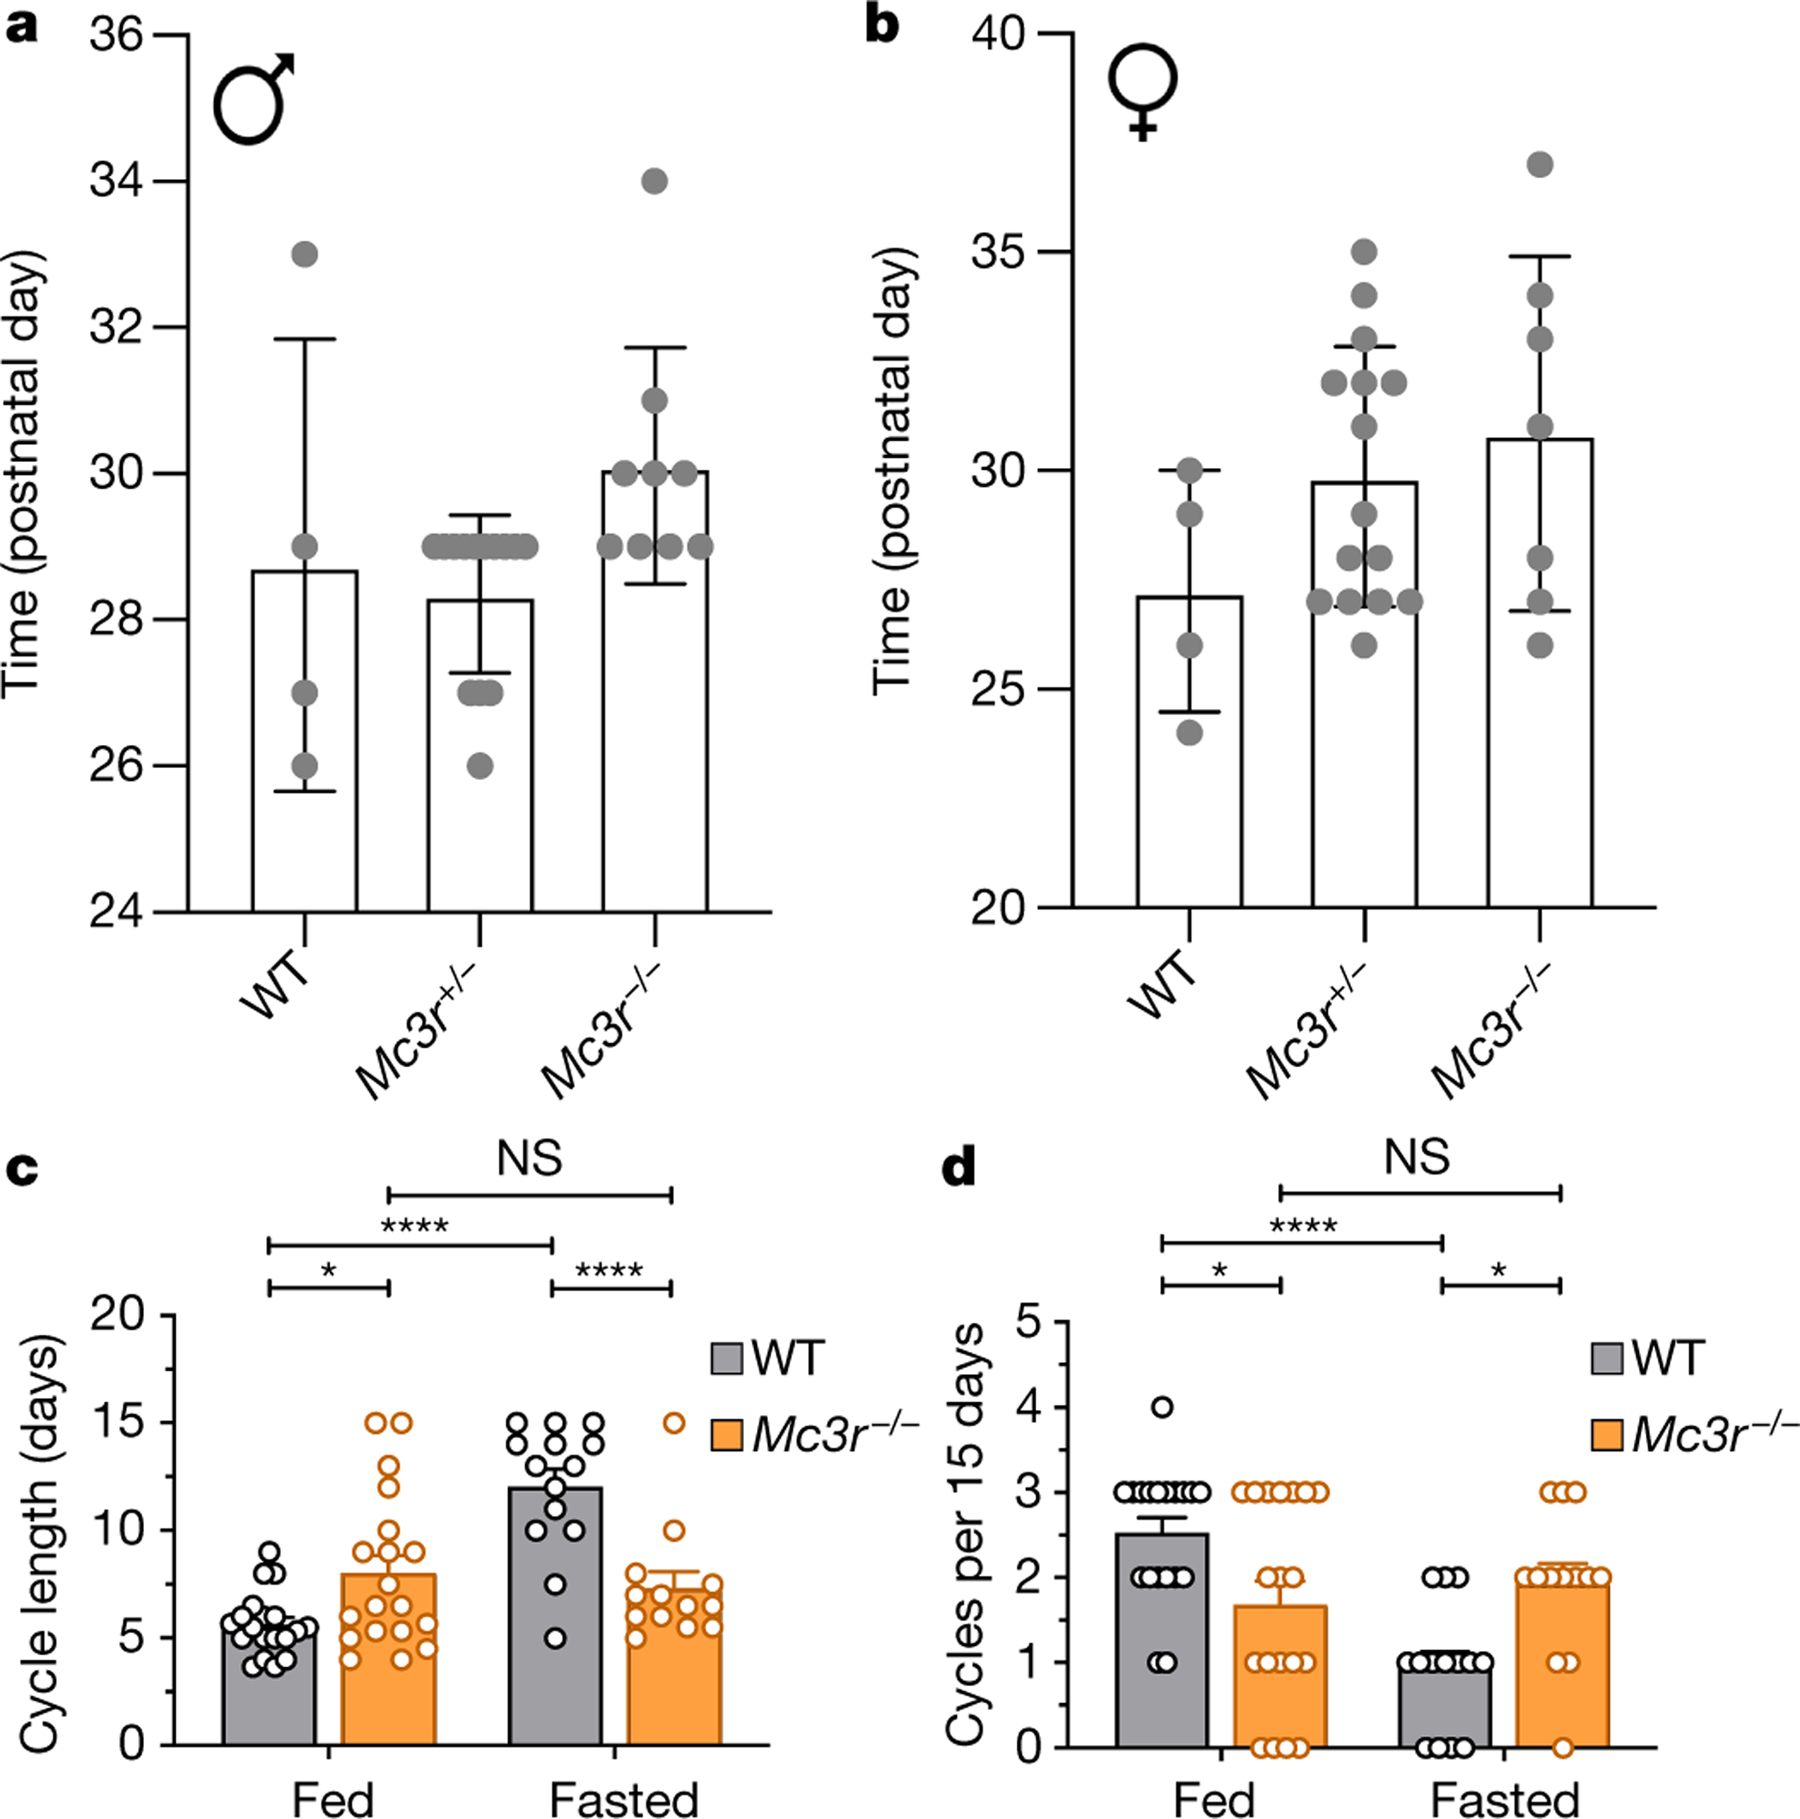
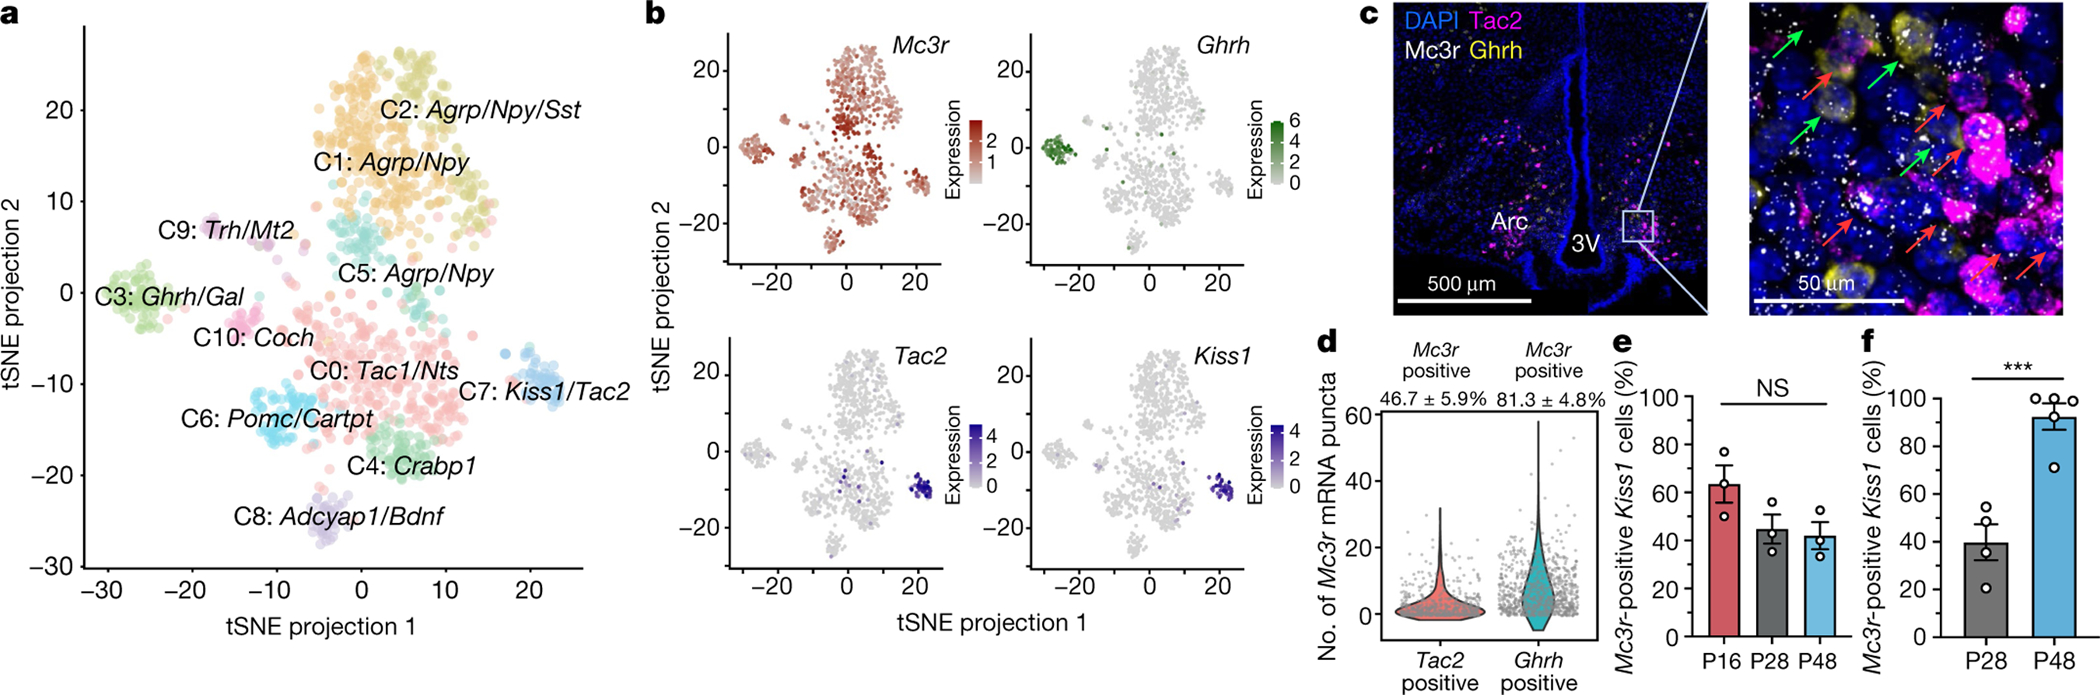
The state of somatic energy stores in metazoans is communicated to the brain, which regulates key aspects of behaviour, growth, nutrient partitioning and development1. The central melanocortin system acts through melanocortin 4 receptor (MC4R) to control appetite, food intake and energy expenditure2. Here we present evidence that MC3R regulates the timing of sexual maturation, the rate of linear growth and the accrual of lean mass, which are all energy-sensitive processes. We found that humans who carry loss-of-function mutations in MC3R, including a rare homozygote individual, have a later onset of puberty. Consistent with previous findings in mice, they also had reduced linear growth, lean mass and circulating levels of IGF1. Mice lacking Mc3r had delayed sexual maturation and an insensitivity of reproductive cycle length to nutritional perturbation. The expression of Mc3r is enriched in hypothalamic neurons that control reproduction and growth, and expression increases during postnatal development in a manner that is consistent with a role in the regulation of sexual maturation. These findings suggest a bifurcating model of nutrient sensing by the central melanocortin pathway with signalling through MC4R controlling the acquisition and retention of calories, whereas signalling through MC3R primarily regulates the disposition of calories into growth, lean mass and the timing of sexual maturation.


Figures

Extended Data Fig. 1 |
Extended Data Fig. 1 |. Functionally characterised MC3R mutations.
Complete, partial loss-of-function (LoF) and wild-type like mutations are marked in purple, dark yellow and green respectively. Coloured rectangles indicate cohort(s) in which mutations were identified: Red = UK Biobank (UKBB); Blue = Avon Longitudinal Study of Parents & Children (ALSPAC); Light Brown = Genes & Health (G&H).
Extended Data Fig. 2 |
Extended Data Fig. 2 |. PheWAS analysis of MC3R genetic risk score.
A CADD-weighted MC3R genetic risk score was constructed (see Methods) and used to conduct a phenome-wide analysis (pheWAS) with publicly available summary statistics. Solid black line indicates Bonferroni multiple-testing threshold of p < 1.046e-4, dashed line indicates nominal significance threshold p < 0.05.
Extended Data Fig. 3 |
Extended Data Fig. 3 |. Effect of MC3R Loss-of-Function mutations on height (cm) across time.
Carriers of MC3R LoF mutations (dark blue) had lower height throughout early life course compared to the reference group (light blue) after adjusting for sex and age. Figures only show results where the mutation group was represented by at least one individual at all time points between birth and 24 years. Mean ± 95% CI shown, N and p-values are listed in Supplementary Table 4.
Extended Data Fig. 4 |
Extended Data Fig. 4 |. MC3R is essential for normal cycle length and for fasting-induced suppression of the reproductive axis.
a, b, Representative traces of progression through the oestrous cycle in WT (a) and Mc3r−/− (b) mice following an overnight fast. D = Dioestrous; M = Metoestrous; E = Oestrous.
Extended Data Fig. 5 |
Extended Data Fig. 5 |. Mc3r is expressed in several cell populations in the mouse hypothalamus.
a, T-SNE plot showing 28 neuronal clusters (0–27) of the mouse hypothalamus from a combined dataset consisting of 18,427 neurons from 4 published studies. b, Mc3r is expressed in several neuronal populations (log2 normalised expression in dark red). c, Multiplexed smFISH showing the co-expression of Mc3r (white) Kiss1 (red) and Tac2 (green) in the arcuate nucleus. (Representative example shown, n = 3 mice, scale bar = 20μm). d, Venn diagram showing the number of cells expressing Kiss1 (left, red), Tac2 (right, green), or both (KNDy, centre). e, Violin plots showing the number of Mc3r mRNA punta in Kiss1 only, KNDy, and Tac2 only cells. Mean percentages of cells ± SEM with detected Mc3r are shown, data collected from 3 mice.
Extended Data Fig. 6 |
Extended Data Fig. 6 |. Expression of Mc3r and Lepr in KNDy and GHRH neurons.
a, b, Mc3r expression is more prominent compared to Mc4r and Lepr in Tac2 (KNDy) (cluster 7, blue) (a) and GHRH neurons (cluster 15, green) (b). c, Violin plots showing expression of Kiss1, Tac2, Ghrh, Mc3r and Lepr in KNDy and Ghrh neurons in the Campbell and the Chen dataset separately. The Lam and Romanov datasets are not shown due to low cell count (<10).
Extended Data Fig. 7 |
Extended Data Fig. 7 |. Human smFISH showing the co-expression of MC3R, KISS1, and GHRH in the human hypothalamic arcuate nucleus.
a, Annotated overview MC3R and KISS1 co-expression: MC3R = grey, KISS = magenta and MC3R+KISS1 = white (scale bar = 200μm). High-powered micrograph (squared area) below shows the staining of MC3R (white) and Kiss1 (magenta) mRNA punta in 2 representative cells (teal = DAPI, scale bar = 10μm). N = 2 slides. b, Annotated overview of MC3R and GHRH co-expression: MC3R = grey, GHRH = green and MC3R+KISS1 = white (scale bar = 200μm). High-powered micrograph (squared area) below shows the staining of MC3R and GHRH mRNA punta in a representative cell (teal = DAPI, scale bar = 4μm). N = 2 slides.
Extended Data Fig. 8 |
Extended Data Fig. 8 |. Mc3r expression in kisspeptin neurons in the mouse hypothalamus at P16, P28 and P48.
ac, Representative smFISH showing the co-expression of Mc3r and Kiss1 in the anteroventral periventricular nucleus (AVPV) at P16 (a); P28 (b) and P48 (c) (N = 3 mice for all age groups): Mc3r = green, Kiss1 = red (scale bar = 20μm).
Fig. 1 |
Fig. 1 |. Non-synonymous variants of MC3R and association with phenotypes.
a, b, Dose-dependent cAMP accumulation activity of MC3R mutants stimulated by NDP-MSH. MC3R mutants are grouped by their functional classification: LoF (a) and WT-like (b). Data are normalized to the percentage of WT (black). Mean ± s.e.m. is shown. Dotted line shows 0% WT cAMP activity; N and P values are listed in Supplementary Table 3. cLoF, complete LoF; pLoF, partial LoF. c, d, logEC50 (c) and Emax (d) values of MC3R mutants. Mean ± s.e.m. is shown. Grey crosses show individual data points; grey dotted line shows WT response; black dotted line shows 0% WT activity. Bonferroni *P < 0.05 using one-way ANOVA; N and P values are listed in Supplementary Table 3. e, Heatmap showing the phenotypic association of MC3R variants in the UKBB. Bonferroni threshold = 0.0025. fi, The effect of UKBB MC3R variants on the age at menarche (f), adult height (g), the ALM/BMI ratio (h), and plasma levels of IGF1 (in nmol l−1) (i). Beta ± 95% CI is shown. Dashed line indicates an effect size of 0; colour indicates level of significance (key in e); MAF and P values are listed in Supplementary Table 2.
Fig. 2 |
Fig. 2 |. Characteristics of an individual who is homozygous for the MC3R p.G240W mutation.
a, Whole-body dual-energy X-ray absorptiometry image of the MC3R p.G240W proband. b, c, Boxplots of the percentage of fat and lean mass in proband (orange) compared with South Asian men (N = 36) (b) and age-matched European men aged 44–54 years (N = 417) (c) in the UKBB. The centre line indicates the median, the box is the interquartile range, and the whiskers indicate 1.5 times the interquartile range. d, e, The total lean mass (black circle) (d) and the ALM/BMI ratio (e) of the proband compared with men from the UKBB with a BMI from 18 to 52 (the mean is indicated in blue and the grey shading indicates the 95% CI; N = 2,356).
Fig. 3 |
Fig. 3 |. The role of MC3R in sexual maturation and regulation of the oestrous cycle.
a, b, Day of pubertal maturation as measured by the preputial separation in male mice (a) (N values: 4 (WT), 14 (for Mc3r+/−) and 9 (Mc3r−/−); Kruskal–Wallis test, P = 0.015), and first oestrous cycle in female mice (b) (N values: 4 (WT), 15 (Mc3r+/−) and 7 (Mc3r−/−); Kruskal–Wallis test, P = 0.280). Mean ± s.e.m. is shown. c, Quantification of the length of the oestrous cycle in WT (N values: 19 (fasted) and 38 (fed)) and Mc3r−/− mice (N values: 14 (fasted) and 19 (fed)) in either ad libitum fed and fasted conditions. Mean ± s.e.m. is shown (two-way ANOVA with Bonferroni post-hoc; NS, not significant; *P ≤ 0.05; ****P ≤ 0.0001). d, Number of oestrous cycles per 15 days in WT and Mc3r−/− mice in ad libitum fed and fasted conditions. Mean ± s.e.m. is shown (two-way ANOVA with Bonferroni post-hoc; *P ≤ 0.05; ****P ≤ 0.0001).
Fig. 4 |
Fig. 4 |. Mc3r expression in the mouse hypothalamus.
a, Single-cell RNA sequencing of 1,166 Mc3r-expressing neurons reveal 11 distinct clusters (C0–C10). A tSNE plot is shown. b, tSNE plots showing normalized expression of Mc3r (dark red), Ghrh (dark green), Tac2 and Kiss1 (dark blue). c, Single-molecule in situ fluorescent hybridization showing colocalization of Mc3r (white) with Tac2 (magenta) and Ghrh (yellow) in a representative mediobasal hypothalamus (N = 6 mice). Selected Mc3r + Tac2 positive and Mc3r + Ghrh double-positive neurons are indicated by red and green arrows, respectively. Arc, arcuate nucleus; 3V, third ventricle. d, Quantification of Mc3r mRNA expression in Tac2 and Ghrh neurons. Co-expression percentage ± s.e.m. is shown at the top (N = 6 mice). e, The number of Mc3r + Kiss1 co-expressing neurons in the arcuate nucleus at P16, P28 and P48 (one-way ANOVA with Tukey’s post-hoc, Mean ± s.e.m. is shown; NS, P > 0.05; N = 3 mice for all age groups). f, There was an increase in the number of Mc3r + Kiss1 co-expressing neurons with age in the anteroventral periventricular nucleus (two-tailed Student’s unpaired t-test, Mean ± s.e.m. is shown; ***P < 0.001; N = 4 mice for both P28 and P48).

Comment in

References

    1. Friedman JM The function of leptin in nutrition, weight, and physiology. Nutr. Rev. 60, S1–S14; discussion S68–S84, S85–S87 (2002). - PubMed
    1. Cone RD Anatomy and regulation of the central melanocortin system. Nat. Neurosci. 8, 571–578 (2005). - PubMed
    1. Cowley MA et al. Leptin activates anorexigenic POMC neurons through a neural network in the arcuate nucleus. Nature 411, 480–484 (2001). - PubMed
    1. Hill JW et al. Direct insulin and leptin action on pro-opiomelanocortin neurons is required for normal glucose homeostasis and fertility. Cell Metab. 11, 286–297 (2010). - PMC - PubMed
    1. Varela L & Horvath TL Leptin and insulin pathways in POMC and AgRP neurons that modulate energy balance and glucose homeostasis. EMBO Rep. 13, 1079–1086 (2012). - PMC - PubMed

Publication types

MeSH terms