. 2021 Nov;599(7886):673-678.
doi: 10.1038/s41586-021-04057-2. Epub 2021 Nov 3.

Tumour DDR1 promotes collagen fibre alignment to instigate immune exclusion

Affiliations

Tumour DDR1 promotes collagen fibre alignment to instigate immune exclusion

Xiujie Sun et al. Nature. 2021 Nov.

Abstract

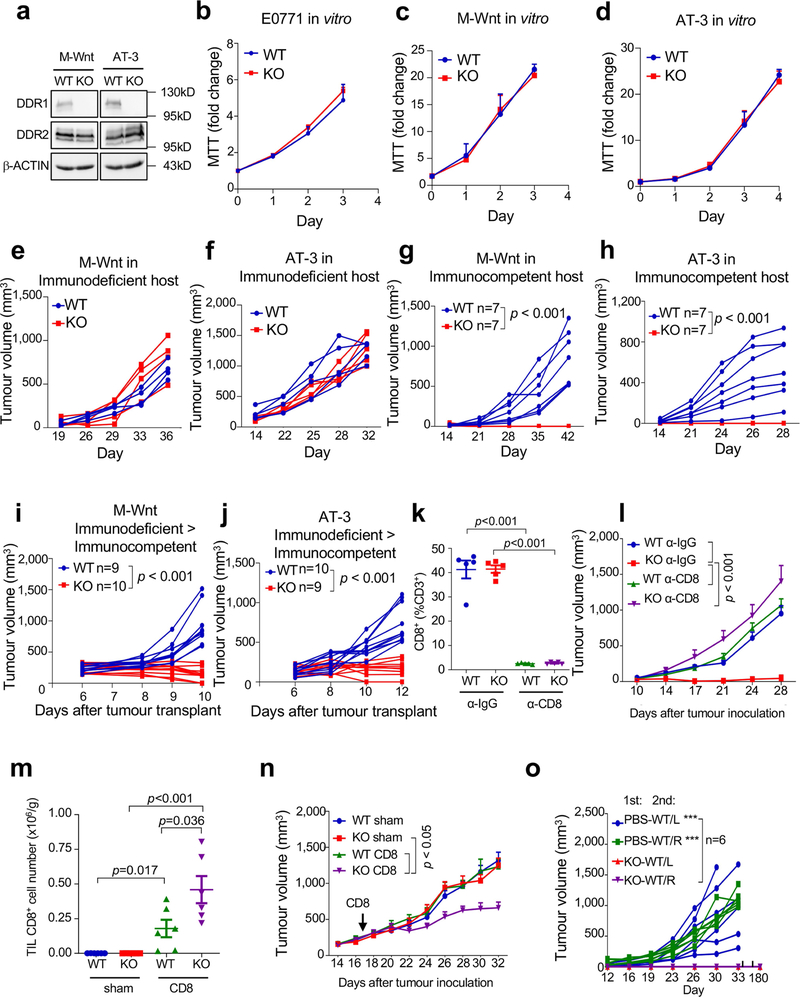
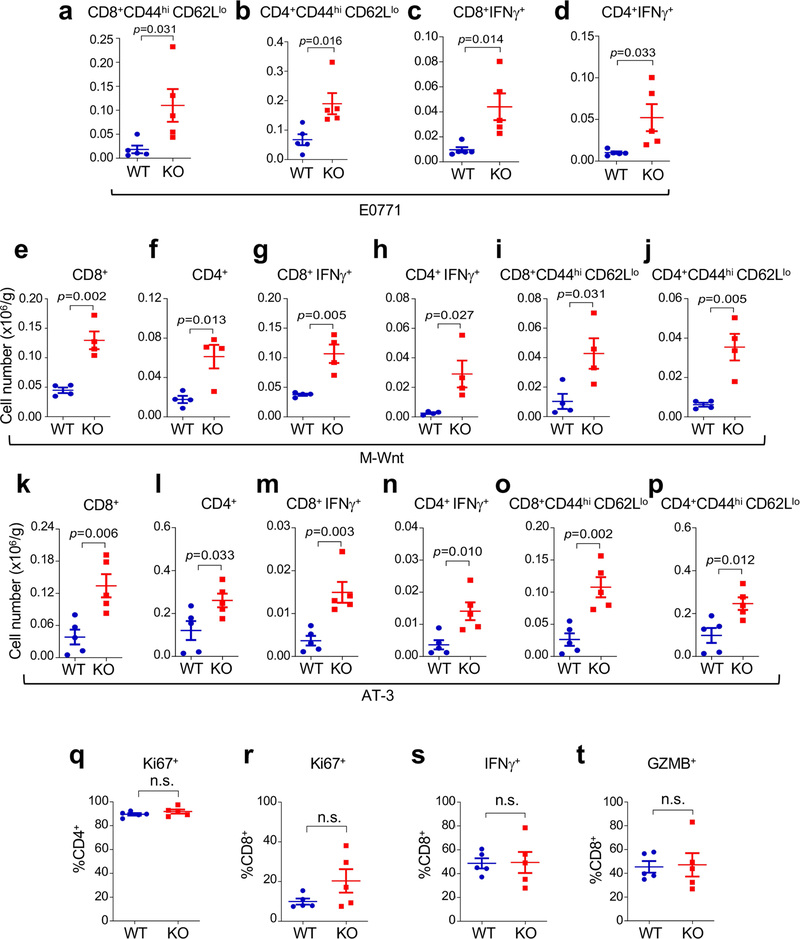
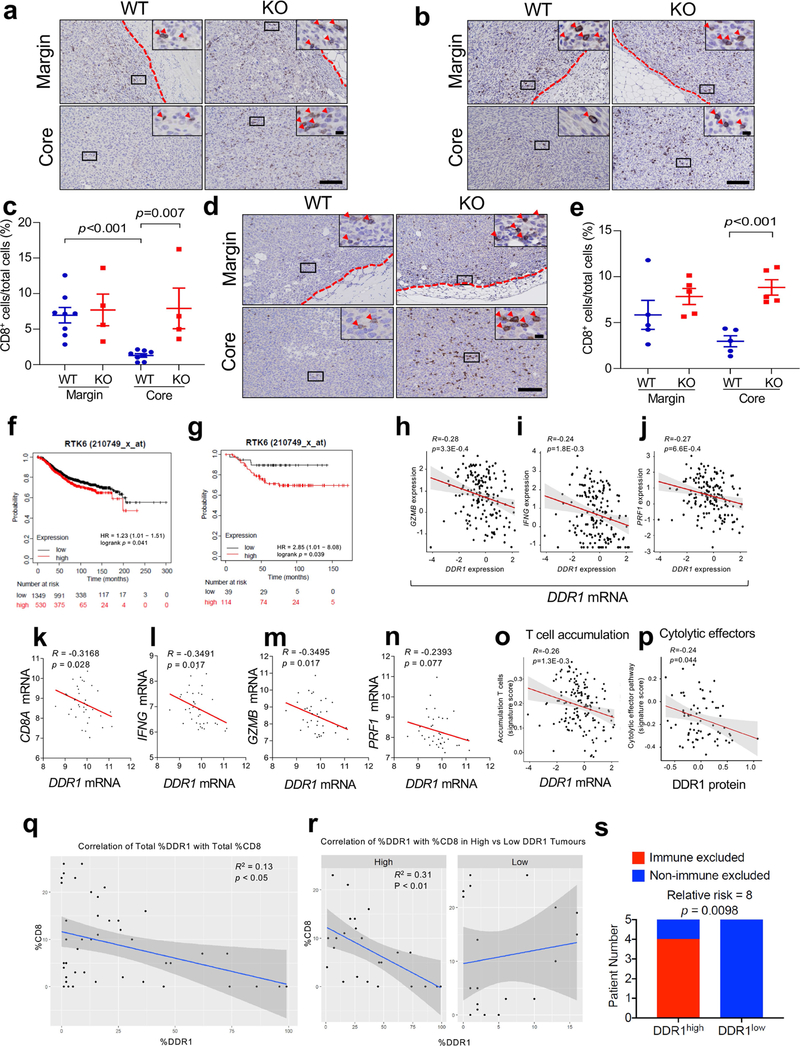
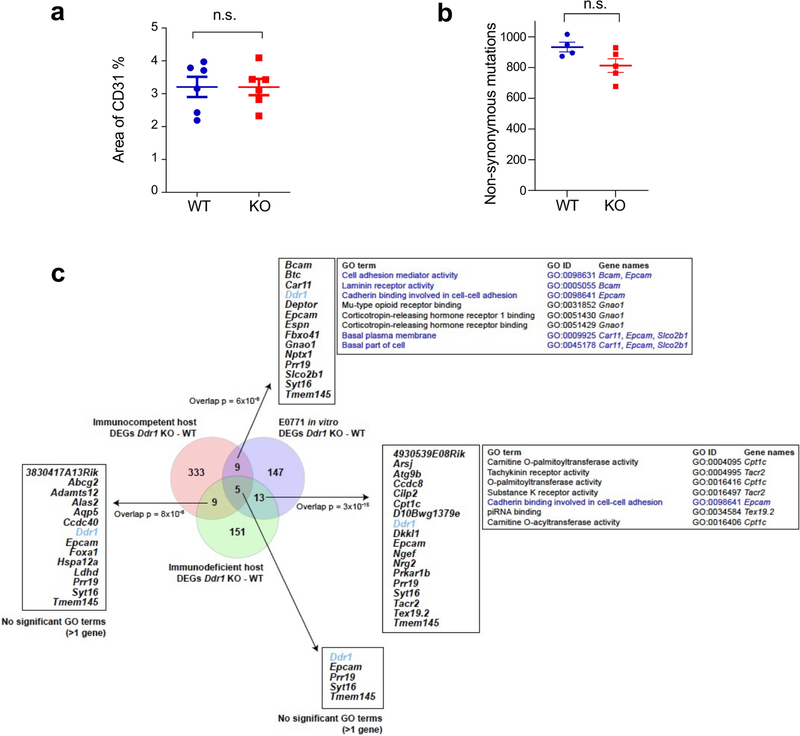
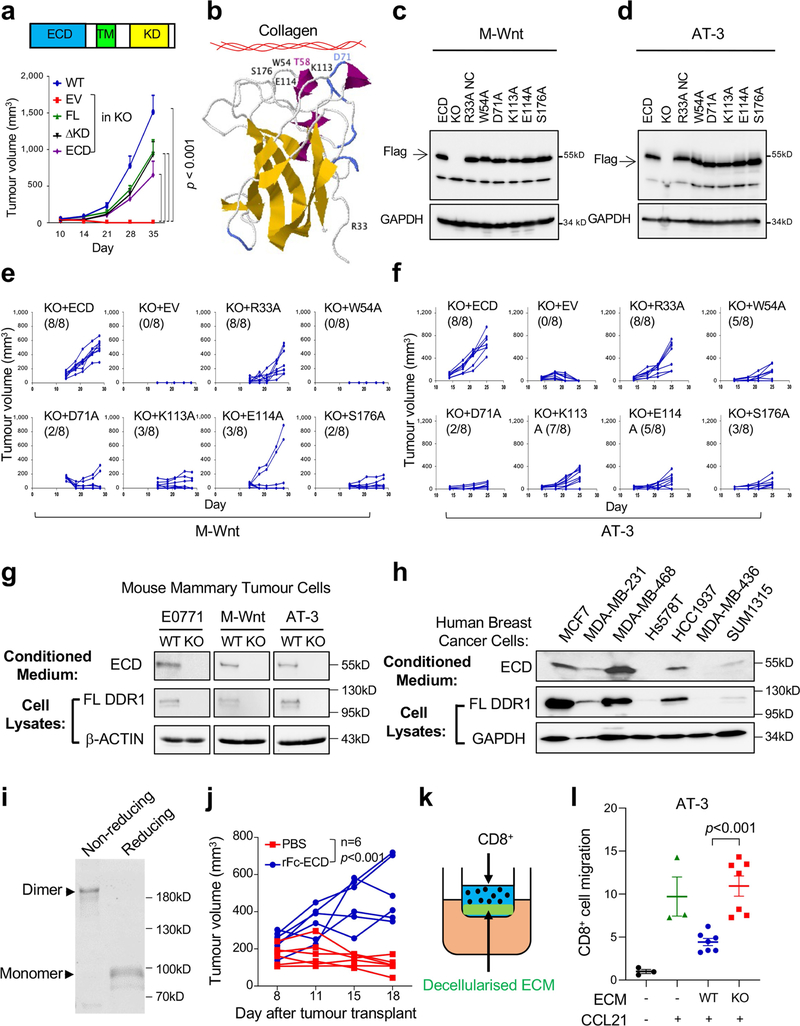
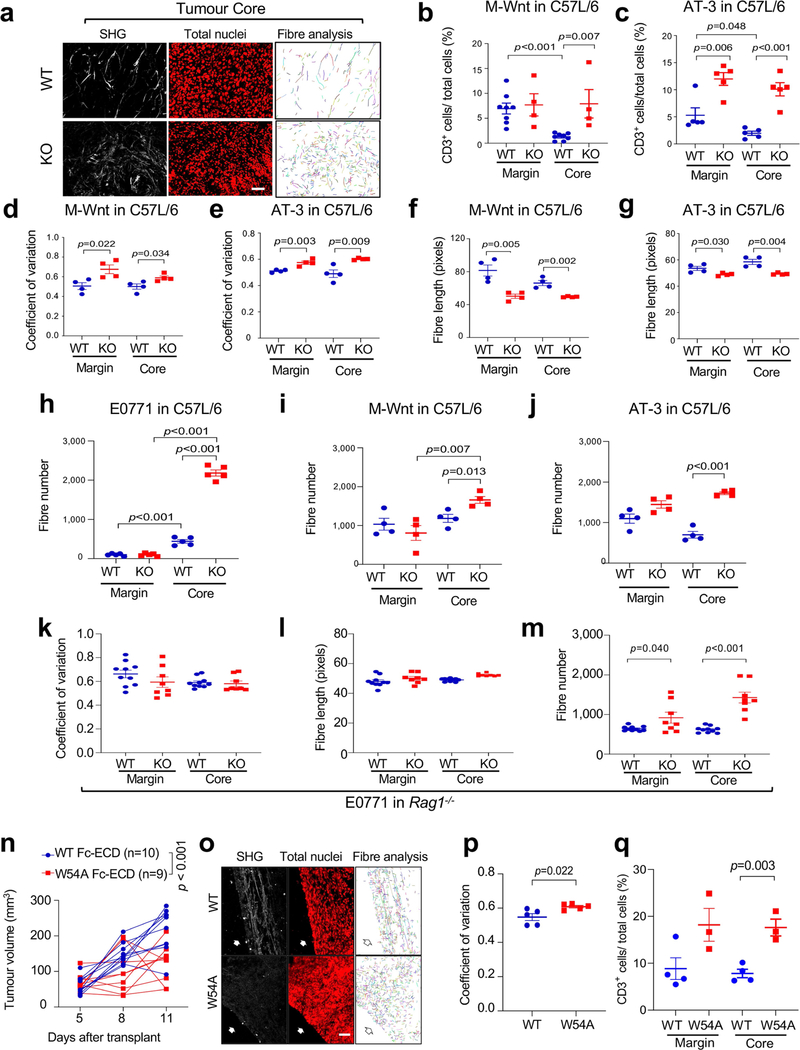
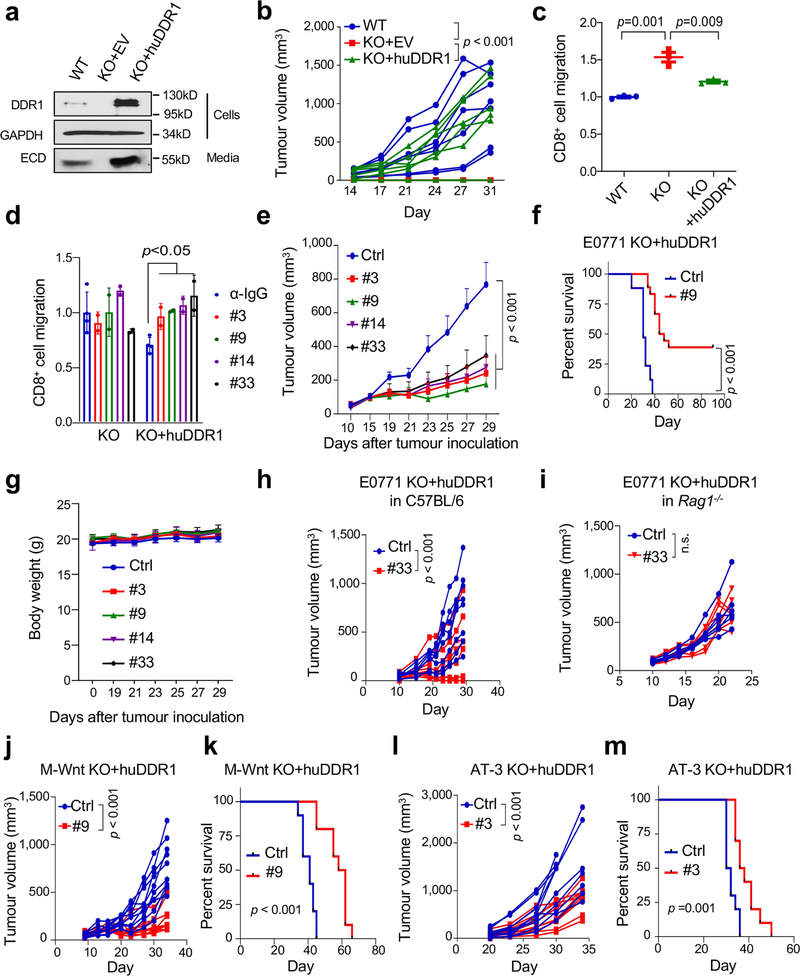
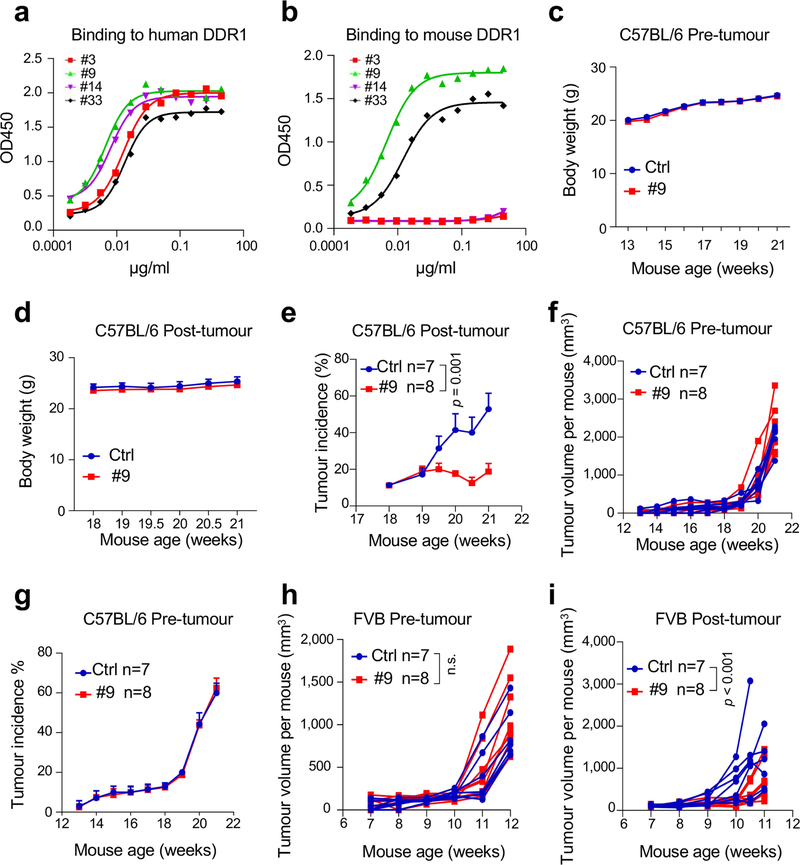
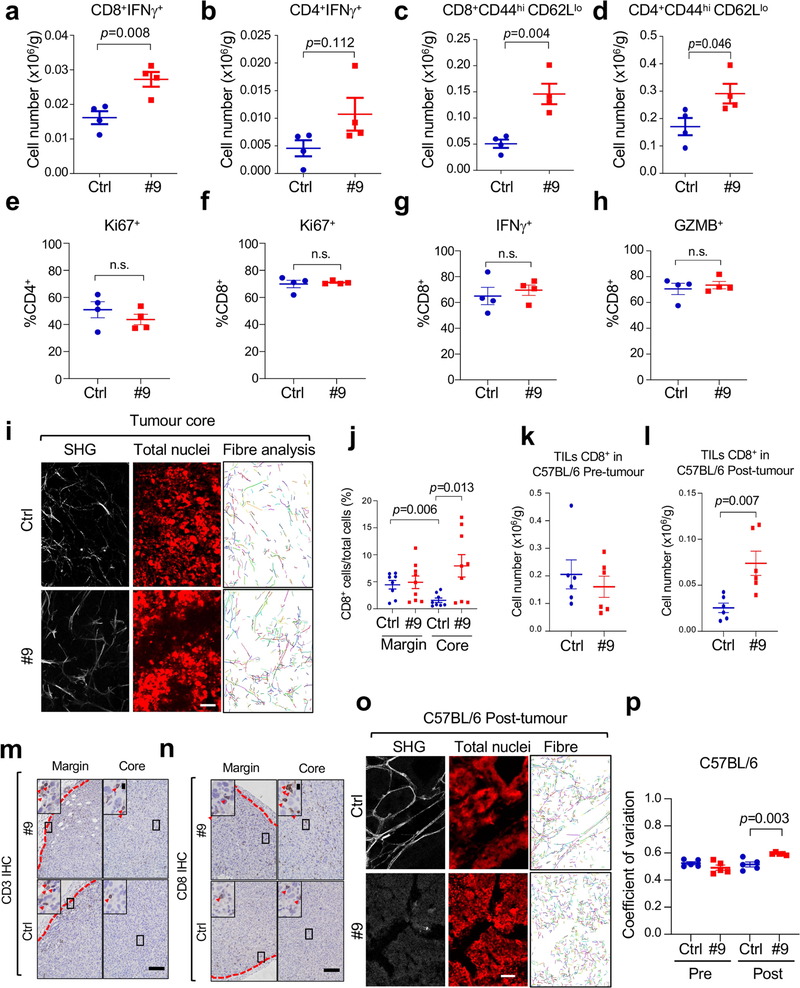
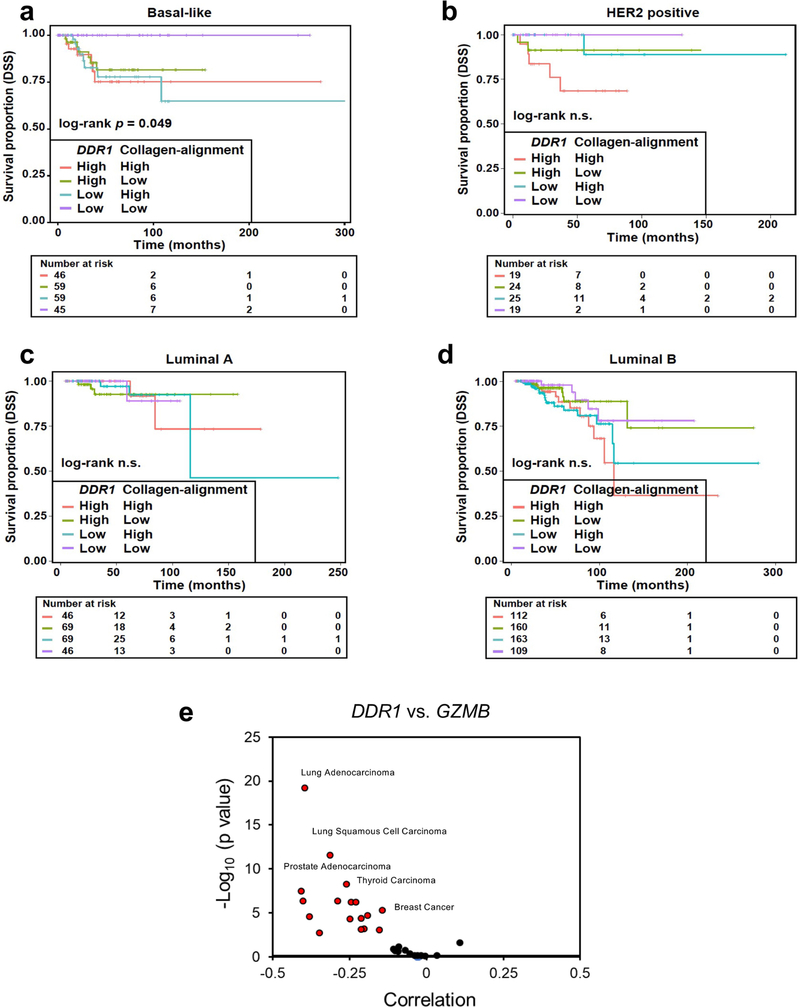
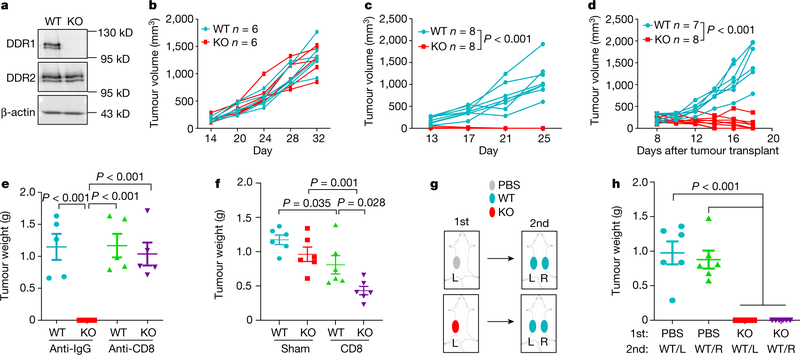
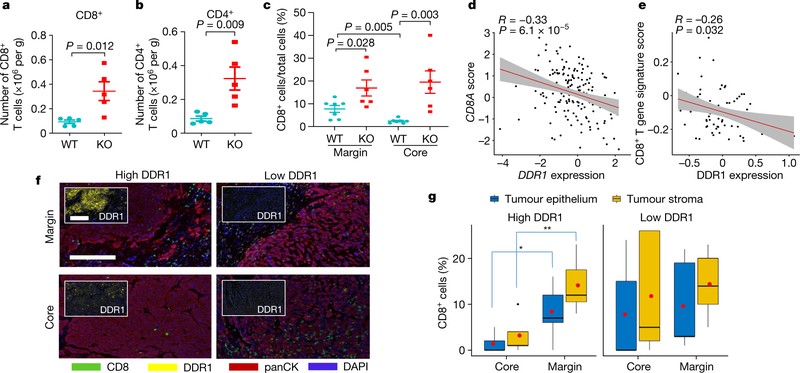
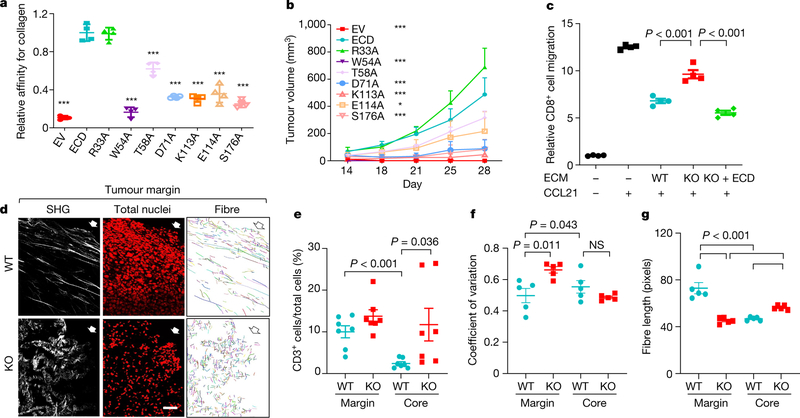
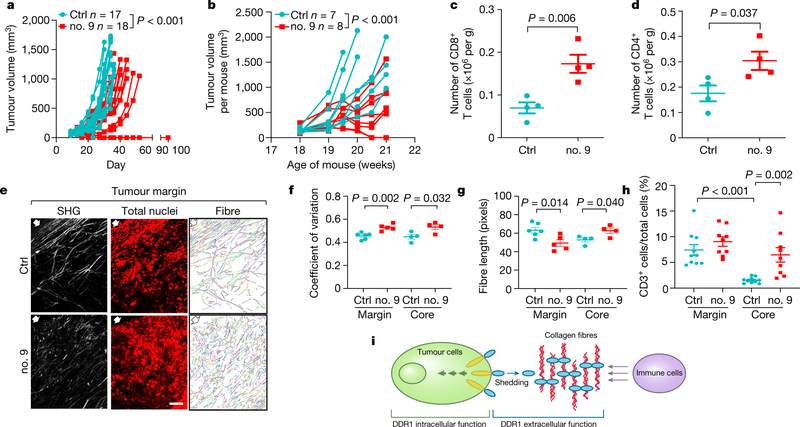
Immune exclusion predicts poor patient outcomes in multiple malignancies, including triple-negative breast cancer (TNBC)1. The extracellular matrix (ECM) contributes to immune exclusion2. However, strategies to reduce ECM abundance are largely ineffective or generate undesired outcomes3,4. Here we show that discoidin domain receptor 1 (DDR1), a collagen receptor with tyrosine kinase activity5, instigates immune exclusion by promoting collagen fibre alignment. Ablation of Ddr1 in tumours promotes the intratumoral penetration of T cells and obliterates tumour growth in mouse models of TNBC. Supporting this finding, in human TNBC the expression of DDR1 negatively correlates with the intratumoral abundance of anti-tumour T cells. The DDR1 extracellular domain (DDR1-ECD), but not its intracellular kinase domain, is required for immune exclusion. Membrane-untethered DDR1-ECD is sufficient to rescue the growth of Ddr1-knockout tumours in immunocompetent hosts. Mechanistically, the binding of DDR1-ECD to collagen enforces aligned collagen fibres and obstructs immune infiltration. ECD-neutralizing antibodies disrupt collagen fibre alignment, mitigate immune exclusion and inhibit tumour growth in immunocompetent hosts. Together, our findings identify a mechanism for immune exclusion and suggest an immunotherapeutic target for increasing immune accessibility through reconfiguration of the tumour ECM.


Conflict of interest statement

Competing interests X.S., H.D., N.Z., Z.A. and R.L. are co-inventors of a pending patent application (62/949,300) filed by the University of Texas Health Science Center at Houston on the anti-DDR1 antibodies described in this manuscript. The University of Texas System and The George Washington University have licensed the patent to Parthenon Therapeutics for drug development. R.L. receives stock option and financial compensation for his role as a member on the Scientific Advisory Board of Parthenon Therapeutics.

Figures

Extended Data Fig. 1 |
Extended Data Fig. 1 |. Differential effects of tumour Ddr1-KO on tumour growth in vitro and in vivo.
(a) Immunoblotting of DDR1, DDR2 and loading control β-ACTIN in M-Wnt and AT-3 Ddr1-WT/KO tumour cells. Images are representatives of three independent experiments. (b–d) In vitro cell proliferation of E0771 (WT: n = 3, KO: n = 5, b), M-Wnt (WT: n = 3, KO: n = 5, c) and AT-3 (WT: n = 6, KO: n = 4, d) tumour cells, n indicate technical repeats. Out of three biological repeats. (e–f) M-Wnt (n = 4 tumours/group, e) and AT-3 (n = 5 tumours/group, f) tumour growth in immunodeficient mice. (g–h) M-Wnt (n = 7 tumours/group, g) and AT-3 (n = 7 tumours/group, h) tumour growth in immunocompetent C57BL/6 mice. (i–j) M-Wnt and AT-3 tumours were grown firstly in Rag1−/− hosts. Approximately 60 mg of tumour pieces were transplanted to C57BL/6 mice. Tumour volume of M-Wnt (WT” n = 9 tumours, KO: n = 10 tumours, i) and AT-3 (WT: n = 10 tumours, KO: n = 9 tumours, j). (k) Percentage of CD8+ in CD3+ T cells in blood, n = 5 mice/group. (l) Tumour volumes in C57BL/6 hosts with prior treatment of anti-IgG or anti-CD8 antibody (n = 5 tumours/group). (m) CD8+ TILs normalized by tumour weight in Rag1−/− mice after adoptive transfer of CD8+ T cells or medium (sham), n = 6 tumours/group. (n) Tumour volumes in Rag1−/− mice after adoptive transfer of CD8+ T cells or medium (sham). n = 6 tumours/group. Arrow indicates transfer of CD8+ T cells on day 17. (o) Tumour weight from rechallenged mice (n = 6 tumours/group). Values represent mean ± SEM. p value and n as indicated, all tests used two-way ANOVA except for CD8+ quantification, which used two-tailed Student’s t-test.
Extended Data Fig. 2 |
Extended Data Fig. 2 |. Immunophenotyping of Ddr1-WT and Ddr1-KO tumours.
(a–d) TIL number normalized by E0771 Ddr1-WT/KO tumour weight/gram. Cell number of CD44hi CD62Llo CD8+ (a) and CD44hi CD62Llo CD4+ (b) IFNγ+ CD8+ (c) and IFNγ+ CD4+ (d) T cells. WT/KO: n = 5 tumours/group. (e–p) TIL numbers normalized by tumour weight of M-Wnt (n = 4 tumours/group, e-j) and AT-3 tumours (n = 5 tumours/group, k–p). (q–t) Percentages of T cells from E0771 Ddr1-WT and KO tumours (n = 5 tumours/group) positive for Ki67 (CD4+ in q and CD8+ in r), IFNγ (CD8+ in s) or GZMB (CD8+ in t). n.s. not significant. Values represent mean ± SEM. p value as indicated, two-tailed Student’s t-test.
Extended Data Fig. 3 |
Extended Data Fig. 3 |. Correlation between DDR1 and immune markers in human breast cancer.
(a) Representative images of CD8+ T cell staining at E0771 tumour margin and in the tumour core (bottom panels). (b, c) Representative images (b) and quantification (c) of CD8+ T cell IHC at M-Wnt tumour margin and core (WT: n = 8 tumours, KO: n = 4 tumours). (d, e) Representative images (d) and quantification (e) of CD8+ T cell IHC at AT-3 tumour margin and core (n = 5 tumours/group). Images in (a),(b), and (d) showing tumour margin at top panel (tumour boarder denoted by red dash lines) and tumour core at bottom panel. Box areas at higher magnification are shown in the upper right inlets. Red arrow heads indicate CD8+ cells. The y-axis in (c) and (e) refers to percent of CD8+ cells over total cells in a given field. Scale bar: 100 μm and 10 μm in inlets. Two-tailed Student’s t-test. (f–g) Correlation between DDR1 mRNA levels and overall survival of all patients with breast cancer (f) and patients with TNBC (g) in the Kaplan-Meier Plotter database (https://kmplot.com/analysis/). (h–j) Scatter plots showing the negative gene expression (Z-score) correlation between DDR1 mRNA levels and GZMB (h), IFNG (i), and PRF1 (j) in TCGA TNBC tumours (n = 162). The corresponding Spearman’s correlation coefficients and p values are shown. (k–n) Correlation of DDR1 mRNA levels and anti-tumour immune markers in 37 samples from patients with TNBC (GSE88847). (o) Scatter plot showing the negative gene expression correlation between DDR1 mRNA levels and signature for accumulation of T cells in tumours using TCGA TNBC tumour data. (p) Scatter plots showing the negative expression correlation between DDR1 protein expression and cytolytic effector pathway in CPTAC BRCA. (q) Correlation between percentages of CD8+ immune cells and DDR1+ tumour cells in a TNBC cohort (n = 12). (r) Correlation between percentages of CD8+ immune cells and DDR1+ tumour cells in a DDR1high (n = 7) and DDR1low (n = 5) TNBC samples. (s) Patient numbers of immune-excluded (n = 4) and non-immune-excluded (n = 6) in DDR1high and DDR1low group. Only the 10 patient samples with paired margin and core information were used for the immune exclusion calculation in Extended Data Fig. 3s, two-sided Chi-square test.
Extended Data Fig. 4 |
Extended Data Fig. 4 |. DDR1 dependent transcriptomic changes.
(a) Quantification of αCD31 IHC of WT and KO tumours transplanted from Rag1−/− to C57BL/6 hosts (n = 6 tumours; n.s., not significant). Data are presented as mean values +/− SEM. Two-tailed Student’s t-test (b) Comparison of non-synonymous tumour mutational burden between Ddr1-WT (n = 4 tumours) and KO tumours (n = 5 tumours, n.s., not significant). Data are presented as mean values +/− SEM. Two-tailed Student’s t-test (c) Venn diagram showing the numbers of DEGs in each Ddr1-KO-WT comparison and the identity overlaps between them. The pairwise overlap significance is indicated. The GO terms overrepresented (FDR-adjusted p < 0.05 relative to mouse genome background) in the overlapping sets are shown; the genes corresponding to each annotation are also indicated.
Extended Data Fig. 5 |
Extended Data Fig. 5 |. Mutational and biochemical analysis of DDR1-ECD in vitro and in vivo.
(a) Diagram of full-length (FL) DDR1 (top) and tumour curves of either E0771 Ddr1-WT or KO tumour cells carrying various DDR1 expression vectors: empty vector (EV), FL, deletion of the kinase domain (ΔKD), and extracellular domain (ECD) only. All p values were compared to KO + EV group. TM: transmembrane domain. WT: n = 9 tumours, KO+EV: n = 10 tumours, KO+FL: n = 10 tumours, KO+ ΔKD: n = 6 tumours, KO+ECD: n = 5 tumours. (b) Crystal structure of mouse DDR1 collagen-binding domain, generated by Jmol software (http://www.jmol.org/). Amino acid residues targeted in the mutational analysis are shown. (c) Immunoblots of Flag-tagged mouse WT DDR1-ECD and point mutants ectopically expressed in M-Wnt tumour cells, with GAPDH as the loading control. Images are representatives from three independent experiments. (d) Immunoblots of Flag-tagged mouse WT DDR1-ECD and point mutants ectopically expressed in AT-3 tumour cells, with GAPDH as the loading control. Images are representatives from three independent experiments. (e–f) Growth curves of M-Wnt (e) and AT-3 (f) Ddr1-KO tumours with ectopically expressed mouse WT DDR1-ECD or collagen-binding point mutants. The numbers in parenthesis indicate outgrowing tumours (larger than 100 mm) versus total injected. (g, h) Immunoblots of full-length DDR1 in cells and soluble ECD in conditioned medium from various mouse (g) and triple-negative human breast cancer cell lines plus ER-positive MCF7 (h). Images are representatives from three independent experiments. (i) Coomassie staining of recombinant Fc-ECD under non-reducing and reducing conditions. (j) Rescue of Ddr1-KO E0771 tumour growth in immunocompetent hosts by recombinant Fc-ECD versus PBS vehicle (n = 6 tumours/group). (k) Diagram of the Transwell assay for CD8+ T cell migration. Primary CD8+ T cells were loaded in the upper chamber that had been pre-seeded with decellularized ECM derived from tumour cells. The lower chamber contained medium with or without CCL21. (l) CD8+ T cells in vitro migration activity was abrogated by decellularized ECM from AT-3 tumour cells in a DDR1-dependent manner. Value of migrated CD8+ T cell number without ECM and CCL12 is set at “1” (lanes 1 and 2: n = 3; lanes 3 and 4: n = 7), n refers to technical repeats. Values represent mean ± SEM. p value as indicated, two-tailed Student’s t-test for all tests except for tumour volumes, which were done by two-way ANOVA.
Extended Data Fig. 6 |
Extended Data Fig. 6 |. SHG microscopy of Ddr1-WT and Ddr1-KO tumours.
(a) E0771 Ddr1-WT/KO tumours transplanted from Rag1−/− to C57BL/6 hosts were analysed by SHG, To-pro-3 staining for all nuclei, and collagen fibre individualization. Scale bar: 50 μm. (b, c) M-Wnt (WT n = 8 tumours, KO n = 4 tumours) and AT-3 (n = 5 tumours/group) Ddr1-WT/KO tumours transplanted from Rag1−/− to C57BL/6 hosts were analysed for infiltrating CD3+ T cells normalized by total cells via IHC. (d–g) M-Wnt and AT-3 Ddr1-WT/KO tumours transplanted from Rag1−/− to C57BL/6 hosts were analysed for collagen fibre alignment (d, e) and fibre length (f, g), n = 4 tumours/group. (h–j) E0771, n = 5 tumours/group (h), M-Wnt, n = 4 tumours/group (i) and AT-3, n = 4/group (j) Ddr1-WT/KO tumours transplanted from Rag1−/− to C57BL/6 hosts were analysed for fibre numbers by the CT-Fire software. (k–m) E0771 Ddr1-WT/KO tumours (WT n = 10 tumours, KO n = 8 tumours) from immunodeficient Rag1−/− hosts were analysed for collagen fibre alignment (k), fibre length (l) and fibre numbers (m) by the CT-Fire software. (n) Growth curves of E0771 Ddr1-KO tumours in immunocompetent hosts that were intratumorally injected with recombinant WT and mutant Fc-ECD (WT: n = 10 tumours, W54A: n = 9 tumours). (o) Representative images of E0771 Ddr1-KO tumours treated with recombinant WT or mutant Fc-ECD in C57BL/6 hosts as analysed by SHG, To-pro-3 staining, and collagen fibre individualization. Scale bar: 50 μm. (p) Quantification of collagen fibre alignment in WT and mutant Fc-ECD treated tumours (n = 5 tumours/group). (q) Enumeration of infiltrating CD3+ T cells normalized by total cells via IHC (WT: n = 4 tumours, KO: n = 3 tumours). Values represent mean ± SEM. p value as indicated, two-tailed Student’s t-test for all tests except for tumour volumes, which were done by two-way ANOVA.
Extended Data Fig. 7 |
Extended Data Fig. 7 |. Screening for huDDR1-neutralizing antibodies.
(a) Immunoblots of ectopic human (hu) DDR1 and endogenous mouse DDR1 in cell lysates and medium of E0771-derived cells. (b) Tumour growth curve of E0771-derived Ddr1-WT, KO+EV, KO+huDDR1 cells (n = 7 tumours/group).(c) Transwell migration assay for purified CD8+ T cells in the presence of conditioned medium from E0771 cells containing endogenous WT DDR1, Ddr1-KO, or Ddr1-KO and ectopic expression of huDDR1 (n = 3 technical repeats). Value of migrated CD8+ T cell number with parental E0771-conditioned medium is set at “1”. (d) Quantification of CD8+ T cell migration in the presence of DDR1-neutralizing antibodies, using conditioned medium from E0771 Ddr1-KO or KO+huDDR1 cells (IgG: n = 4, #3,#9,#14,#33: n = 2, technical repeats). Control: isotype IgG; anti-DDR1 antibody: #3, #9, #14, and #33. Value of migrated CD8+ T cell number in the far-left column is set at “1”. (e) Tumour curves treated with control IgG, #3, #9, #14, and #33 (n = 8 tumours/group). Antibody administration started when tumour volume reached approximately 100 mm3. All p values were compared to the control IgG group and p value as indicated. (f) Tumours host survival curves of E0771 Ddr1-KO tumour cells with ectopically expressed human (hu) DDR1 in C57BL/6 hosts treated intratumorally with isotype IgG (Ctrl, n = 17, tumours) or anti-DDR1 antibody #9 (n = 18, tumours). (g) Host body weight treated with control IgG, #3, #9, #14, and #33 (Ctrl n = 4 mice, #3, #9, #14, and #33 n = 4 mice/group). Antibody administration started when tumour volume reached approximately 100 mm3. Data are presented as mean values +/− SEM. (h, i) E0771 KO+huDDR1 tumours in C57BL/6 (n = 8 tumours/group, h) and Rag1−/− hosts (n = 6 tumours/group, i) treated with either isotype IgG or anti-DDR1 #33 antibody. (j, k) Tumour volume (j) and survival curve (k) of M-Wnt KO+huDDR1 tumours in C57BL/6 mice treated with isotype IgG and anti-DDR1 antibody #9 (n = 10, tumours/group). (l, m) Tumour growth (l) and survival percentage (m) of AT-3 KO+huDDR1 tumours in C57BL/6 mice treated with isotype IgG and anti-DDR1 antibody #3 (n = 10, tumours/group). Values represent mean ± SEM. p value as indicated. Tumour volumes were examined by two-way ANOVA; survival analysis was examined by log-rank (Mantel–Cox) test, and migration assay were examined by two-tailed Student’s t-test.
Extended Data Fig. 8 |
Extended Data Fig. 8 |. DDR1 antibody treatment inhibits spontaneous mammary tumour growth.
(a-b) Binding affinity of all four anti-ECD antibody clones for human (a) and mouse (b) DDR1. (c–d) Spontaneous MMTV-PyMT body weight of C57BL/6 hosts treated with control or #9 in the pre-tumour (from 11 weeks old, control: n = 7 mice, #9: n = 8 mice, c) and post-tumour groups (control n = 7 mice, #9 n = 8 mice, d). Data are presented as mean values +/− SEM. (e) Tumour incidence (percentage of tumour-bearing mammary glands per mouse, in MMTV-PyMT spontaneous mammary tumour model of C57BL/6 genetic background, treated in a “post-tumour” scheme with Ctrl (n = 7 mice) or anti-DDR1 #9 antibody (n = 8 mice). Data are presented as mean values + SEM. (f, g) Spontaneous MMTV-PyMT tumour growth in C57BL/6 hosts (accumulative tumour volume per mouse, f) and incidence percentage (per mouse, g) with pre-tumour treatment (control: n = 7 mice, #9: n = 8 mice). Data are presented as mean values +/− SEM. (h, i) Spontaneous MMTV-PyMT tumour growth (accumulative tumour volume per mouse) in FVB hosts treated with control or #9 before tumour growth (from 5 to 7 weeks old, h) and post-tumour groups (i). control: n = 7 mice, #9: n = 8 mice, n.s. not significant. Two-way ANOVA were used for all tests.
Extended Data Fig. 9 |
Extended Data Fig. 9 |. DDR1 antibody boosts the infiltration of anti-tumour immune cells.
(a–d) Indicated TIL numbers normalized by tumour weight in E0771 KO+huDDR1 tumours from C57BL/6 mice treated with control and anti-DDR1 antibody #9 (n = 4 tumours/group). (e–h) Percentage of Ki67-positive cells in CD4+, CD8+ T cells and percentage of IFNγ- or GZMB-positive cells in CD8+ T cells from the same antibody-treated mice as in (a–d) (n = 4 tumours/group). n.s. not significant. (i) Representative images of transplanted mammary tumours treated with Ctrl or anti-DDR1 #9 antibody, analysed by SHG, To-pro-3 staining, and collagen fibre individualization. Scale bar: 50 μm. (j) Quantification of CD8+ T cells in tumour margin and core in control and anti-DDR1 antibody-treated E0771 KO+huDDR1 tumours (Ctrl: n = 8 tumours, #9: n = 9 tumours). (k, l) TILs from spontaneous mammary tumours (C57B/6) treated with Ctrl or anti-DDR1 #9 antibody under the pre-tumour (k) and post-tumour (l) conditions. n = 6 tumours/group. (m, n) Representative IHC images of CD3+ and CD8+ T cells in tumour margin and core in control and anti-DDR1 antibody-treated E0771 KO+huDDR1 tumours. Tumour boarder denoted by red dash lines. Box areas at higher magnification are shown in the inlets. Red arrow heads indicate CD8+ cells. Scale bar: 100 μm and 10 μm in inlet. (o) Representative images of tumours from the post-tumour treatment group, analysed by SHG, To-pro-3 staining, and collagen fibre individualization. Scale bar: 50 μm. (p) Quantification of tumour fibre alignment in pre- and post-tumour treatment in C57BL/6 hosts (n = 5 tumours/group). Values represent mean ± SEM. p value as indicated, two-tailed Student’s t-test.
Extended Data Fig. 10 |
Extended Data Fig. 10 |. DDR1-related clinical correlation in cancers.
(a–d) Kaplan–Meier curves showing disease specific survival (DSS) rates for TCGA patients with breast cancer divided by major tumour subtypes: basal-like (a), HER2 positive (b), luminal A (c), and luminal B (d). Each subtype is further divided in four patient groups according to the tumour expression levels of the DDR1 gene and collagen-alignment signature. The gene/signature classification in high and low expression was based on their corresponding average expression values. The log-rank test p value and the number of individuals at risk at different follow-up times are shown in each tumour subtype analysis. (e) Correlation between human DDR1 and GZMB mRNA expression in various cancer types.
Fig. 1 |
Fig. 1 |. DDR1 promotes mammary tumour growth in immunocompetent hosts.
a, DDR1, DDR2 and β-actin immunoblots in E0771 cells. Images are representatives of at least three independent experiments. b, E0771 tumour growth in Rag1−/− immunodeficient hosts (n = 6 tumours per group). c, E0771 tumour growth in immunocompetent C57BL/6 mice (n = 8 tumours per group). d, E0771 tumours (WT, n = 7 tumours; KO, n = 8 tumours) transplanted from Rag1−/− to C57BL/6 mice. e, E0771 tumour weight in C57BL/6 hosts with prior treatment with anti-IgG or anti-CD8 antibody (n = 5 tumours per group). f, Tumour weight after CD8+ T cell or sham (medium) transfer to Rag1−/− (n = 6 tumours per group) mice challenged with E0771 tumours. g, Diagram for tumour rechallenge. First challenge with PBS or E0771 Ddr1-KO cells on one side of inguinal mammary gland (1st), and second challenge after 30 days with E0771 Ddr1-WT tumour cells on both sides of mammary gland (2nd). L, left; R, right. h, Tumour weight from rechallenged mice (n = 6 tumours per group). Values represent mean ± s.e.m. P values and n numbers as indicated; two-tailed Student’s t-test for all tests except for tumour volumes (two-way ANOVA).
Fig. 2 |
Fig. 2 |. DDR1 inhibits the infiltration of anti-tumour immune cells.
a, b, Abundance of CD8+ (a) and CD4+ (b) T cells normalized by E0771 tumour weight per gram (WT, n = 5 tumours; KO, n = 5 tumours). c, Quantification of CD8+ T cells by IHC in E0771 tumour margin and core (WT, n = 7 tumours; KO, n = 6 tumours). The y axis is the percentage of CD8+ cells over total cells in a given field. d, Scatter plots showing the negative gene expression (z-score) correlation between DDR1 mRNA levels and CD8A. Spearman’s correlation coefficients and P values are shown. e, Scatter plots showing the negative expression correlation between the expression of DDR1 protein and CD8+ T gene signature scores in CPTAC BRCA (see ‘Bioinformatics analysis’ in Methods). f, Multiplex immunofluorescent staining of DDR1, CD8 and tumour-specific panCK using DDR1high (n = 7) and DDR1low (n = 5) TNBC tumour samples. Scale bar, 200 μm. g, Quantification of CD8+ cells in tumour core and margin of DDR1high and DDR1low samples from f. CD8+ cell populations were divided into those contained within tumour epithelium and stromal compartments. The CD8+ cell percentage was CD8+ cell number over total cell number in a given field per slide. The bounds of the box represent the 25th and 75th percentiles of the interquartile range. The black line in the box interior represents the median of the data. The red dot represents the mean of the data. The whiskers represent the minimum and maximum values of the data and the black dot outside the box and whiskers represents an outlier. *P < 0.05, **P < 0.01. Values represent mean ± s.e.m.; two-tailed Student’s t-test.
Fig. 3 |
Fig. 3 |. DDR1-dependent ECM remodelling inhibits anti-tumour immune infiltration.
a, ELISA of collagen binding of wild-type and mutant DDR1-ECD from E0771 Ddr1-KO cells (n = 4 technical repeats). Three biological repeats. All P values were compared to the wild-type ECD. ***P < 0.001. EV, empty vector. b, Growth of E0771 Ddr1-KO tumour cells with empty vector, ECD WT or point mutants (KO + EV, n = 8 tumours; KO + WT ECD, n = 10 tumours; KO + mutant ECD, n = 6 tumours). All P values were compared to the wild-type ECD group. *P < 0.05, ***P < 0.001. c, Decellularized ECM from E0771 tumour cells inhibits T cell migration. Value of migrated CD8+ T cell number without ECM and CCL12 is set at ‘1’ (n = 4 technical repeats). Three biological repeats. d, E0771 tumours transplanted from Rag1−/− to C57BL/6 hosts were analysed by SHG, To-pro-3 staining for all nuclei, and collagen fibre individualization. Block arrows indicate tumour margins. Scale bar, 50 μm. e, Quantification of CD3+ T cells by IHC (WT, n = 7 tumours; KO, n = 7 tumours). f, g, Tumour fibre alignment (f) and fibre length (g) by the CT-Fire software (n = 5 tumours per group). Values represent mean ± s.e.m. P values as indicated; NS, not significant; two-tailed Student’s t-test for all tests except for tumour volumes (two-way ANOVA).
Fig. 4 |
Fig. 4 |. DDR1 as a therapeutic target for tumour immunotherapy.
a, Growth of E0771 Ddr1-KO tumour cells with huDDR1 in C57BL/6 hosts treated intratumorally with isotype IgG (control (ctrl); n = 17 tumours) or with anti-DDR1 antibody clone 9 (no. 9; n = 18 tumours). b, MMTV-PyMT spontaneous mammary tumour growth (accumulative tumour volume per mouse, C57BL/6), treated intraperitoneally in a ‘post-tumour’ scheme with control (n = 7 mice) or anti-DDR1 clone 9 antibody (n = 8 mice). c, d, CD8+ (c) and CD4+ (d) TILs from E07771 huDDR1-expressing Ddr1-KO tumours in b, normalized by per-gram tumour (n = 4 tumours per group). e, Antibody-treated E0771 tumours analysed by SHG, To-pro-3 staining, and collagen fibre individualization. Block arrows indicate tumour margins. Scale bar, 50 μm. f, g, Fibre alignment (f) and fibre length (g) (margin ctrl, n = 6 tumours; margin no. 9, n = 5 tumours; core ctrl, n = 4 tumours; core no. 9, n = 4 tumours). h, CD3+ T cells in antibody-treated KO + huDDR1 E0771 tumours (ctrl, n = 10 tumours; no. 9, n = 9 tumours). i, DDR1-ECD (blue oval)-remodelled collagen fibres (red curvy lines) forming an immune-excluding barrier. The intracellular region of DDR1 (yellow ovals) triggers downstream signal transduction. Values represent mean ± s.e.m. P values as indicated; two-tailed Student’s t-test for all tests except for tumour volumes (two-way ANOVA).

Comment in

References

    1. Gruosso T et al. Spatially distinct tumor immune microenvironments stratify triple-negative breast cancers. J. Clin. Invest. 129, 1785–1800 (2019). - PMC - PubMed
    1. Cox TR The matrix in cancer. Nat. Rev. Cancer 21, 217–238 (2021). - PubMed
    1. Bejarano L, Jordao MJC & Joyce JA Therapeutic targeting of the tumor microenvironment. Cancer Discov. 11, 933–959 (2021). - PubMed
    1. Chen Y et al. Type I collagen deletion in αSMA+ myofibroblasts augments immune suppression and accelerates progression of pancreatic cancer. Cancer Cell 39, 548–565 (2021). - PMC - PubMed
    1. Leitinger B Discoidin domain receptor functions in physiological and pathological conditions. Int. Rev. Cell Mol. Biol. 310, 39–87 (2014). - PMC - PubMed

Publication types

MeSH terms