

Multifractal Functional Connectivity Analysis of Electroencephalogram Reveals Reorganization of Brain Networks in a Visual Pattern Recognition Paradigm
- PMID: 34733145
- PMCID: PMC8558231
- DOI: 10.3389/fnhum.2021.740225
Multifractal Functional Connectivity Analysis of Electroencephalogram Reveals Reorganization of Brain Networks in a Visual Pattern Recognition Paradigm
Abstract
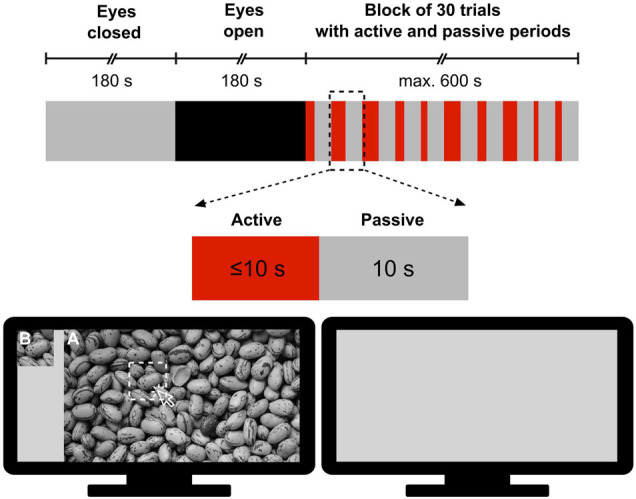
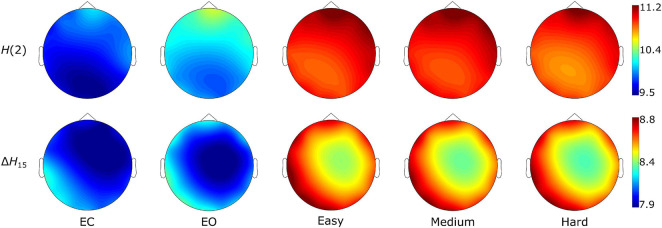
The human brain consists of anatomically distant neuronal assemblies that are interconnected via a myriad of synapses. This anatomical network provides the neurophysiological wiring framework for functional connectivity (FC), which is essential for higher-order brain functions. While several studies have explored the scale-specific FC, the scale-free (i.e., multifractal) aspect of brain connectivity remains largely neglected. Here we examined the brain reorganization during a visual pattern recognition paradigm, using bivariate focus-based multifractal (BFMF) analysis. For this study, 58 young, healthy volunteers were recruited. Before the task, 3-3 min of resting EEG was recorded in eyes-closed (EC) and eyes-open (EO) states, respectively. The subsequent part of the measurement protocol consisted of 30 visual pattern recognition trials of 3 difficulty levels graded as Easy, Medium, and Hard. Multifractal FC was estimated with BFMF analysis of preprocessed EEG signals yielding two generalized Hurst exponent-based multifractal connectivity endpoint parameters, H(2) and ΔH 15; with the former indicating the long-term cross-correlation between two brain regions, while the latter captures the degree of multifractality of their functional coupling. Accordingly, H(2) and ΔH 15 networks were constructed for every participant and state, and they were characterized by their weighted local and global node degrees. Then, we investigated the between- and within-state variability of multifractal FC, as well as the relationship between global node degree and task performance captured in average success rate and reaction time. Multifractal FC increased when visual pattern recognition was administered with no differences regarding difficulty level. The observed regional heterogeneity was greater for ΔH 15 networks compared to H(2) networks. These results show that reorganization of scale-free coupled dynamics takes place during visual pattern recognition independent of difficulty level. Additionally, the observed regional variability illustrates that multifractal FC is region-specific both during rest and task. Our findings indicate that investigating multifractal FC under various conditions - such as mental workload in healthy and potentially in diseased populations - is a promising direction for future research.
Keywords: brain networks; electroencephalography; functional connectivity; multifractal; visual pattern recognition.
Copyright © 2021 Stylianou, Racz, Kim, Kaposzta, Czoch, Yabluchanskiy, Eke and Mukli.
Conflict of interest statement
The authors declare that the research was conducted in the absence of any commercial or financial relationships that could be construed as a potential conflict of interest.
Figures


Similar articles
-
Scale-Free Coupled Dynamics in Brain Networks Captured by Bivariate Focus-Based Multifractal Analysis.Front Physiol. 2021 Feb 3;11:615961. doi: 10.3389/fphys.2020.615961. eCollection 2020. Front Physiol. 2021. PMID: 33613302 Free PMC article.
-
Multifractal Dynamic Functional Connectivity in the Resting-State Brain.Front Physiol. 2018 Nov 30;9:1704. doi: 10.3389/fphys.2018.01704. eCollection 2018. Front Physiol. 2018. PMID: 30555345 Free PMC article.
-
Multifractal dynamics of resting-state functional connectivity in the prefrontal cortex.Physiol Meas. 2018 Feb 28;39(2):024003. doi: 10.1088/1361-6579/aaa916. Physiol Meas. 2018. PMID: 29350187
-
Characterizing Rapid Fluctuations of Resting State Functional Connectivity in Demyelinating, Neurodegenerative, and Psychiatric Conditions: From Static to Time-Varying Analysis.Front Neurosci. 2019 Jul 10;13:618. doi: 10.3389/fnins.2019.00618. eCollection 2019. Front Neurosci. 2019. PMID: 31354402 Free PMC article. Review.
-
Using resting state functional connectivity to unravel networks of tinnitus.Hear Res. 2014 Jan;307:153-62. doi: 10.1016/j.heares.2013.07.010. Epub 2013 Jul 26. Hear Res. 2014. PMID: 23895873 Review.
Cited by
-
Real-Time Algorithm for Detrended Cross-Correlation Analysis of Long-Range Coupled Processes.Front Physiol. 2022 Mar 11;13:817268. doi: 10.3389/fphys.2022.817268. eCollection 2022. Front Physiol. 2022. PMID: 35360238 Free PMC article.
-
Resting-state fractal brain connectivity is associated with impaired cognitive performance in healthy aging.Geroscience. 2024 Feb;46(1):473-489. doi: 10.1007/s11357-023-00836-z. Epub 2023 Jul 17. Geroscience. 2024. PMID: 37458934 Free PMC article.
-
Postural control in gymnasts: anisotropic fractal scaling reveals proprioceptive reintegration in vestibular perturbation.Front Netw Physiol. 2024 Apr 18;4:1393171. doi: 10.3389/fnetp.2024.1393171. eCollection 2024. Front Netw Physiol. 2024. PMID: 38699200 Free PMC article.
-
Fingerprints of decreased cognitive performance on fractal connectivity dynamics in healthy aging.Geroscience. 2024 Feb;46(1):713-736. doi: 10.1007/s11357-023-01022-x. Epub 2023 Dec 20. Geroscience. 2024. PMID: 38117421 Free PMC article.
-
Multiple-Resampling Cross-Spectral Analysis: An Unbiased Tool for Estimating Fractal Connectivity With an Application to Neurophysiological Signals.Front Physiol. 2022 Mar 7;13:817239. doi: 10.3389/fphys.2022.817239. eCollection 2022. Front Physiol. 2022. PMID: 35321422 Free PMC article.
References
-
- Ashkenazy Y., Havlin S., Ivanov P. C., Peng C.-K., Schulte-Frohlinde V., Stanley H. E. (2003). Magnitude and sign scaling in power-law correlated time series. Physica A 323 19–41. 10.1016/S0378-4371(03)00008-6 - DOI
-
- Benjamini Y., Hochberg Y. (1995). Controlling the false discovery rate: a practical and powerful approach to multiple testing. J. R. Stat. Soc. Ser. B (Methodol.). 57 289–300. 10.1111/j.2517-6161.1995.tb02031.x - DOI
Grants and funding
LinkOut - more resources
Full Text Sources