

Extrapolation of Ventricular Activation Times From Sparse Electroanatomical Data Using Graph Convolutional Neural Networks
- PMID: 34733172
- PMCID: PMC8558498
- DOI: 10.3389/fphys.2021.694869
Extrapolation of Ventricular Activation Times From Sparse Electroanatomical Data Using Graph Convolutional Neural Networks
Abstract
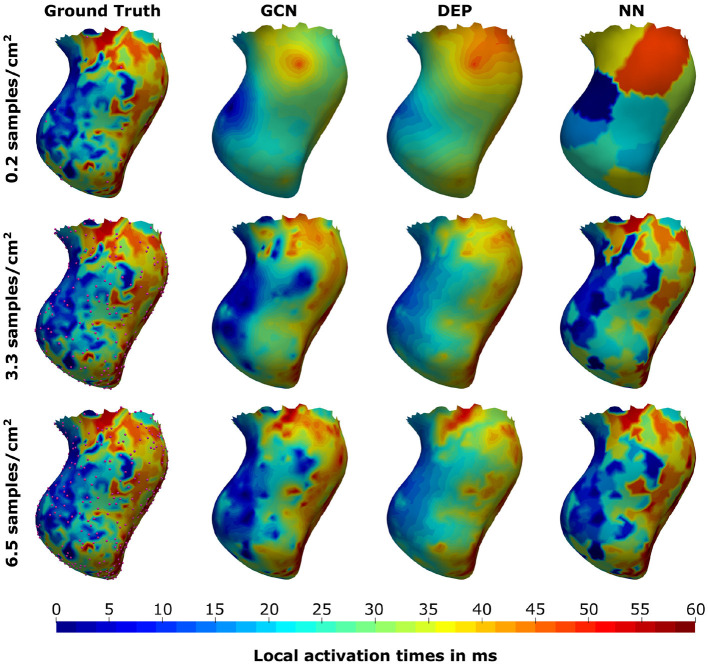
Electroanatomic mapping is the gold standard for the assessment of ventricular tachycardia. Acquiring high resolution electroanatomic maps is technically challenging and may require interpolation methods to obtain dense measurements. These methods, however, cannot recover activation times in the entire biventricular domain. This work investigates the use of graph convolutional neural networks to estimate biventricular activation times from sparse measurements. Our method is trained on more than 15,000 synthetic examples of realistic ventricular depolarization patterns generated by a computational electrophysiology model. Using geometries sampled from a statistical shape model of biventricular anatomy, diverse wave dynamics are induced by randomly sampling scar and border zone distributions, locations of initial activation, and tissue conduction velocities. Once trained, the method accurately reconstructs biventricular activation times in left-out synthetic simulations with a mean absolute error of 3.9 ms ± 4.2 ms at a sampling density of one measurement sample per cm2. The total activation time is matched with a mean error of 1.4 ms ± 1.4 ms. A significant decrease in errors is observed in all heart zones with an increased number of samples. Without re-training, the network is further evaluated on two datasets: (1) an in-house dataset comprising four ischemic porcine hearts with dense endocardial activation maps; (2) the CRT-EPIGGY19 challenge data comprising endo- and epicardial measurements of 5 infarcted and 6 non-infarcted swines. In both setups the neural network recovers biventricular activation times with a mean absolute error of less than 10 ms even when providing only a subset of endocardial measurements as input. Furthermore, we present a simple approach to suggest new measurement locations in real-time based on the estimated uncertainty of the graph network predictions. The model-guided selection of measurement locations allows to reduce by 40% the number of measurements required in a random sampling strategy, while achieving the same prediction error. In all the tested scenarios, the proposed approach estimates biventricular activation times with comparable or better performance than a personalized computational model and significant runtime advantages.
Keywords: cardiac computational modeling; deep learning; electroanatomic mapping; graph convolutional networks; sparse measurements.
Copyright © 2021 Meister, Passerini, Audigier, Lluch, Mihalef, Ashikaga, Maier, Halperin and Mansi.
Conflict of interest statement
TP, CA, ÈL, VM, and TM are employees of Siemens Healthineers. FM's research is funded by Siemens Healthineers. The remaining authors declare that the research was conducted in the absence of any commercial or financial relationships that could be construed as a potential conflict of interest.
Figures


Similar articles
-
Construction of 3D MR image-based computer models of pathologic hearts, augmented with histology and optical fluorescence imaging to characterize action potential propagation.Med Image Anal. 2012 Feb;16(2):505-23. doi: 10.1016/j.media.2011.11.007. Epub 2011 Dec 6. Med Image Anal. 2012. PMID: 22209561
-
Physics-driven learning of x-ray skin dose distribution in interventional procedures.Med Phys. 2019 Oct;46(10):4654-4665. doi: 10.1002/mp.13758. Epub 2019 Sep 6. Med Phys. 2019. PMID: 31407346
-
Mapping of septal ventricular tachycardia: clinical and experimental correlations.J Thorac Cardiovasc Surg. 1996 Oct;112(4):914-25. doi: 10.1016/S0022-5223(96)70091-0. J Thorac Cardiovasc Surg. 1996. PMID: 8873717
-
Deep convolutional neural network and IoT technology for healthcare.Digit Health. 2024 Jan 17;10:20552076231220123. doi: 10.1177/20552076231220123. eCollection 2024 Jan-Dec. Digit Health. 2024. PMID: 38250147 Free PMC article.
-
Cardiac Magnetic Resonance for Ventricular Tachycardia Ablation and Risk Stratification.Front Cardiovasc Med. 2022 Jan 12;8:797864. doi: 10.3389/fcvm.2021.797864. eCollection 2021. Front Cardiovasc Med. 2022. PMID: 35097017 Free PMC article. Review.
Cited by
-
Manifold Approximating Graph Interpolation of Cardiac Local Activation Time.IEEE Trans Biomed Eng. 2022 Oct;69(10):3253-3264. doi: 10.1109/TBME.2022.3166447. Epub 2022 Sep 19. IEEE Trans Biomed Eng. 2022. PMID: 35404808 Free PMC article.
-
A Review of Personalised Cardiac Computational Modelling Using Electroanatomical Mapping Data.Arrhythm Electrophysiol Rev. 2024 May 20;13:e08. doi: 10.15420/aer.2023.25. eCollection 2024. Arrhythm Electrophysiol Rev. 2024. PMID: 38807744 Free PMC article. Review.
-
Dilated cardiomyopathy evaluation with Imagenomics: combining multimodal cardiovascular imaging and genetics.ESC Heart Fail. 2025 Aug;12(4):2669-2690. doi: 10.1002/ehf2.15307. Epub 2025 Apr 24. ESC Heart Fail. 2025. PMID: 40275589 Free PMC article. Review.
References
-
- Al-Khatib S. M., Stevenson W. G., Ackerman M. J., Bryant W. J., Callans D. J., Curtis A. B., et al. . (2018). 2017 aha/acc/hrs guideline for management of patients with ventricular arrhythmias and the prevention of sudden cardiac death. Circulation 138, e272–e391. 10.1161/CIR.0000000000000549 - DOI - PubMed
-
- Alon U., Yahav E. (2020). On the bottleneck of graph neural networks and its practical implications. arXiv:2006.05205.
-
- Camara O. (2019). Best (and worst) practices for organizing a challenge on cardiac biophysical models during ai summer: the crt-epiggy19 challenge, in International Workshop on Statistical Atlases and Computational Models of the Heart (Cham: Springer; ), 329–341.
LinkOut - more resources
Full Text Sources
Research Materials