. 2021 Oct 18:12:763669.
doi: 10.3389/fmicb.2021.763669. eCollection 2021.

Monitoring the Microevolution of Salmonella enterica in Healthy Dairy Cattle Populations at the Individual Farm Level Using Whole-Genome Sequencing

Affiliations

Monitoring the Microevolution of Salmonella enterica in Healthy Dairy Cattle Populations at the Individual Farm Level Using Whole-Genome Sequencing

Laura M Carroll et al. Front Microbiol. .

Abstract

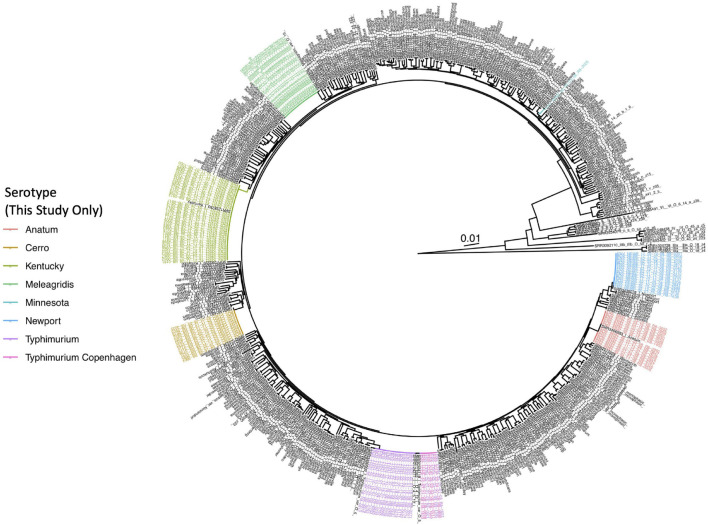
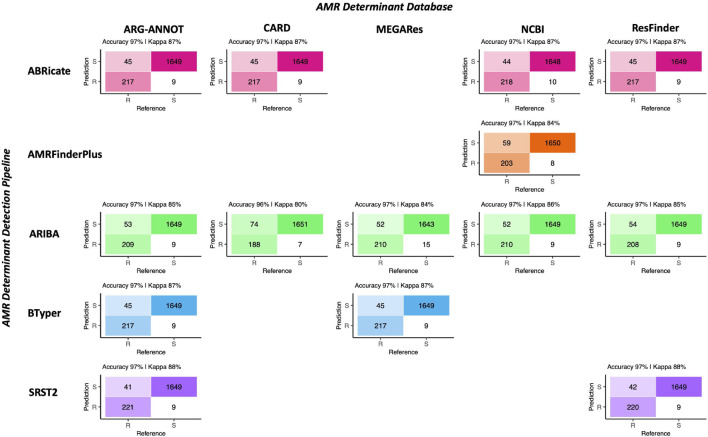
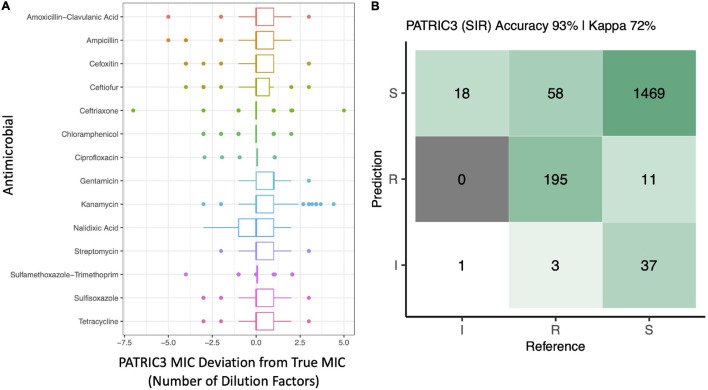
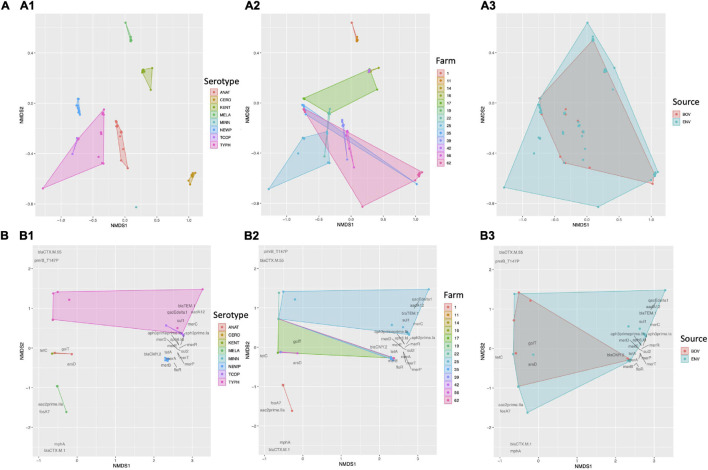
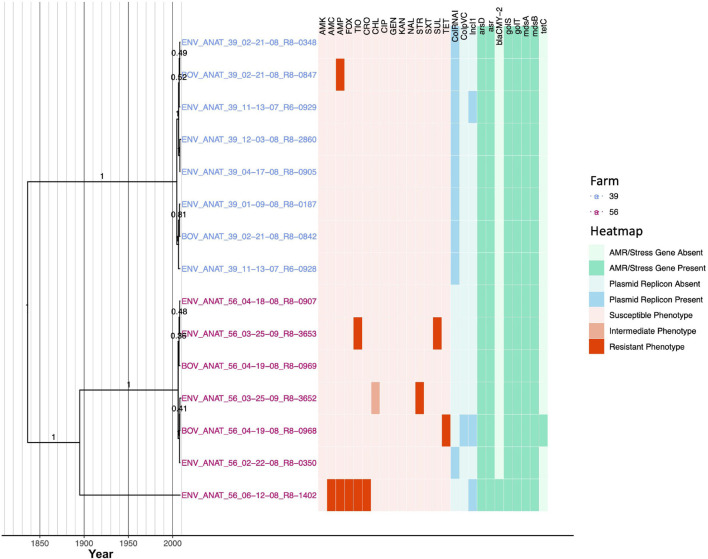
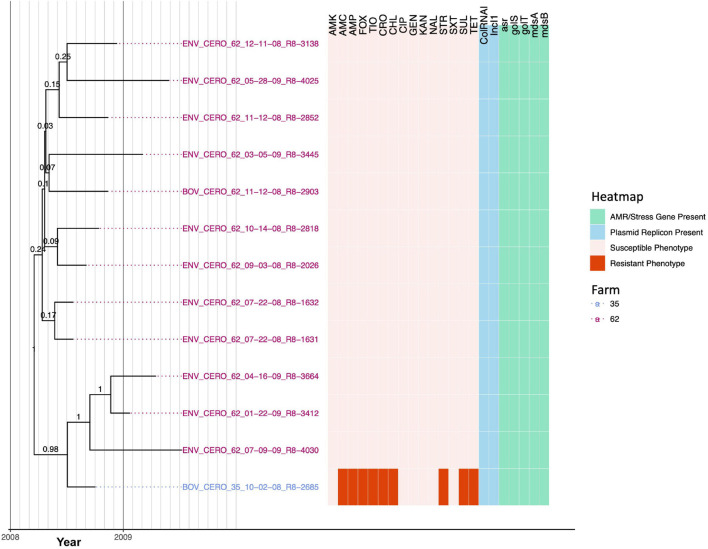
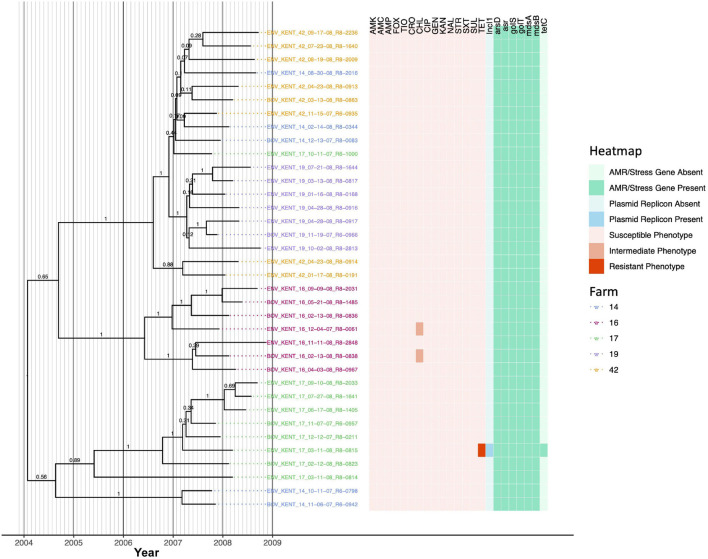
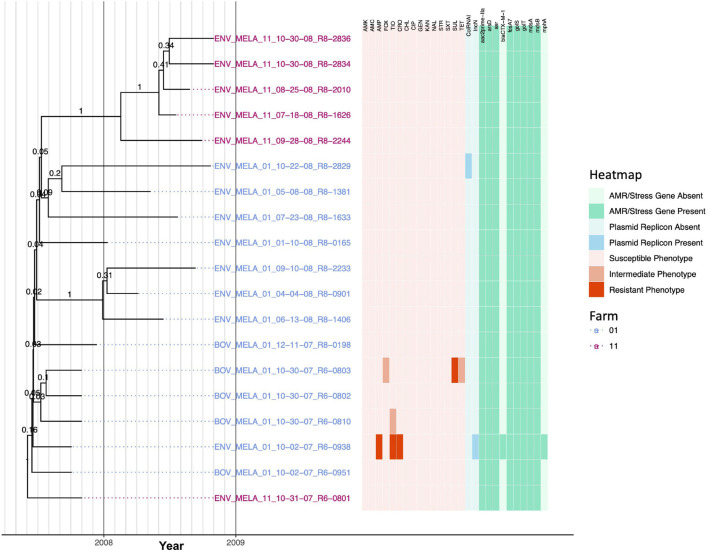
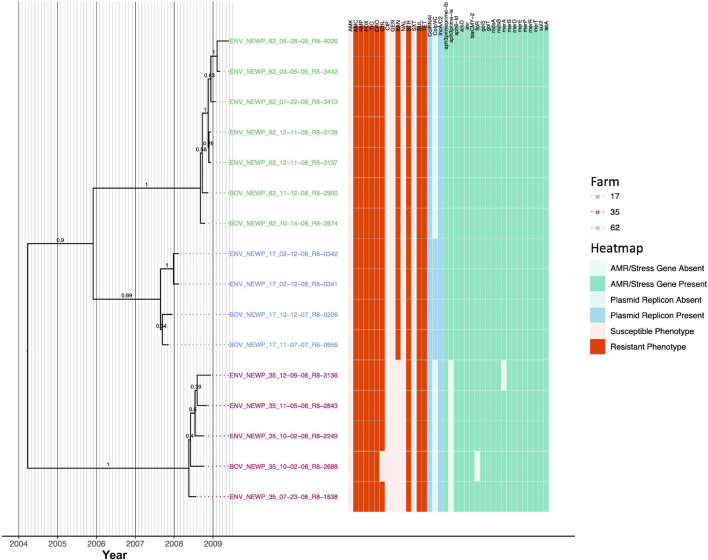
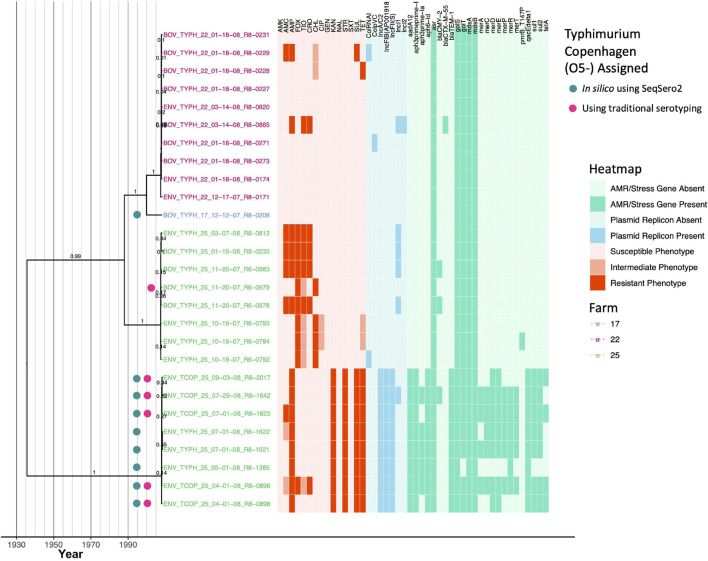
Livestock represent a possible reservoir for facilitating the transmission of the zoonotic foodborne pathogen Salmonella enterica to humans; there is also concern that strains can acquire resistance to antimicrobials in the farm environment. Here, whole-genome sequencing (WGS) was used to characterize Salmonella strains (n = 128) isolated from healthy dairy cattle and their associated environments on 13 New York State farms to assess the diversity and microevolution of this important pathogen at the level of the individual herd. Additionally, the accuracy and concordance of multiple in silico tools are assessed, including: (i) two in silico serotyping tools, (ii) combinations of five antimicrobial resistance (AMR) determinant detection tools and one to five AMR determinant databases, and (iii) one antimicrobial minimum inhibitory concentration (MIC) prediction tool. For the isolates sequenced here, in silico serotyping methods outperformed traditional serotyping and resolved all un-typable and/or ambiguous serotype assignments. Serotypes assigned in silico showed greater congruency with the Salmonella whole-genome phylogeny than traditional serotype assignments, and in silico methods showed high concordance (99% agreement). In silico AMR determinant detection methods additionally showed a high degree of concordance, regardless of the pipeline or database used (≥98% agreement among susceptible/resistant assignments for all pipeline/database combinations). For AMR detection methods that relied exclusively on nucleotide BLAST, accuracy could be maximized by using a range of minimum nucleotide identity and coverage thresholds, with thresholds of 75% nucleotide identity and 50-60% coverage adequate for most pipeline/database combinations. In silico characterization of the microevolution and AMR dynamics of each of six serotype groups (S. Anatum, Cerro, Kentucky, Meleagridis, Newport, Typhimurium/Typhimurium variant Copenhagen) revealed that some lineages were strongly associated with individual farms, while others were distributed across multiple farms. Numerous AMR determinant acquisition and loss events were identified, including the recent acquisition of cephalosporin resistance-conferring bla CMY- and bla CTX-M-type beta-lactamases. The results presented here provide high-resolution insight into the temporal dynamics of AMR Salmonella at the scale of the individual farm and highlight both the strengths and limitations of WGS in tracking zoonotic pathogens and their associated AMR determinants at the livestock-human interface.

Keywords: Salmonella; antimicrobial resistance; dairy cattle; evolution; livestock; serotyping; whole-genome sequencing.


Conflict of interest statement

The authors declare that the research was conducted in the absence of any commercial or financial relationships that could be construed as a potential conflict of interest.

Figures

FIGURE 1
FIGURE 1
Maximum likelihood phylogeny constructed using core SNPs identified among 570 Salmonella isolate genomes. Publicly available genomes are denoted by black tip labels (n = 442), while genomes of bovine- and bovine farm-associated strains isolated in conjunction with this study are denoted by colored tip labels (n = 128). In cases where a discrepancy existed between the traditional serotype designation of an isolate and one or more in silico methods (i.e., SISTR and SeqSero2), the serotype assigned using two out of the three methods was selected as the final serotype to be used for phylogeny annotation. The phylogeny is rooted at the midpoint with branch lengths reported in substitutions per site. Core SNPs were identified among all genomes using kSNP3, while the phylogeny was constructed and annotated using IQ-TREE and bactaxR/ggtree, respectively.
FIGURE 2
FIGURE 2
Confusion matrices showcasing agreement between susceptible-intermediate-resistant (SIR) classification of 128 Salmonella isolates obtained using phenotypic resistance testing (denoted as the matrix “Reference”) and five in silico methods (denoted as the matrix “Prediction”) for 15 antimicrobials. Accuracy values above each matrix denote the percentage of correctly classified instances out of all instances. Kappa values above each matrix denote Cohen’s kappa coefficient for the matrix, reported as a percent. For the phenotypic method, SIR classification was determined using NARMS breakpoints for Salmonella (accessed March 23, 2020). For the in silico antimicrobial resistance (AMR) determinant detection approaches, combinations of five pipelines and one to five AMR determinant databases were tested; isolate genomes that harbored one or more AMR determinants previously known to confer resistance to a particular antimicrobial were categorized as resistant to that antimicrobial (“R”), while those which did not were categorized as susceptible (“S”; see Supplementary Table 2 for all detected AMR determinants and their associated resistance classifications). For all AMR determinant detection methods, isolates that showed intermediate phenotypic resistance to an antimicrobial were categorized as susceptible (“S”) rather than resistant, as this classification produced slightly better accuracy scores for all pipeline/database combinations. For AMR determinant detection methods that relied on nucleotide BLAST (i.e., ABRicate and BTyper), the confusion matrix obtained using the nucleotide identity and coverage threshold combination that produced the highest accuracy are shown (Supplementary Figure 3); for all other methods, confusion matrices obtained using default detection parameters are shown.
FIGURE 3
FIGURE 3
(A) Deviation of PATRIC3 predicted minimum inhibitory concentration (MIC) values from “true” MIC values obtained using phenotypic resistance testing for 14 antimicrobials (Y-axis), reported in number of dilution factors (X-axis). For each box plot, lower and upper box hinges correspond to the first and third quartiles, respectively. Lower and upper whiskers extend from the hinge to the smallest and largest values no more distant than 1.5 times the interquartile range from the hinge, respectively. Points represent pairwise distances that fall beyond the ends of the whiskers. Only isolates with raw MIC values available are included (126 of 128 isolates). (B) Confusion matrix showcasing agreement between susceptible-intermediate-resistant (SIR) classification of all 128 Salmonella isolates obtained using phenotypic resistance testing (denoted as the matrix “Reference”) and PATRIC3 (denoted as the matrix “Prediction”) for 14 antimicrobials. The accuracy value above the matrix denotes the percentage of correctly classified instances out of all instances. The Kappa value above the matrix denotes Cohen’s kappa coefficient for the matrix, reported as a percent. For both the phenotypic and PATRIC3 methods, SIR classification was determined using NARMS breakpoints for Salmonella (accessed March 23, 2020).
FIGURE 4
FIGURE 4
Results of non-metric multidimensional scaling (NMDS) performed using the presence and absence of (A) pan-genome elements (n = 4,102; identified using Roary), and (B) antimicrobial resistance (AMR) and stress response genes (n = 28; detected using AMRFinderPlus) among 128 bovine-associated Salmonella isolates, plotted in two dimensions. Points represent isolates, while shaded regions and convex hulls correspond to isolate (1) serotypes (ANAT, Anatum; CERO, Cerro; KENT, Kentucky; MELA, Meleagridis; NEWP, Newport; TCOP, Typhimurium Copenhagen; TYPH, Typhimurium), (2) farm, and (3) source (BOV, bovine; ENV, bovine farm environment). For all plots, a Jaccard distance metric was used. For AMR/stress response genes (B), gene names/scores are plotted in dark gray text.
FIGURE 5
FIGURE 5
Rooted, time-scaled maximum clade credibility (MCC) phylogeny constructed using core SNPs identified among 15 Salmonella Anatum genomes isolated from subclinical bovine sources and the surrounding bovine farm environment. Tip label colors denote the ID of the farm from which each strain was isolated. Branch labels denote posterior probabilities of branch support. Time in years is plotted along the X-axis, and branch lengths are reported in years. The heatmap to the right of the phylogeny denotes (i) the susceptible-intermediate-resistant (SIR) classification of each isolate for each of 15 antimicrobials (obtained using phenotypic testing and NARMS breakpoints; orange); (ii) presence and absence of plasmid replicons (detected using ABRicate/PlasmidFinder and minimum nucleotide identity and coverage thresholds of 80 and 60%, respectively; blue); (iii) presence and absence of antimicrobial resistance (AMR) and stress response genes (identified using AMRFinderPlus and default parameters; green). Core SNPs were identified using Snippy. The phylogeny was constructed using the results of ten independent runs using a strict clock model, the Standard_TVMef nucleotide substitution model, and the Coalescent Bayesian Skyline population model implemented in BEAST version 2.5.1, with 10% burn-in applied to each run. LogCombiner-2 was used to combine BEAST 2 log files, and TreeAnnotator-2 was used to construct the phylogeny using median node heights. Abbreviations for the 15 antimicrobials are: AMK, amikacin; AMC, amoxicillin-clavulanic acid; AMP, ampicillin; FOX, cefoxitin; TIO, ceftiofur; CRO, ceftriaxone; CHL, chloramphenicol; CIP, ciprofloxacin; GEN, gentamicin; KAN, kanamycin; NAL, nalidixic acid; STR, streptomycin; SXT, sulfamethoxazole-trimethoprim; SUL, sulfisoxazole; TET, tetracycline.
FIGURE 6
FIGURE 6
Rooted, time-scaled maximum clade credibility (MCC) phylogeny constructed using core SNPs identified among 13 Salmonella Cerro genomes isolated from subclinical bovine sources and the surrounding bovine farm environment. Tip label colors denote the ID of the farm from which each strain was isolated. Branch labels denote posterior probabilities of branch support. Time in years is plotted along the X-axis, and branch lengths are reported in years. The heatmap to the right of the phylogeny denotes (i) the susceptible-intermediate-resistant (SIR) classification of each isolate for each of 15 antimicrobials (obtained using phenotypic testing and NARMS breakpoints; orange); (ii) presence of plasmid replicons (detected using ABRicate/PlasmidFinder and minimum nucleotide identity and coverage thresholds of 80 and 60%, respectively; blue); (iii) presence of antimicrobial resistance (AMR) and stress response genes (identified using AMRFinderPlus and default parameters; green). Core SNPs were identified using Snippy. The phylogeny was constructed using the results of ten independent runs using a strict clock model, the Standard_TPM1 nucleotide substitution model, and the Coalescent Bayesian Skyline population model implemented in BEAST version 2.5.1, with 10% burn-in applied to each run. LogCombiner-2 was used to combine BEAST 2 log files, and TreeAnnotator-2 was used to construct the phylogeny using common ancestor node heights. Abbreviations for the 15 antimicrobials are: AMK, amikacin; AMC, amoxicillin-clavulanic acid; AMP, ampicillin; FOX, cefoxitin; TIO, ceftiofur; CRO, ceftriaxone; CHL, chloramphenicol; CIP, ciprofloxacin; GEN, gentamicin; KAN, kanamycin; NAL, nalidixic acid; STR, streptomycin; SXT, sulfamethoxazole-trimethoprim; SUL, sulfisoxazole; TET, tetracycline.
FIGURE 7
FIGURE 7
Rooted, time-scaled maximum clade credibility (MCC) phylogeny constructed using core SNPs identified among 36 Salmonella Kentucky genomes isolated from subclinical bovine sources and the surrounding bovine farm environment. Tip label colors denote the ID of the farm from which each strain was isolated. Branch labels denote posterior probabilities of branch support. Time in years is plotted along the X-axis, and branch lengths are reported in years. The heatmap to the right of the phylogeny denotes (i) the susceptible-intermediate-resistant (SIR) classification of each isolate for each of 15 antimicrobials (obtained using phenotypic testing and NARMS breakpoints; orange); (ii) presence of plasmid replicons (detected using ABRicate/PlasmidFinder and minimum nucleotide identity and coverage thresholds of 80 and 60%, respectively; blue); (iii) presence of antimicrobial resistance (AMR) and stress response genes (identified using AMRFinderPlus and default parameters; green). Core SNPs were identified using Snippy. The phylogeny was constructed using the results of ten independent runs using a relaxed lognormal clock model, the Standard_TVMef nucleotide substitution model, and the Coalescent Bayesian Skyline population model implemented in BEAST version 2.5.1, with 10% burn-in applied to each run. LogCombiner-2 was used to combine BEAST 2 log files, and TreeAnnotator-2 was used to construct the phylogeny using common ancestor node heights. Abbreviations for the 15 antimicrobials are: AMK, amikacin; AMC, amoxicillin-clavulanic acid; AMP, ampicillin; FOX, cefoxitin; TIO, ceftiofur; CRO, ceftriaxone; CHL, chloramphenicol; CIP, ciprofloxacin; GEN, gentamicin; KAN, kanamycin; NAL, nalidixic acid; STR, streptomycin; SXT, sulfamethoxazole-trimethoprim; SUL, sulfisoxazole; TET, tetracycline.
FIGURE 8
FIGURE 8
Rooted, time-scaled maximum clade credibility (MCC) phylogeny constructed using core SNPs identified among 19 Salmonella Meleagridis genomes isolated from subclinical bovine sources and the surrounding bovine farm environment. Tip label colors denote the ID of the farm from which each strain was isolated. Branch labels denote posterior probabilities of branch support. Time in years is plotted along the X-axis, and branch lengths are reported in years. The heatmap to the right of the phylogeny denotes (i) the susceptible-intermediate-resistant (SIR) classification of each isolate for each of 15 antimicrobials (obtained using phenotypic testing and NARMS breakpoints; orange); (ii) presence and absence of plasmid replicons (detected using ABRicate/PlasmidFinder and minimum nucleotide identity and coverage thresholds of 80 and 60%, respectively; blue); (iii) presence and absence of antimicrobial resistance (AMR) and stress response genes (identified using AMRFinderPlus and default parameters; green). Core SNPs were identified using Snippy. The phylogeny was constructed using the results of ten independent runs using a strict clock model, the Standard_TPM2 nucleotide substitution model, and the Coalescent Bayesian Skyline population model implemented in BEAST version 2.5.1, with 10% burn-in applied to each run. LogCombiner-2 was used to combine BEAST 2 log files, and TreeAnnotator-2 was used to construct the phylogeny using common ancestor node heights. Abbreviations for the 15 antimicrobials are: AMK, amikacin; AMC, amoxicillin-clavulanic acid; AMP, ampicillin; FOX, cefoxitin; TIO, ceftiofur; CRO, ceftriaxone; CHL, chloramphenicol; CIP, ciprofloxacin; GEN, gentamicin; KAN, kanamycin; NAL, nalidixic acid; STR, streptomycin; SXT, sulfamethoxazole-trimethoprim; SUL, sulfisoxazole; TET, tetracycline.
FIGURE 9
FIGURE 9
Rooted, time-scaled maximum clade credibility (MCC) phylogeny constructed using core SNPs identified among 16 Salmonella Newport genomes isolated from subclinical bovine sources and the surrounding bovine farm environment. Tip label colors denote the ID of the farm from which each strain was isolated. Branch labels denote posterior probabilities of branch support. Time in years is plotted along the X-axis, and branch lengths are reported in years. The heatmap to the right of the phylogeny denotes (i) the susceptible-intermediate-resistant (SIR) classification of each isolate for each of 15 antimicrobials (obtained using phenotypic testing and NARMS breakpoints; orange); (ii) presence and absence of plasmid replicons (detected using ABRicate/PlasmidFinder and minimum nucleotide identity and coverage thresholds of 80 and 60%, respectively; blue); (iii) presence and absence of antimicrobial resistance (AMR) and stress response genes (identified using AMRFinderPlus and default parameters; green). Core SNPs were identified using Snippy. The phylogeny was constructed using the results of ten independent runs using a relaxed lognormal clock model, the Standard_TPM1 nucleotide substitution model, and the Coalescent Bayesian Skyline population model implemented in BEAST version 2.5.1, with 10% burn-in applied to each run. LogCombiner-2 was used to combine BEAST 2 log files, and TreeAnnotator-2 was used to construct the phylogeny using common ancestor node heights. Abbreviations for the 15 antimicrobials are: AMK, amikacin; AMC, amoxicillin-clavulanic acid; AMP, ampicillin; FOX, cefoxitin; TIO, ceftiofur; CRO, ceftriaxone; CHL, chloramphenicol; CIP, ciprofloxacin; GEN, gentamicin; KAN, kanamycin; NAL, nalidixic acid; STR, streptomycin; SXT, sulfamethoxazole-trimethoprim; SUL, sulfisoxazole; TET, tetracycline.
FIGURE 10
FIGURE 10
Rooted, time-scaled maximum clade credibility (MCC) phylogeny constructed using core SNPs identified among 27 Salmonella Typhimurium and Typhimurium Copenhagen genomes isolated from subclinical bovine sources and the surrounding bovine farm environment. Tip label colors denote the ID of the farm from which each strain was isolated. Circles to the left of tip labels denote isolates that were assigned to the Typhimurium Copenhagen variant of S. Typhimurium using SeqSero2 (teal) and/or traditional serotyping (pink). Branch labels denote posterior probabilities of branch support. Time in years is plotted along the X-axis, and branch lengths are reported in years. The heatmap to the right of the phylogeny denotes (i) the susceptible-intermediate-resistant (SIR) classification of each isolate for each of 15 antimicrobials (obtained using phenotypic testing and NARMS breakpoints; orange); (ii) presence and absence of plasmid replicons (detected using ABRicate/PlasmidFinder and minimum nucleotide identity and coverage thresholds of 80 and 60%, respectively; blue); (iii) presence and absence of antimicrobial resistance (AMR) and stress response genes (identified using AMRFinderPlus and default parameters; green). Core SNPs were identified using Snippy. The phylogeny was constructed using the results of ten independent runs using a relaxed lognormal clock model, the Standard_TPM1 nucleotide substitution model, and the Coalescent Bayesian Skyline population model implemented in BEAST version 2.5.1, with 10% burn-in applied to each run. LogCombiner-2 was used to combine BEAST 2 log files, and TreeAnnotator-2 was used to construct the phylogeny using common ancestor node heights. Abbreviations for the 15 antimicrobials are: AMK, amikacin; AMC, amoxicillin-clavulanic acid; AMP, ampicillin; FOX, cefoxitin; TIO, ceftiofur; CRO, ceftriaxone; CHL, chloramphenicol; CIP, ciprofloxacin; GEN, gentamicin; KAN, kanamycin; NAL, nalidixic acid; STR, streptomycin; SXT, sulfamethoxazole-trimethoprim; SUL, sulfisoxazole; TET, tetracycline.

References

    1. Aarestrup F. M. (2015). The livestock reservoir for antimicrobial resistance: a personal view on changing patterns of risks, effects of interventions and the way forward. Philos. Trans. R. Soc. Lond. B Biol. Sci. 370:20140085. 10.1098/rstb.2014.0085 - DOI - PMC - PubMed
    1. Achtman M. (2008). Evolution, population structure, and phylogeography of genetically monomorphic bacterial pathogens. Annu. Rev. Microbiol. 62 53–70. 10.1146/annurev.micro.62.081307.162832 - DOI - PubMed
    1. Afema J. A., Ahmed S., Besser T. E., Jones L. P., Sischo W. M., Davis M. A. (2018). Molecular epidemiology of dairy cattle-associated Escherichia coli carrying blaCTX-M genes in Washington State. Appl. Environ. Microbiol. 84:e02430-17. 10.1128/AEM.02430-17 - DOI - PMC - PubMed
    1. Afema J. A., Mather A. E., Sischo W. M. (2015). Antimicrobial resistance profiles and diversity in Salmonella from humans and Cattle, 2004-2011. Zoonoses Public Health 62 506–517. 10.1111/zph.12172 - DOI - PubMed
    1. Agren E. C., Wahlstrom H., Vesterlund-Carlson C., Lahti E., Melin L., Soderlund R. (2016). Comparison of whole genome sequencing typing results and epidemiological contact information from outbreaks of Salmonella Dublin in Swedish cattle herds. Infect. Ecol. Epidemiol. 6:31782. 10.3402/iee.v6.31782 - DOI - PMC - PubMed