. 2021 Oct 11:10:e61.
doi: 10.1017/jns.2021.49. eCollection 2021.

A genome-wide association study on meat consumption in a Japanese population: the Japan Multi-Institutional Collaborative Cohort study

Affiliations

A genome-wide association study on meat consumption in a Japanese population: the Japan Multi-Institutional Collaborative Cohort study

Yasuyuki Nakamura et al. J Nutr Sci. .

Abstract

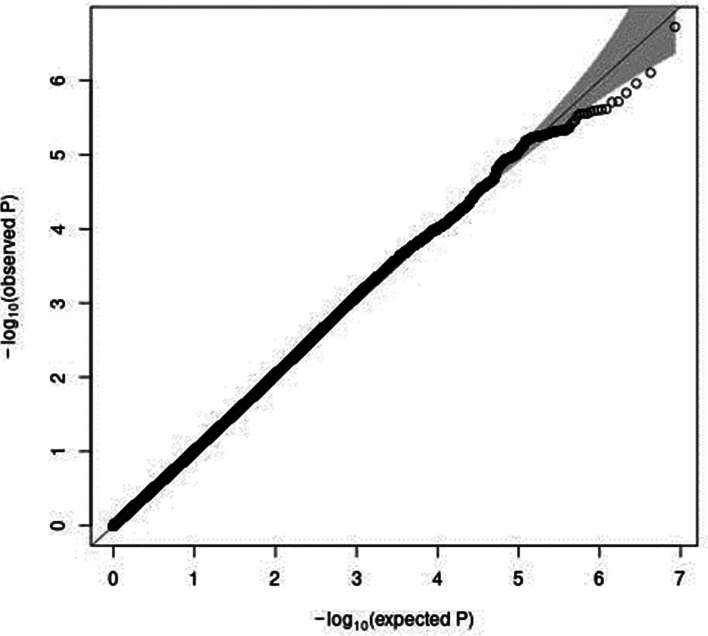
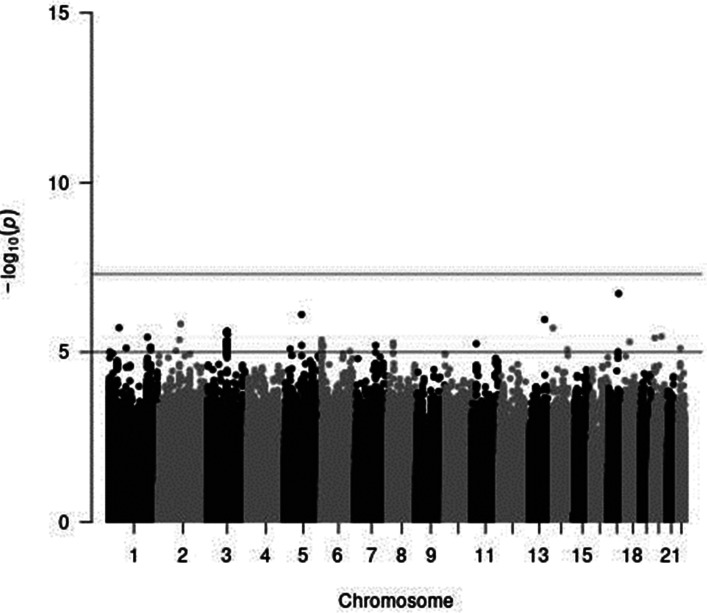
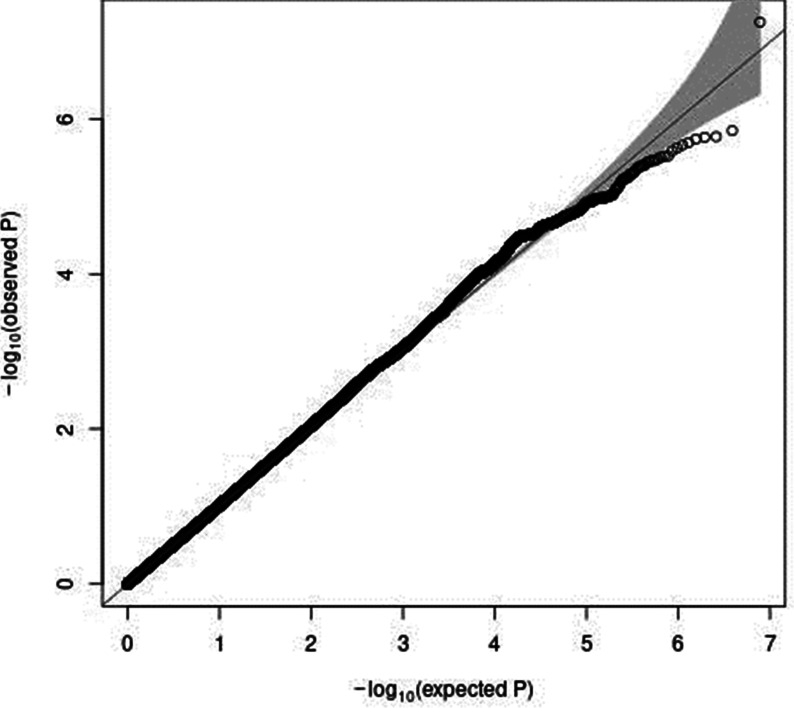
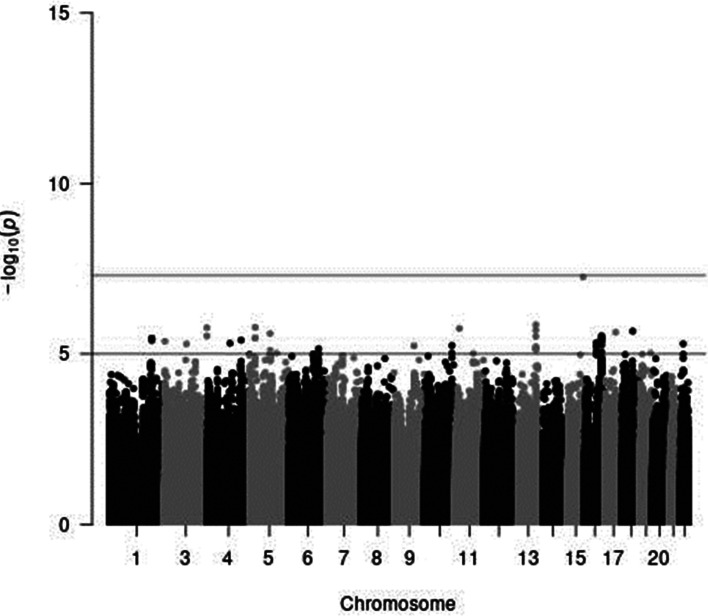
Recent genome-wide association studies (GWAS) on the dietary habits of the Japanese population have shown that an effect rs671 allele was inversely associated with fish consumption, whereas it was directly associated with coffee consumption. Although meat is a major source of protein and fat in the diet, whether genetic factors that influence meat-eating habits in healthy populations are unknown. This study aimed to conduct a GWAS to find genetic variations that affect meat consumption in a Japanese population. We analysed GWAS data using 14 076 participants from the Japan Multi-Institutional Collaborative Cohort (J-MICC) study. We used a semi-quantitative food frequency questionnaire to estimate food intake that was validated previously. Association of the imputed variants with total meat consumption per 1000 kcal energy was performed by linear regression analysis with adjustments for age, sex, and principal component analysis components 1-10. We found that no genetic variant, including rs671, was associated with meat consumption. The previously reported single nucleotide polymorphisms that were associated with meat consumption in samples of European ancestry could not be replicated in our J-MICC data. In conclusion, significant genetic factors that affect meat consumption were not observed in a Japanese population.

Keywords: ALDH2, aldehyde dehydrogenase 2; BMI, body mass index; FFQ, food frequency questionnaire; GWAS, genome-wide association study; Genome-wide association study; J-MICC, Japan Multi-Institutional Collaborative Cohort; Meat consumption; PCA, principal component analysis; Q–Q, quantile–quantile; Rs671; SNP, single nucleotide polymorphism.


Figures

Fig. 1.
Fig. 1.
A Q–Q plot (black) for the GWAS of meat intake (g/1000 kcal per d). The x-axis shows the expected −log10 P-values under the null hypothesis. The y-axis expresses the observed −log10 P-values obtained by a linear regression model using PLINK(27,28). The line represents y = x, which corresponds to the null hypothesis. The grey shaded area expresses the 95 % CI of the null hypothesis. The inflation factor (λ) is the median of the observed test statistics divided by the median of the expected test statistics (λ = 1.0117 [95% CI 1.0010–1.0131]). An R package for creating the Q–Q plot, GWAS tools, was used(37). Chromosomal position (GRCh37/hg19).
Fig. 2.
Fig. 2.
A Manhattan plot of the results from the GWAS of meat intake (g/1000 kcal per d). The x-axis indicates chromosomal positions, and the y-axis represents −log10 P-values obtained by linear model association analysis. The software qqman was used(38). Chromosomal position (GRCh37/hg19).
Fig. 3.
Fig. 3.
A Q–Q plot (black) for the sex-stratified GWAS of meat intake (g/1000 kcal per d) in women. The x-axis shows the expected −log10 P-values under the null hypothesis. The y-axis expresses the observed −log10 P-values obtained by a linear regression model using PLINK(27,28). The line represents y = x, which corresponds to the null hypothesis. The grey shaded area expresses the 95 % CI of the null hypothesis. The inflation factor (λ) is the median of the observed test statistics divided by the median of the expected test statistics. An R package for creating the Q–Q plot, GWAS tools, was used(37). Chromosomal position (GRCh37/hg19).
Fig. 4.
Fig. 4.
A Manhattan plot of the results from the GWAS of meat intake (g/1000 kcal per d) in women. The x-axis indicates chromosomal positions, and the y-axis represents −log10 P-values obtained by linear model association analysis. The software qqman was used(38). Chromosomal position (GRCh37/hg19).

References

    1. Micha R, Wallace SK & Mozaffarian D (2010) Red and processed meat consumption and risk of incident coronary heart disease, stroke, and diabetes mellitus: a systematic review and meta-analysis. Circulation 121, 2271–2283. - PMC - PubMed
    1. Sinha R, Cross AJ, Graubard BI, et al.(2009) Meat intake and mortality: a prospective study of over half a million people. Arch Intern Med 169, 562–571. - PMC - PubMed
    1. Pan A, Sun Q, Bernstein AM, et al.(2011) Red meat consumption and risk of type 2 diabetes: 3 cohorts of US adults and an updated meta-analysis. Am J Clin Nutr 94, 1088–1096. - PMC - PubMed
    1. Aune D, Ursin G & Veierod MB (2009) Meat consumption and the risk of type 2 diabetes: a systematic review and meta-analysis of cohort studies. Diabetologia 52, 2277–2287. - PubMed
    1. Chan DS, Lau R, Aune D, et al.(2011) Red and processed meat and colorectal cancer incidence: meta-analysis of prospective studies. PLoS One 6, e20456. - PMC - PubMed

Publication types