. 2021 Sep;10(9):2313-2324.
doi: 10.21037/tp-21-367.

Postnatal age is strongly correlated with the early development of the gut microbiome in preterm infants

Affiliations

Postnatal age is strongly correlated with the early development of the gut microbiome in preterm infants

Wei Shen et al. Transl Pediatr. 2021 Sep.

Abstract

Background: The gut microbiome plays a potential role in clinical events in preterm infants and may affect their lateral development. Understanding the initial colonization of microbes in the gut, their early dynamic changes, and the major factors correlated with these changes would provide crucial information about the developmental process in early life.

Methods: The present study enrolled 151 preterm infants and examined the longitudinal dynamics of their fecal microbiome profiles during the period of hospitalization using 16S ribosomal RNA gene sequencing. Random forest modeling was used to predict postnatal age (Age), postmenstrual age (PMA), and gestational age (GA), using gut microbiome features.

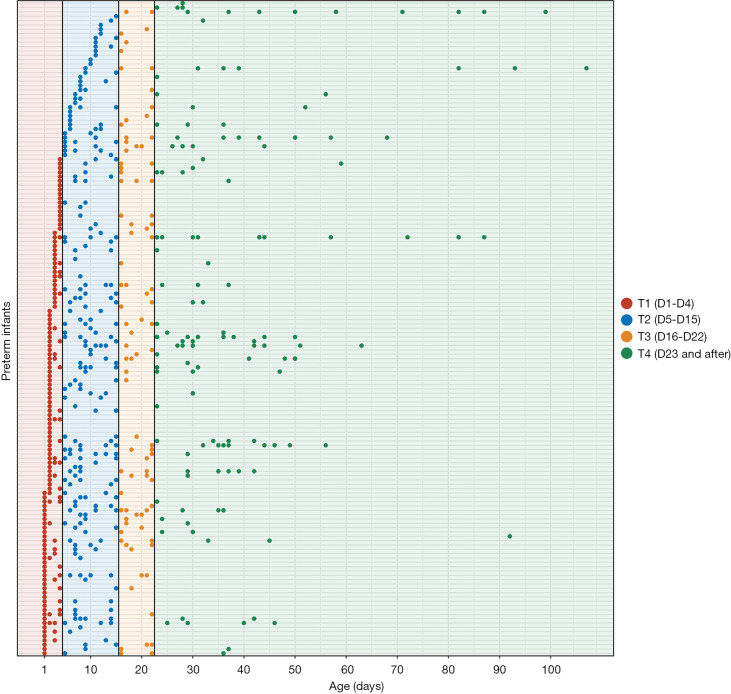
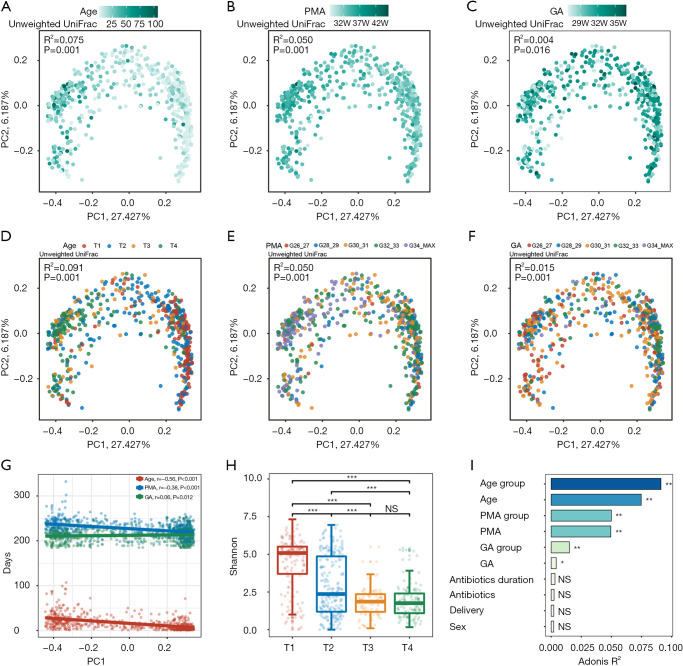
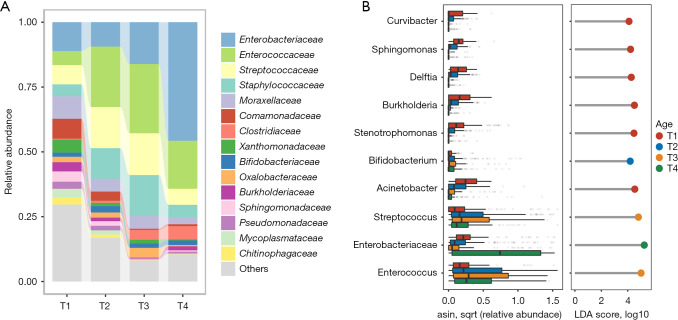
Results: Principal coordinate analysis revealed that the gut microbiome of the preterm infants displayed an obvious time-dependent change pattern, which showed the strongest association with Age, followed by PMA, and a much weaker association with (GA). Random forest modeling further evidenced the time-dependent change pattern, with the Pearson's correlation coefficients between the actual values and the gut microbiome-predicted values being 0.68, 0.53, and 0.38 for postnatal, postmenstrual, and gestational age, respectively. The microbiome dynamism could be further divided into four Age stages, each with its own characteristic microbial taxa. The first 1-4 days (T1 stage) represented the meconium microbiome, with colonization of a high diversity of microbes before or during delivery. During 5-15 days (T2 stage), the gut microbiome of the preterm infants underwent a rapid turnover, in which microbial diversity declined, and stabilized afterward. Enterobacteriaceae, Enterococcaceae, Streptococcaceae, Staphylococcaceae, and Clostridiaceae were the major classes in the gut microbiome in the lateral stages of development (T3-T4 stage).

Conclusions: Postnatal age, rather than the gestational age, is significantly correlated with the gut microbiome of preterm infants, suggesting that clinical interventions contribute more to the early dynamics of gut microbiome in preterm infants than the natural development of the gut.

Keywords: Preterm infants; gestational age (GA); gut microbiome; postnatal age (Age).


Conflict of interest statement

Conflicts of Interest: All authors have completed the ICMJE uniform disclosure form (available at https://dx.doi.org/10.21037/tp-21-367). The authors have no conflicts of interest to declare.

Figures

Figure 1
Figure 1
The sampling scheme for 604 samples from 151 preterm infants. The x axis represents Age and the y axis represents the participants. Each point represents a sample, and the color of the point represents different Age groups.
Figure 2
Figure 2
Age-dependent gut microbiome changes in preterm infants. (A-C) PCoA plots of unweighted UniFrac dissimilarities between samples at the ASV level. Each point represents a sample, colored by Age (A), PMA (B), or GA (C). The strength of the color is proportional to the three time scales. (D-F) The same PCoA plots as in A, B and C, respectively, but colored according to different Age, PMA, or GA subgroups, illustrating gut microbiota composition changes between different groups. Size effect and statistical significance were calculated by PERMANOVA (Adonis). PC1 principal coordinate 1, PC2 principal coordinate 2. Percentage refers to percentage of variance explained by the principal coordinate. (G) Scatter plot showing the relationship between Age, PMA, GA, and PC1. Spearman correlation coefficient and P values are shown in the top left corner. (H) Boxplot showing the Shannon index among different Age groups. The body of the boxplots represents the median, first, and third quartiles of the distribution. The whiskers extend from the quartiles to the last data point within 1.5× IQR, with outliers beyond. The jitter scatter represents the alpha diversity index of each sample. (I) Bar plot illustrating Age, PMA, GA are significantly associated with gut microbial variations. The variations were derived from between-sample unweighted UniFrac distances. The bars are sorted and colored according to size effect. Size effect and statistical significance were calculated by PERMANOVA (Adonis). *, FDR <0.05; **, FDR <0.01; ***, FDR <0.001. PCoA, principal coordinate analysis; Age, postnatal age; PMA, postmenstrual age; GA, gestational age.
Figure 3
Figure 3
Comparison of the gut microbiota of preterm infants between different Age stages. (A) Stacked barplot showing the relative abundances of microbiota in each Age group at the family level. The top 15 most dominant taxa are shown. LDA, linear discriminant analysis. (B) The top 10 most abundant bacteria are shown in a boxplot and lollipop plot (only bacteria with LDA >4 are displayed). The bodies of the boxplots are colored according to Age group. The color of the dots in the lollipop plot indicates the Age group in which the bacterial genus was enriched.
Figure 4
Figure 4
Random forest prediction of Age, PMA, and GA using gut microbiome features. (A,C,E) Scatter plots showing the correlations of Age (A), PMA (C), and GA (E), as predicted by random forest regression model and actual values. Pearson correlation coefficient and P values are shown in the top left corner. (B,D,F) The importance scores of the top 10 features contributing to Age (B), PMA (D), and GA (F) in the random forest regression models are shown in the lollipop plots. (G,H) Streptococcus was plotted against GA (G) and Age (H). P values were calculated by linear mixed-effects regression model. Age, postnatal age; PMA, postmenstrual age; GA, gestational age.

References

    1. McDonald B, McCoy KD. Maternal microbiota in pregnancy and early life. Science 2019;365:984-5. 10.1126/science.aay0618 - DOI - PubMed
    1. Wang J, Zheng J, Shi W, et al. Dysbiosis of maternal and neonatal microbiota associated with gestational diabetes mellitus. Gut 2018;67:1614-25. 10.1136/gutjnl-2018-315988 - DOI - PMC - PubMed
    1. Lammert CR, Frost EL, Bolte AC, et al. Cutting Edge: Critical Roles for Microbiota-Mediated Regulation of the Immune System in a Prenatal Immune Activation Model of Autism. J Immunol 2018;201:845-50. 10.4049/jimmunol.1701755 - DOI - PMC - PubMed
    1. Vuong HE, Pronovost GN, Williams DW, et al. The maternal microbiome modulates fetal neurodevelopment in mice. Nature 2020;586:281-6. 10.1038/s41586-020-2745-3 - DOI - PMC - PubMed
    1. Wang S, Ryan CA, Boyaval P, et al. Maternal Vertical Transmission Affecting Early-life Microbiota Development. Trends Microbiol 2020;28:28-45. 10.1016/j.tim.2019.07.010 - DOI - PubMed