. 2021 Oct 18:8:727614.
doi: 10.3389/fmolb.2021.727614. eCollection 2021.

Pervasive 3'-UTR Isoform Switches During Mouse Oocyte Maturation

Affiliations

Pervasive 3'-UTR Isoform Switches During Mouse Oocyte Maturation

Yuanlin He et al. Front Mol Biosci. .

Abstract

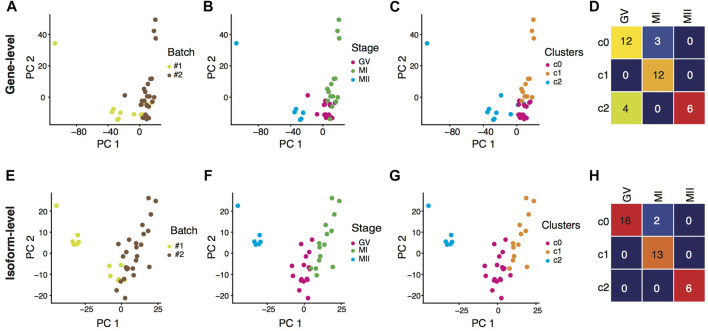
Oocyte maturation is the foundation for developing healthy individuals of mammals. Upon germinal vesicle breakdown, oocyte meiosis resumes and the synthesis of new transcripts ceases. To quantitatively profile the transcriptomic dynamics after meiotic resumption throughout the oocyte maturation, we generated transcriptome sequencing data with individual mouse oocytes at three main developmental stages: germinal vesicle (GV), metaphase I (MI), and metaphase II (MII). When clustering the sequenced oocytes, results showed that isoform-level expression analysis outperformed gene-level analysis, indicating isoform expression provided extra information that was useful in distinguishing oocyte stages. Comparing transcriptomes of the oocytes at the GV stage and the MII stage, in addition to identification of differentially expressed genes (DEGs), we detected many differentially expressed transcripts (DETs), some of which came from genes that were not identified as DEGs. When breaking down the isoform-level changes into alternative RNA processing events, we found the main source of isoform composition changes was the alternative usage of polyadenylation sites. With detailed analysis focusing on the alternative usage of 3'-UTR isoforms, we identified, out of 3,810 tested genes, 512 (13.7%) exhibiting significant switches of 3'-UTR isoforms during the process of moues oocyte maturation. Altogether, our data and analyses suggest the importance of examining isoform abundance changes during oocyte maturation, and further investigation of the pervasive 3'-UTR isoform switches in the transition may deepen our understanding on the molecular mechanisms underlying mammalian early development.

Keywords: alternative 3′-UTR isoforms; alternative polyadenylation; isoform switches; oocyte maturation; single oocyte RNA-seq.


Conflict of interest statement

The authors declare that the research was conducted in the absence of any commercial or financial relationships that could be construed as a potential conflict of interest.

Figures

FIGURE 1
FIGURE 1
Isoform expression outperformed gene expression in clustering oocytes. (A–C) PCA visualization of individual oocytes based on batch-effect corrected gene-level expression, colored by batches (A), phenotypic stages (B), and expression clustering results (C). (D) Heatmap showing the contingency table between phenotypic stages and clustering results based on batch-effect corrected gene-level expression. (E–G) PCA visualization of individual oocytes based on batch-effect corrected isoform-level expression, colored by batches (E), phenotypic stages (F), and expression clustering results (G). (H) Heatmap showing the contingency table between phenotypic stages and clustering results based on batch-effect corrected isoform-level expression.
FIGURE 2
FIGURE 2
Differential expression analysis between the GV and MII oocytes. (A) Venn diagram showing the overlap between DEGs and genes with DETs. (B) Out of the 312 non-DEG genes with DETs, Venn diagram showing the distribution of genes with up- and down-regulated transcripts. (C) Gene ontology (GO) term enrichment analysis of gene with up-regulated transcripts. (D) GO term enrichment analysis of gene with down-regulated transcripts. (E) GO term enrichment analysis of the non-DEG genes yet with DETs.
FIGURE 3
FIGURE 3
Alternative 3′-UTR isoform switches during mouse oocyte maturation. (A) Volcano plot showing the differences in percentage of distal poly(A) site usage index (PDUI) between isoform pairs against the associated statistical significance level (FDR). (B) Pie chart demonstrating the asymmetric 3′-UTR isoform switches towards longer UTRs along with oocyte maturation. (C) GO term enrichment analysis of genes exhibiting significantly alternative usage of 3′-UTR isoforms during the oocyte maturation.
FIGURE 4
FIGURE 4
Genome-browser visualization and experiment validation of 3′-UTR isoform switches. (A,B) Genome-browser visualization of the genes Gkap1 (A) and Gtf2h1 (B). In each subplot, showing from top to bottom are genomic coordinates, RNA-seq read coverage of 6 GV oocytes (red), RNA-seq read coverage of six MII oocytes (blue), the RefSeq gene annotation, and possible isoforms with alternative polyadenylation sites. The red arrows point out the approximate location of the proximal polyadenylation sites (i.e., the switch points on read coverage between the two stages). (C) Validation of the genes Gkap1, Ninj2, and Ndufa8 with longer 3′-UTR isoforms preferred during the oocyte maturation by independent experiments. Taking the shared region as a reference, the long UTR-specific region either showed weaker bands at the GV stage (Gkap1 and Ninj2) or a stronger band at the MII stage (Ndufa8). (D) Similar to (C), but validation of genes Gtf2h1, Ndel1, and Rab1b, which showed the opposite trend in length of the 3′-UTR isoform usage.

References

    1. Anders S., Pyl P. T., Huber W. (2015). HTSeq--a Python Framework to Work with High-Throughput Sequencing Data. Bioinformatics 31 (2), 166–169. 10.1093/bioinformatics/btu638 - DOI - PMC - PubMed
    1. Belair C., Sim S., Kim K.-Y., Tanaka Y., Park I.-H., Wolin S. L. (2019). The RNA Exosome Nuclease Complex Regulates Human Embryonic Stem Cell Differentiation. J. Cel Biol. 218 (8), 2564–2582. 10.1083/jcb.201811148 - DOI - PMC - PubMed
    1. Bouniol-Baly C., Hamraoui L., Guibert J., Beaujean N., Szöllösi M. S., Debey P. (1999). Differential Transcriptional Activity Associated with Chromatin Configuration in Fully Grown Mouse Germinal Vesicle Oocytes1. Biol. Reprod. 60 (3), 580–587. 10.1095/biolreprod60.3.580 - DOI - PubMed
    1. Brad A. M., Bormann C. L., Swain J. E., Durkin R. E., Johnson A. E., Clifford A. L., et al. (2003). Glutathione and Adenosine Triphosphate Content of In Vivo and In Vitro Matured Porcine Oocytes. Mol. Reprod. Dev. 64 (4), 492–498. 10.1002/mrd.10254 - DOI - PubMed
    1. Brown J., Pirrung M., McCue L. A. (2017). FQC Dashboard: Integrates FastQC Results into a Web-Based, Interactive, and Extensible FASTQ Quality Control Tool. Bioinformatics 33 (19), 3137–3139. 10.1093/bioinformatics/btx373 - DOI - PMC - PubMed