. 2021 Aug;2(8):835-852.
doi: 10.1038/s43018-021-00219-3. Epub 2021 Jul 5.

Chemotherapy induces canalization of cell state in childhood B-cell precursor acute lymphoblastic leukemia

Affiliations

Chemotherapy induces canalization of cell state in childhood B-cell precursor acute lymphoblastic leukemia

Virginia A Turati et al. Nat Cancer. 2021 Aug.

Abstract

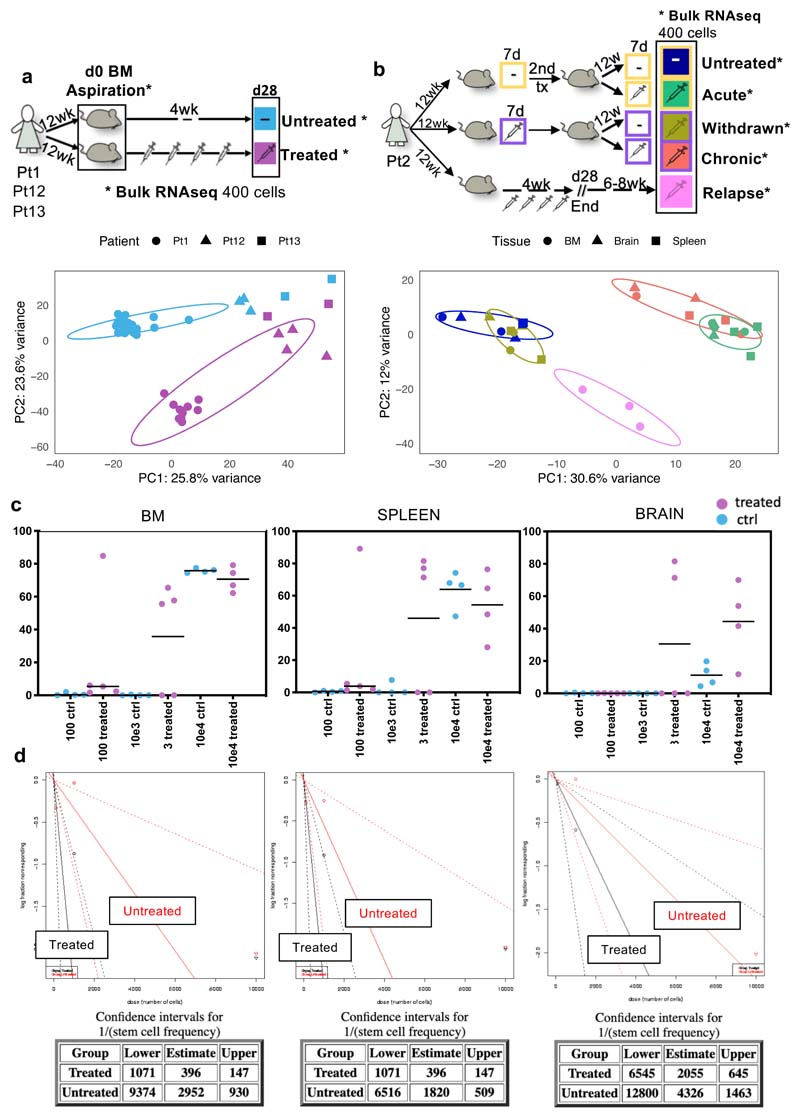
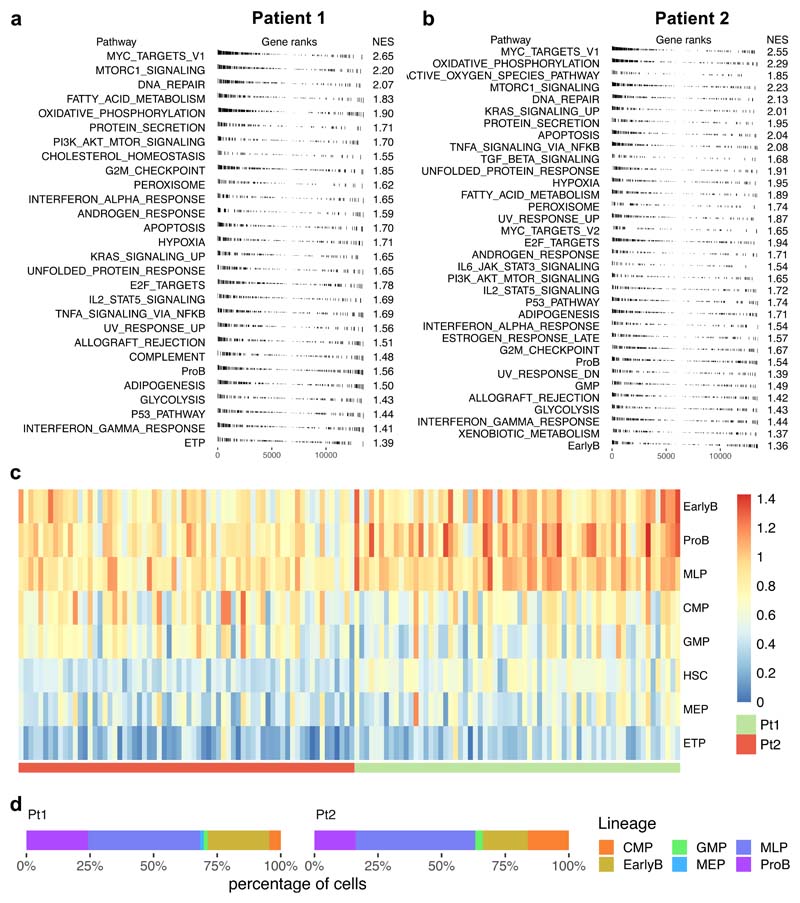
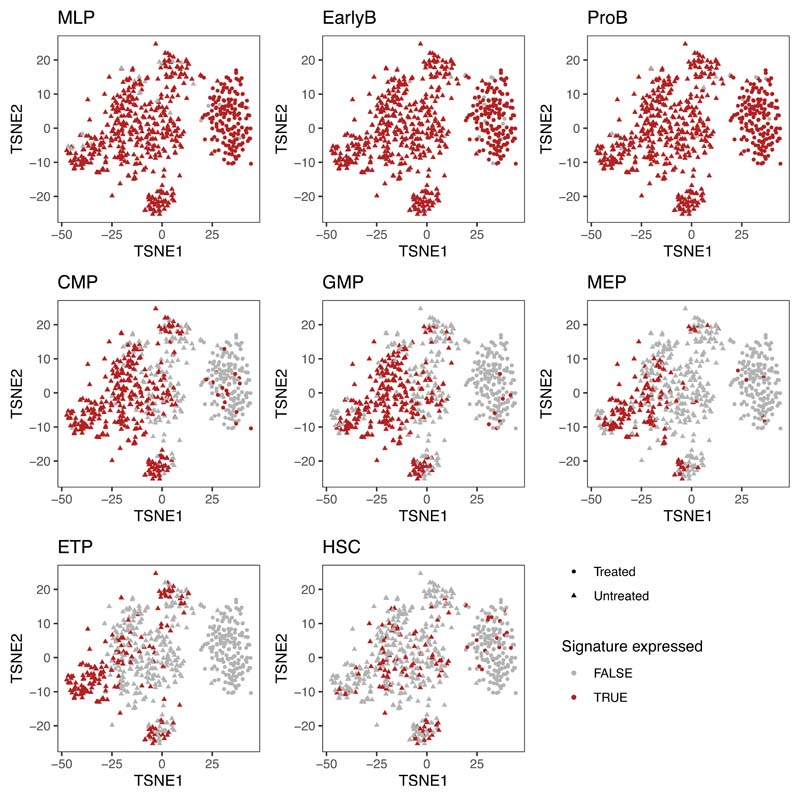
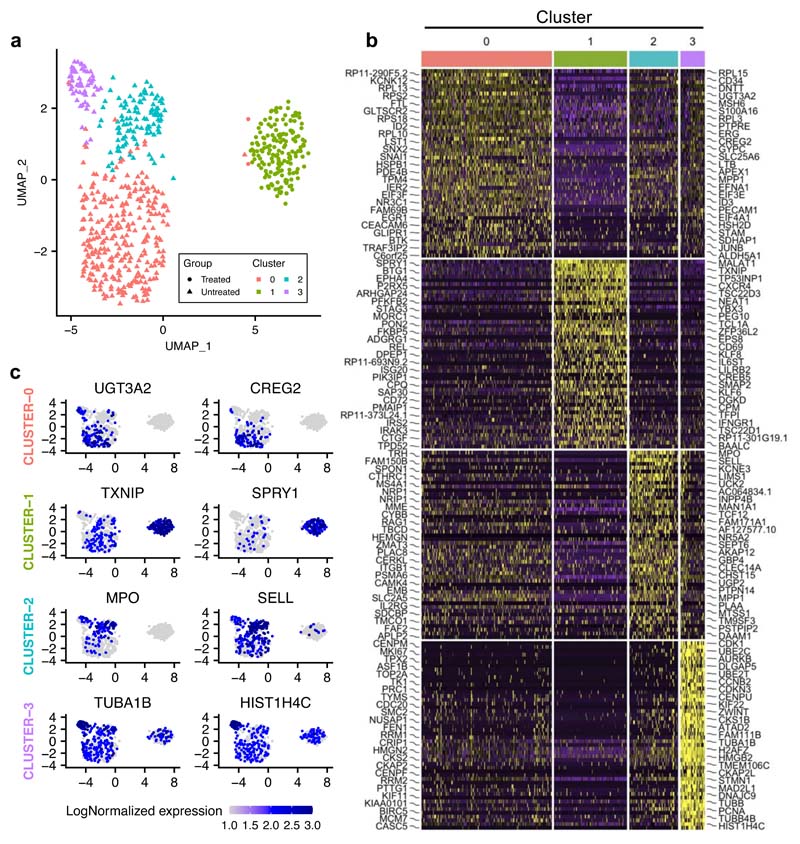
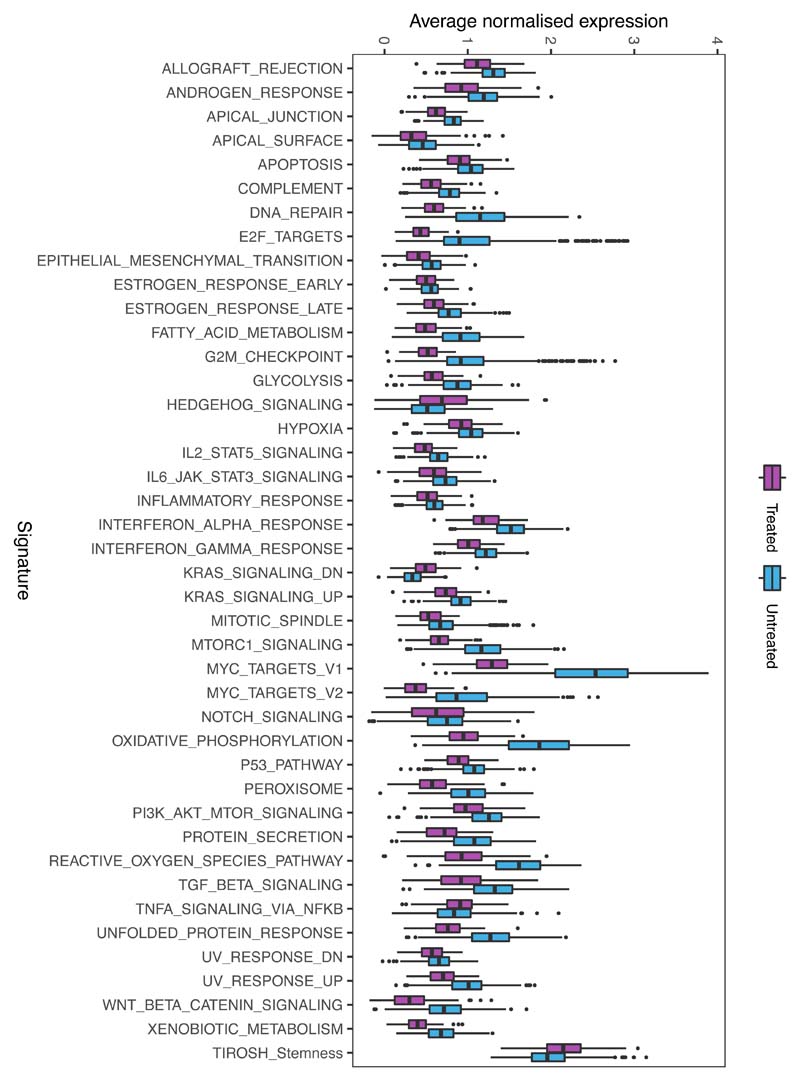
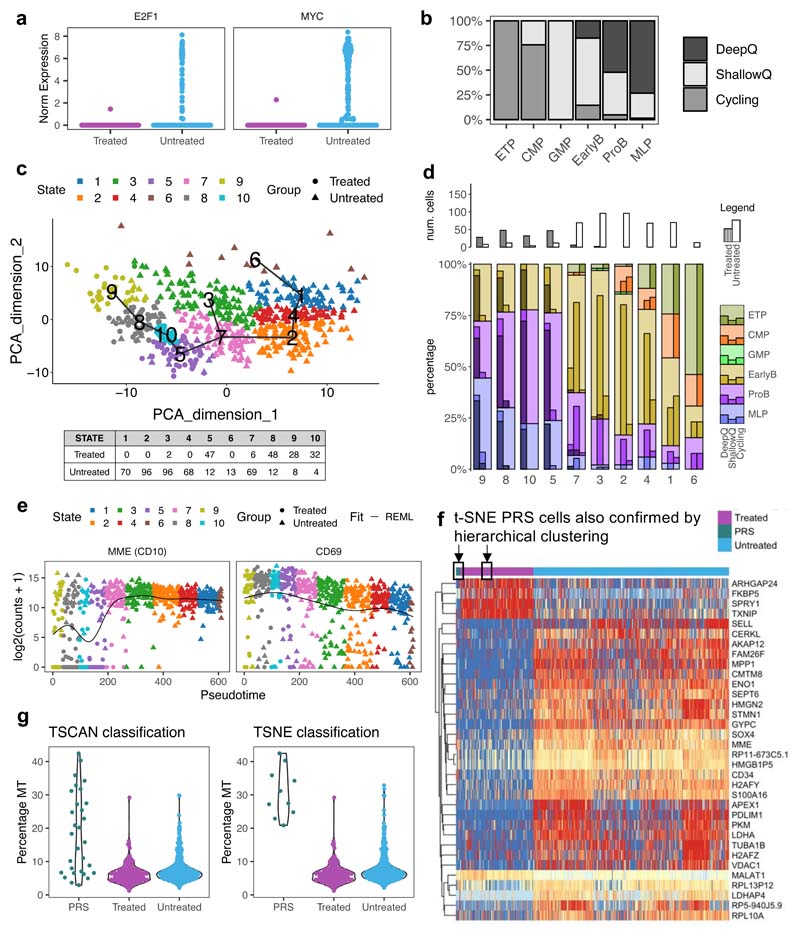
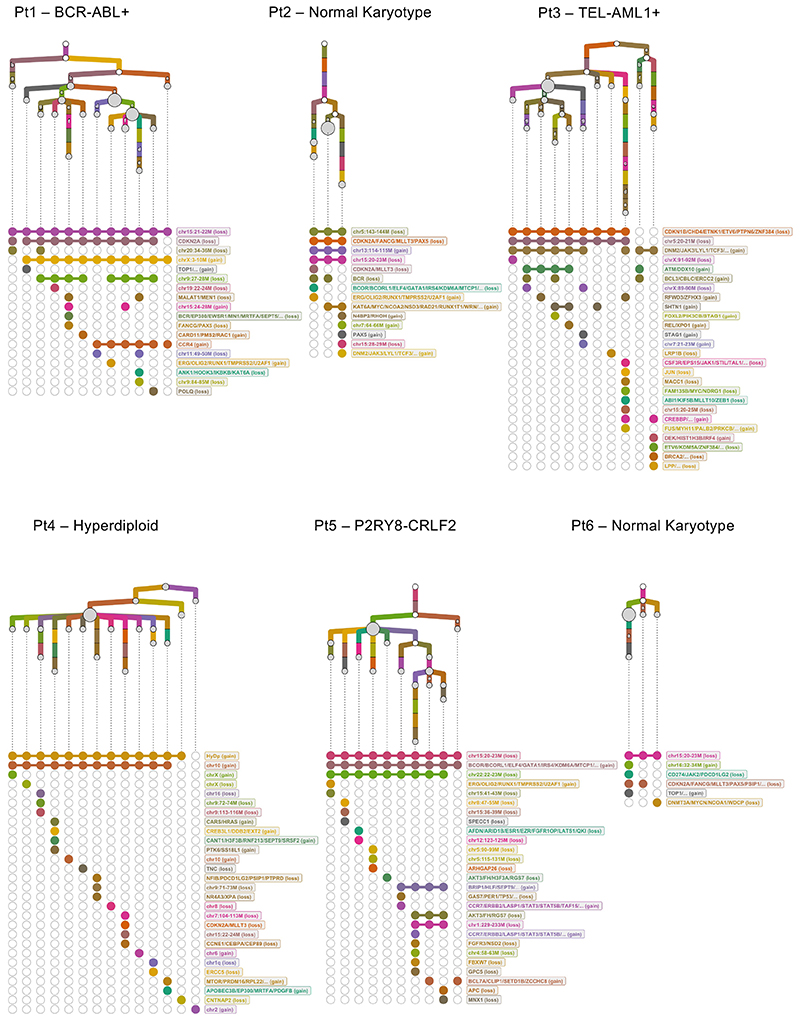
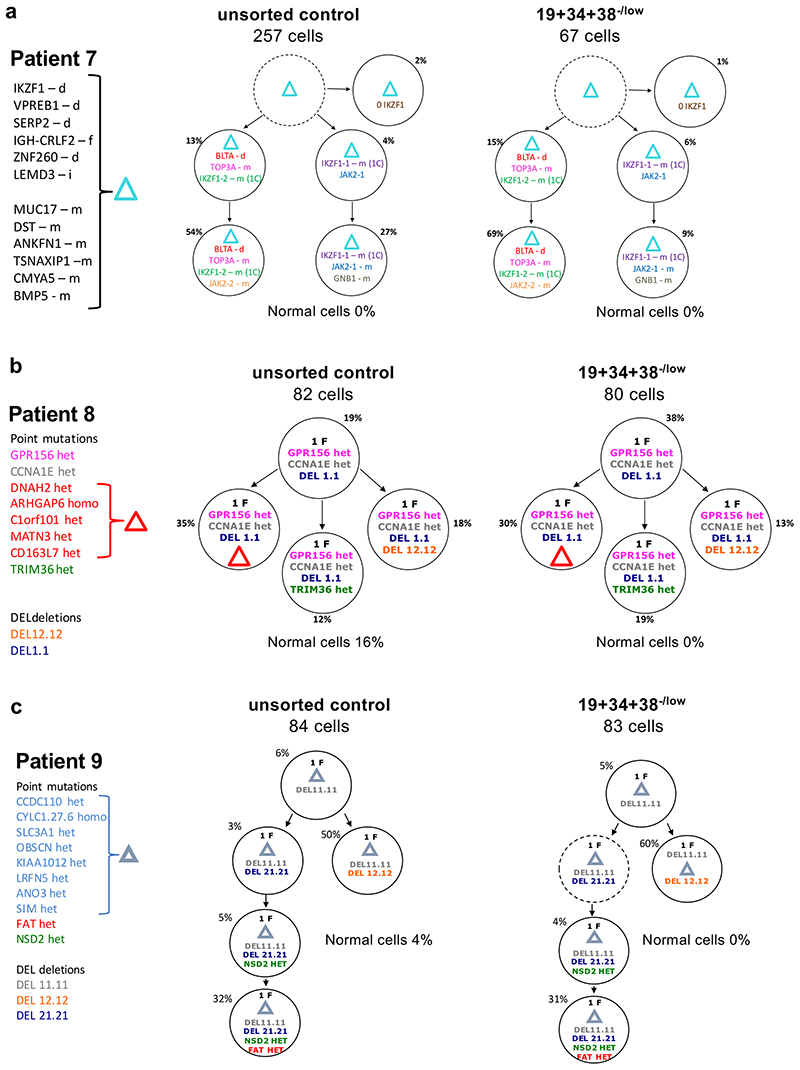
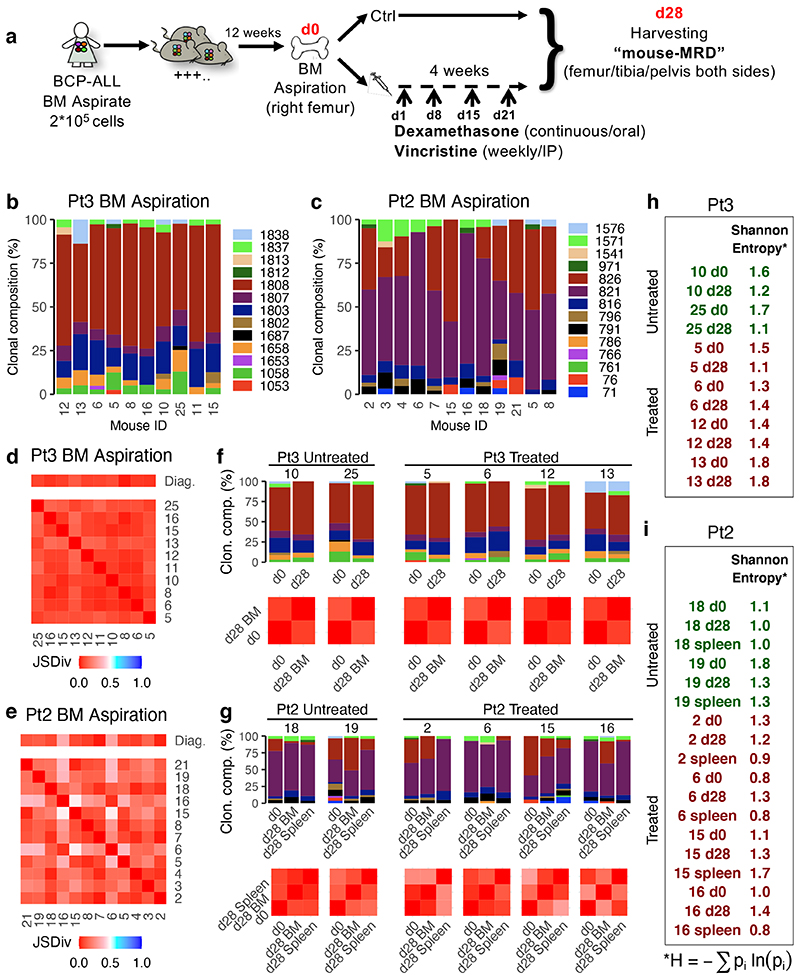
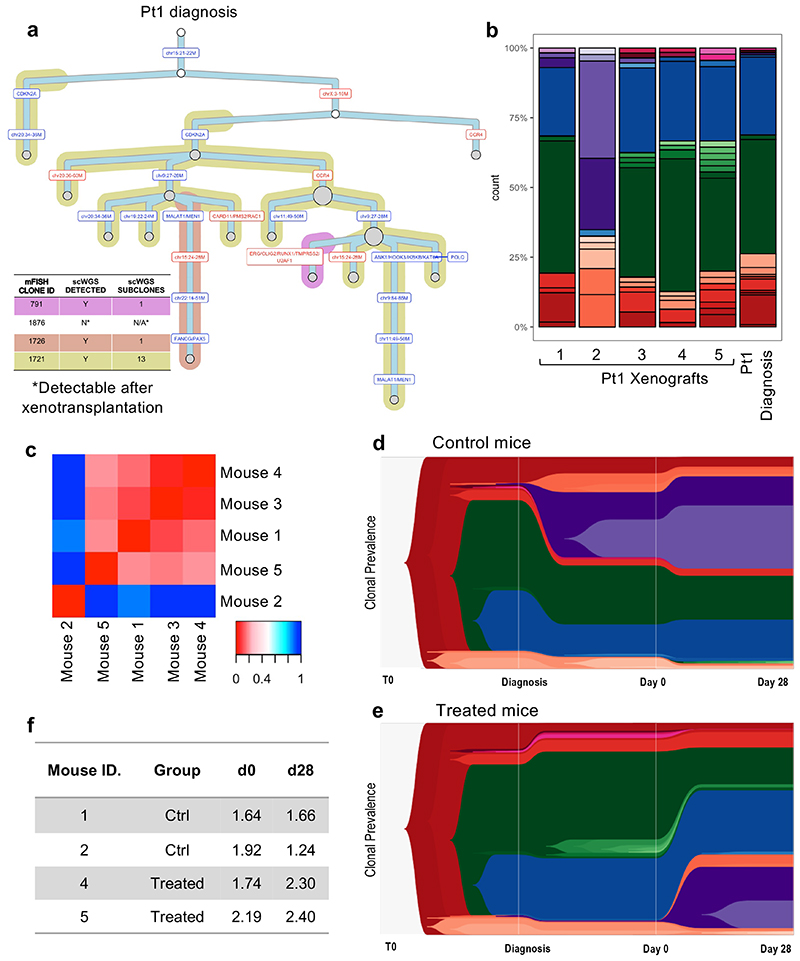
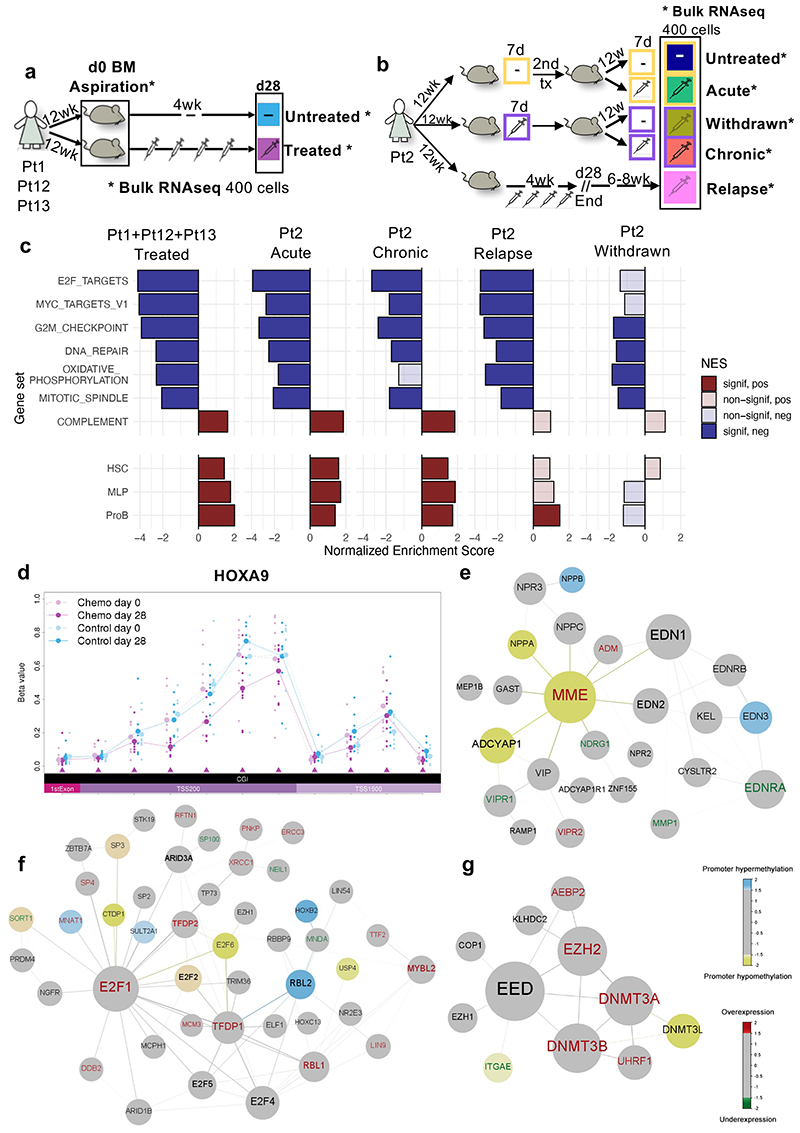
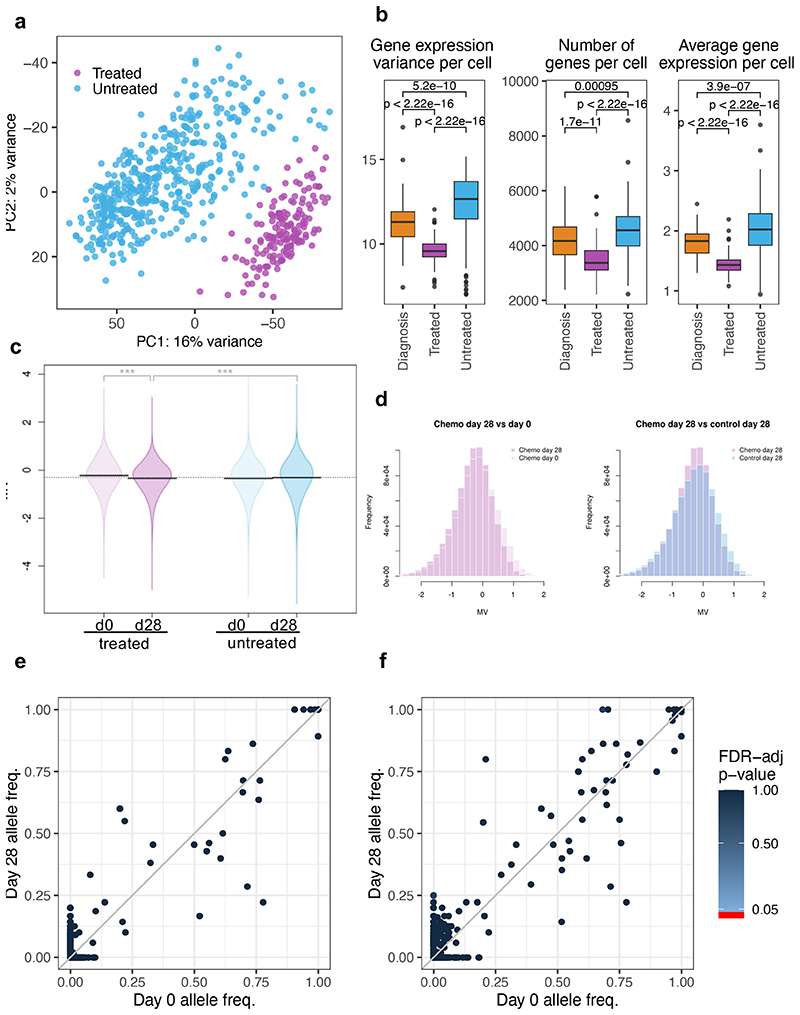
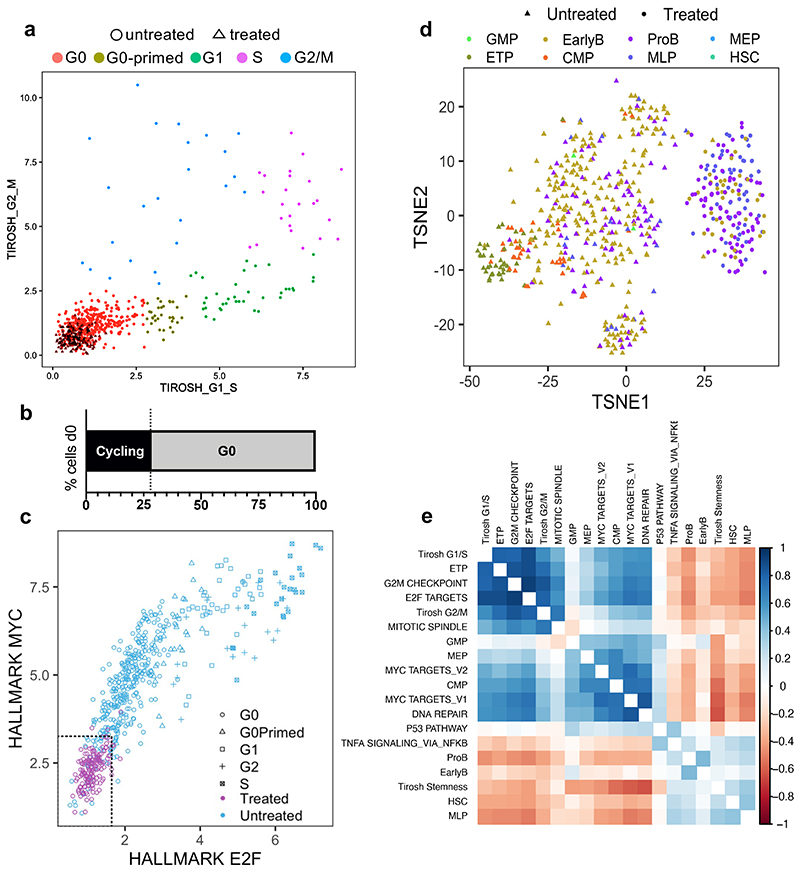
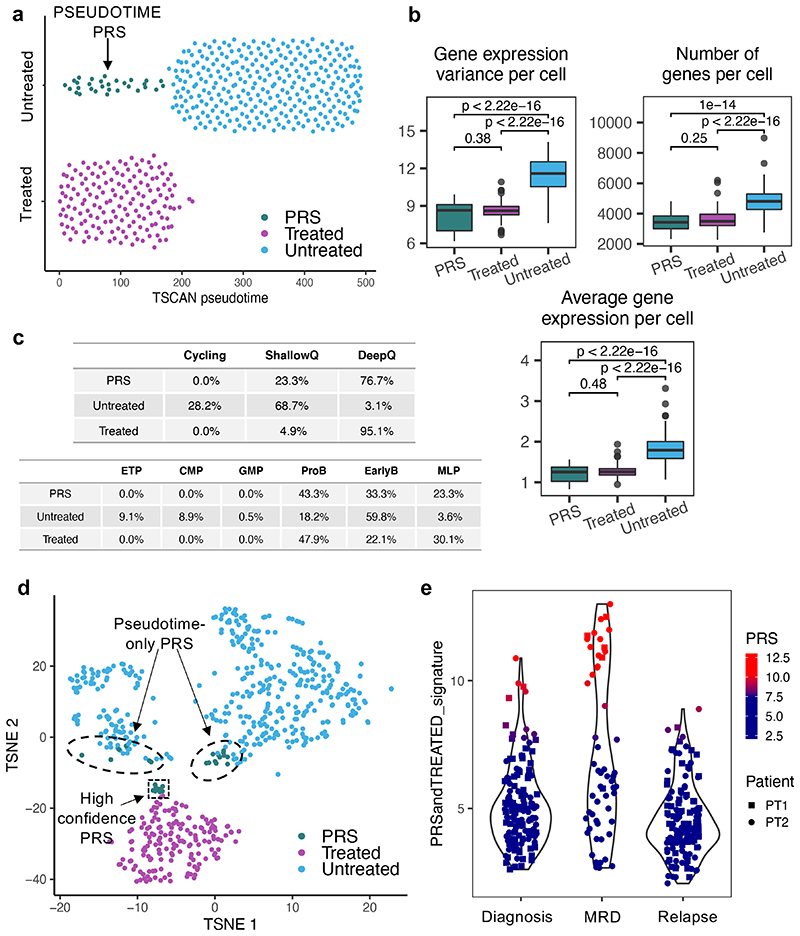
Comparison of intratumor genetic heterogeneity in cancer at diagnosis and relapse suggests that chemotherapy induces bottleneck selection of subclonal genotypes. However, evolutionary events subsequent to chemotherapy could also explain changes in clonal dominance seen at relapse. We, therefore, investigated the mechanisms of selection in childhood B-cell precursor acute lymphoblastic leukemia (BCP-ALL) during induction chemotherapy where maximal cytoreduction occurs. To distinguish stochastic versus deterministic events, individual leukemias were transplanted into multiple xenografts and chemotherapy administered. Analyses of the immediate post-treatment leukemic residuum at single-cell resolution revealed that chemotherapy has little impact on genetic heterogeneity. Rather, it acts on extensive, previously unappreciated, transcriptional and epigenetic heterogeneity in BCP-ALL, dramatically reducing the spectrum of cell states represented, leaving a genetically polyclonal but phenotypically uniform population with hallmark signatures relating to developmental stage, cell cycle and metabolism. Hence, canalization of cell state accounts for a significant component of bottleneck selection during induction chemotherapy.


Conflict of interest statement

Competing Interest M.L was an employee of Fluidigm Corporation at the time of the study.

Figures

Extended Data Fig. 1
Extended Data Fig. 2
Extended Data Fig. 3
Extended Data Fig. 4
Extended Data Fig. 5
Extended Data Fig. 6
Extended Data Fig. 7
Extended Data Fig. 8
Extended Data Fig. 9
Extended Data Fig. 10
Figure 1
Figure 1. Defining the clonal architecture of BCP-ALL at single-cell resolution
Phylogenetic trees mapping the evolutionary histories of 6 diagnostic leukemias as inferred by scWGS. Each clone is represented by a grey circle whose diameter reflects the size of the clone within the leukemia. White circles represent inferred ancestors (not detected by the analysis). Branches linking the subclones to one another are coloured-coded by their copy-number events. Events that appear in more than one branch within each tree are marked with the same letter. Below each tree, a dot matrix shows the combination of copy-number events for each leaf clone. Linked dots represent copy number events shared through a common ancestor. Disconnected dots correspond to cases where the same event happens in more than one lineage. Due to a technical failure of the flow sorter, only 9 cells from Pt2 were available for whole-genome sequencing. Normal early B-cell progenitors from 2 umbilical cord-blood units were used as controls to normalize read counts and exclude potential technical artefacts.
Figure 2
Figure 2. Genotype and cell-states associated with resistance do not co-segregate in BCP-ALL
(a-c) Subclonal genetic architecture of bulk (unsorted) and non-cycling (CD34+/CD19+/CD38-) diagnostic leukemic cells from 3 childhood BCP-ALL patients as inferred by single-cell multiplex targeted Q-PCR. Informative patient-specific Q-PCR probes detecting either non-synonymous SNV or copy number alterations (CNA) were selected based on whole-genome sequencing data of the same diagnostic samples. 80-300 cells were analyzed per compartment, and a ~2% threshold was implemented to control for false-positive events. In the figure, f=fusion, d=deletion, i=insertion, m=mutation, het=heterozygous, homo=homozygous.
Figure 3
Figure 3. Treatment in a mouse model of childhood BCP-ALL does not affect the overall extent of intratumor genetic heterogeneity
(a) Treatment model: NSG mice received an intramedullary injection (right leg) of primary leukemic cells from pediatric ALL patients. 12 weeks after injection (d0), all mice underwent a bone marrow aspiration (right leg). Upon engraftment, mice were randomly assigned to either control or treatment groups. Treated mice received Dexamethasone (6mg/L continuous administration in the drinking water) and Vincristine (0.50mg/Kg IP/weekly) for 4 weeks. Following treatment, the BM (from femur, tibia and pelvis from both sides) of each mouse was harvested. (b-c) Barplots showing the subclonal composition of each engrafted diagnostic Pt3 (b) or Pt2 (c) leukemia. Clonal makeup was determined by mFISH (n=1186 cells across n=10 Pt3 engrafted mice and n=2268 cells across n=12 Pt2 engrafted mice) using probes for TEL (ETV6), AML1 (RUNX1), (TEL-AML1), PAX5 and CDKN2A (p16). Cells were grouped into genetically similar subclones based on their combinatorial copy number status, and each subclone was then assigned a unique identifier number and color code (Extended Data Figure 3c-d). (d and e) Heatmap showing the results of all possible pairwise comparisons of the clonal composition of individual engrafted leukemias using the Jensen-Shannon divergence index (bounded between 0 and 1). (f) Bar plots showing the BM clonal composition of 2 control and 4 treated mice (identified by the tag number shown above the chart) engrafted with Pt3 cells at d0 (BM aspiration) and d28 (total BM harvest). Below the bar plots are the corresponding pairwise Jensen-Shannon divergence analysis results. (g) Same as (e) but for mice engrafted with Pt2 cells. In this case, also the spleen was analyzed at d28. (h and i) Shannon entropy was used to quantify the overall diversity of the matching pre-and post-treatment specimens for each recipient.
Figure 4
Figure 4. Single-cell whole-genome sequencing confirms limited selection of genetic subclones in response to chemotherapy
(a) Phylogenetic tree of Pt1 diagnostic leukemia as inferred by scWGS. Background shading is used to highlight clones previously defined by mFISH. (b) Subclonal genetic composition of 5 mice engrafted with Pt1 leukemia at d0 (before treatment) and Pt1 diagnostic disease (c) Heatmap showing all Jensen-Shannon divergence index-based comparisons of clonal compositions between pairs of engrafted mice at d0. (d-e). TimeScape plots visualizing tumor evolution over time in 2 control (grouped) and 2 treated (grouped) mice. The plots show the clonal composition at 3 timepoints: i) the primary diagnostic leukemia ii) at d0 in the xenografts (BM aspirate), and ii) at d28 in the xenografts (total BM harvest). Clonal identities as detailed in Figure S4C. (f) Table summarizing the Shannon entropy values of each control and treated engrafted leukemia at d0 and d28.
Figure 5
Figure 5. Transcriptionally driven phenotypes contribute to treatment resistance in BCP-ALL and DNA methylation analysis identifies epigenetically deregulated hotspots in BCP-ALL resistant cells
(a-b) Graphical representation of the standard and multi-arm treatment models. In the standard model (a) matching d0 and d28 cells harvested from 9 untreated and 9 treated mice were analyzed. Untreated samples, shown in light blue, represent d0 cells from untreated mice and treated mice, as well as d28 samples from untreated mice. In the multi-arm model (b), two consecutive rounds of transplantation and treatment (7 days) allowed the analysis of ‘acutely treated’ (green), ‘treatment withdrawn’ (dark yellow), ‘chronically treated’ (red), and ‘untreated control’ (dark blue) cells harvested from 3 mice each (see main text). ‘Relapse-like’ cells were also obtained through a separate arm of the experiment, whereby 2 mice were treated for 28 days and then allowed to relapse in situ in the absence of further treatment (6-8 weeks). (c) Hallmark gene-sets and published signatures associated with predefined differentiation stages of the B-cell ontogeny,, which represent the core processes deregulated during chemotherapy across different patient subtypes and treatment regimens (see Supplementary Table 4 for the full list). Each population is compared to the corresponding untreated control. P-values are obtained using 2-sided permutation test with 10,000 permutations; significance thresholds: <0.05 after Benjamini-Hochberg multiple test correction. (d) Representative example of a region (HOXA9 locus) differentiallymethylated in d28 treated mice as compared to both d0 treated-mice and untreated-mice at d0/d28. All annotated CpG regions for the loci are listed at the bottom of the plot in chromosomal order. Each line shows the mean beta value of the corresponding sample. TSS200 = 0–200 bases upstream of the transcriptional start site (TSS). TSS1500 = 200–1500 bases upstream of the TSS. (e-f-g) Representative results of 3 out of 5 gene modules identified using the Functional Epigenetic Modules (FEM) algorithm comparing treated versus untreated d28 cells using the default FEM protein-protein interaction network. In each representation, the largest circle represents the ‘seeds’ (or master regulator) of the corresponding functional epigenetic module. In the figure, blue nodes represent significantly hypermethylated gene promoters, yellow nodes represent significantly hypomethylated gene promoters, red labels represent significantly overexpressed genes and green labels represent significantly underexpressed genes.
Figure 6
Figure 6. Transcriptional and epigenetic variability provide a substrate for genotype-independent selection over treatment
Single-cell RNA sequencing of d0 (BM aspiration) and d28 (total BM harvest), primary cells from 3 untreated and 4 treated Pt1 xenografts. Untreated cells (light blue) comprise d0 and d28 cells from control mice and d0 cells (engrafted before to treatment) from treated mice. Treated cells (purple) are d28 cells from mice that received chemotherapy. (a) Principal component analysis of the single-cell data displaying variations in the transcriptomes of individual untreated and treated cells. (b) Boxplots showing gene expression variance per cell (left), number of genes expressed per cell (middle), and average gene expression per cell (right) in diagnostic (n=448 cells), treated (n=163 cells) and untreated cells (n=66 cells). Data is normalized for sequencing coverage. Each boxplot shows the median, the 25th and the 75th percentiles; whiskers cover all data points within a 1.5x the inter-quantile range from the bounds of the box; remaining data points are plotted as outliers. Distributions are compared using a 2-sided Wilcoxon test (unadjusted p-values). (c) Violin plots showing mean methylation variance (MV) scores across n=763949 array probes for n=6 control and n=9 treated mice at d0 and d28. Statistical significance (2-sided T-test) is shown above each MV comparison. P-value statistical significance corresponds to: ***<1e-3 (d) Histogram representation of the MV scores for control and treated mice. (e) SNV analysis comparing the frequency of COSMIC mutations across cells in paired day 0 and d28 post-treatment samples. Only mutations supported by at least 10 reads in at least 10% of the cells were included in the analysis (total 813 COSMIC-annotated SNVs). No SNV was found to be significantly enriched (2-sided Fisher exact test, p-value < 0.05, FDR multiple-test correction). (f) Same as (e) but clustering mutations by gene (538 mutated genes in total).
Figure 7
Figure 7. Resistant BCP-ALL cells represent a small subset of G0 cells with MLP-like transcriptional features
(a) Scatter plot showing the classification of n=611 cells to non-cycling/G0 and different stages of the cell cycle based on the relative expression of gene-sets associated with the G1/S (x-axis) and G2/M (y-axis) phases. Gene sets obtained from ref. and available in Supplementary Table 4. (b) Bar plot showing the percentages of Cycling and G0 cells within untreated leukaemia at d0 (n=351 cells). Treated cells were found exclusively in the G0 compartment. (c) Scatter plot showing the classification of non-cycling/G0 n=611 cells as deep quiescent and shallow quiescent based on the relative expression of gene-sets associated with E2F signaling (x-axis) and MYC signaling (y-axis). The 95th percentile of the expression of each signature in treated cells was used as a reference to establish the approximate cut-off values for deep quiescence. (d) Nonlinear dimension reduction and visualization t-SNE analysis. Each cell is assigned to its closest normal hematopoietic cell lineage based on the expression of known marker genes (signature with the highest Z-score average). (e) Correlation matrix looking at the relationship between different gene signatures associated with cell cycle and lineage. Correlated expression patterns are displayed in blue and anticorrelated in red.
Figure 8
Figure 8. Treatment selects a rare pre-existing cell state
(a) (a) Ordering of n=492 cells along the main path of the TSCAN inferred pseudotime (see Fig S8C). The plot shows n=30 pre-existing resistant cells (PRS) that, although untreated, cluster together with treated cells with respect to pseudotime. (b) Boxplots showing the variance of gene expression per cell (left), number of genes expressed per cell (middle) and average gene expression per cell (right) in PRS (n=30 cells), treated (n=163 cells) and untreated cells (n=418 cells). Data is normalized for sequencing coverage. Each boxplot shows the median, the 25th and the 75th percentiles; whiskers cover all data points within a 1.5x the inter-quantile range from the bounds of the box; remaining data points are plotted as outliers. Distributions are compared using a 2-sided Wilcoxon test (unadjusted p-values). (c) Tables showing the percentage of untreated (n=418 cells), PRS (n=30 cells) and treated cells (n=163 cells) assigned to different cell cycle states (top) and differentiation stage (bottom). (d) T-SNE clustering of all n=611 cells.. PRS cells as defined by both this approach and pseudotime analysis are highlighted by a black box and arrow. (e) Identification of PRS-like treatment resistant cells in matching diagnosis, MRD and relapse specimens from two patients that underwent standard BCP-ALL treatment. The xenograft data was used to generate a ‘resistance’ signature comprising the union of the top 50 genes differentially expressed between both treated vs untreated (non-cycling only) and PRS vs untreated (non-cycling only) cells, after removing any gene differentially expressed between treated and PRS cells. The signature expression was then tested on the un-transplanted specimens.

References

    1. Almendro V, Marusyk A, Polyak K. Cellular Heterogeneity and Molecular Evolution in Cancer. Annu Rev Pathol Mech Dis. 2013;8:277–302. - PubMed
    1. Anderson K, et al. Genetic variegation of clonal architecture and propagating cells in leukaemia. Nature. 2011;469:356–361. - PubMed
    1. Gerlinger M, et al. Intratumor Heterogeneity and Branched Evolution Revealed by Multiregion Sequencing. N Engl J Med. 2012;366:883–892. - PMC - PubMed
    1. Jamal-Hanjani M, et al. Tracking the Evolution of Non–Small-Cell Lung Cancer. N Engl J Med. 2017;376:2109–2121. - PubMed
    1. McGranahan N, Swanton C. Clonal Heterogeneity and Tumor Evolution: Past, Present, and the Future. Cell. 2017;168:613–628. - PubMed

Publication types