. 2022 Jan 25;50(2):e10.
doi: 10.1093/nar/gkab993.

HI-NESS: a family of genetically encoded DNA labels based on a bacterial nucleoid-associated protein

Affiliations

HI-NESS: a family of genetically encoded DNA labels based on a bacterial nucleoid-associated protein

Fatema-Zahra M Rashid et al. Nucleic Acids Res. .

Abstract

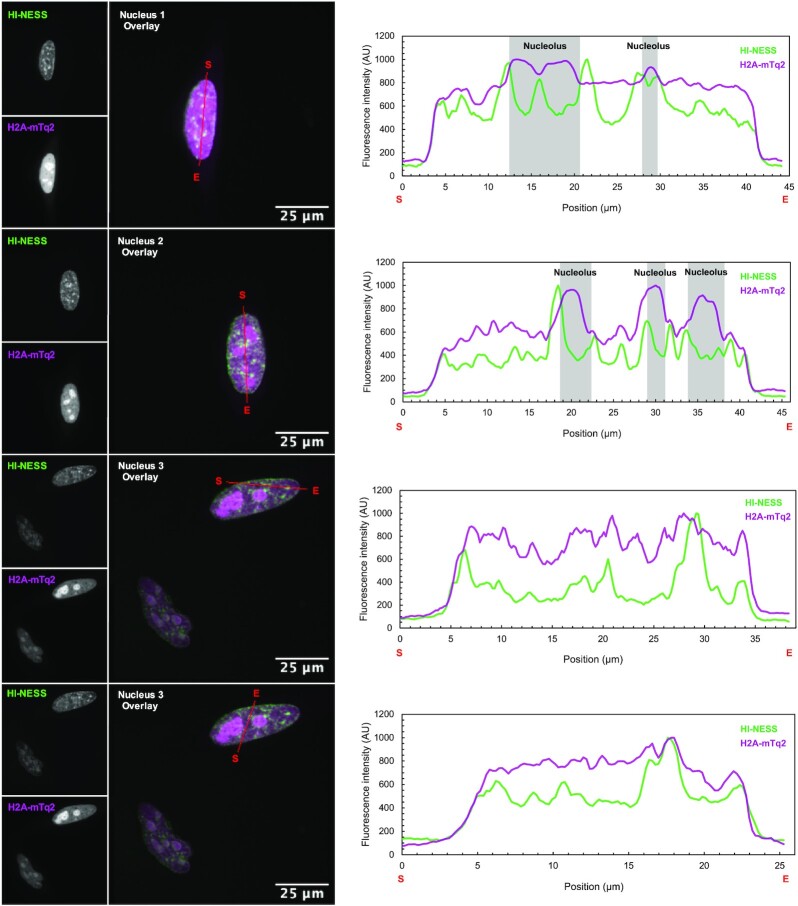
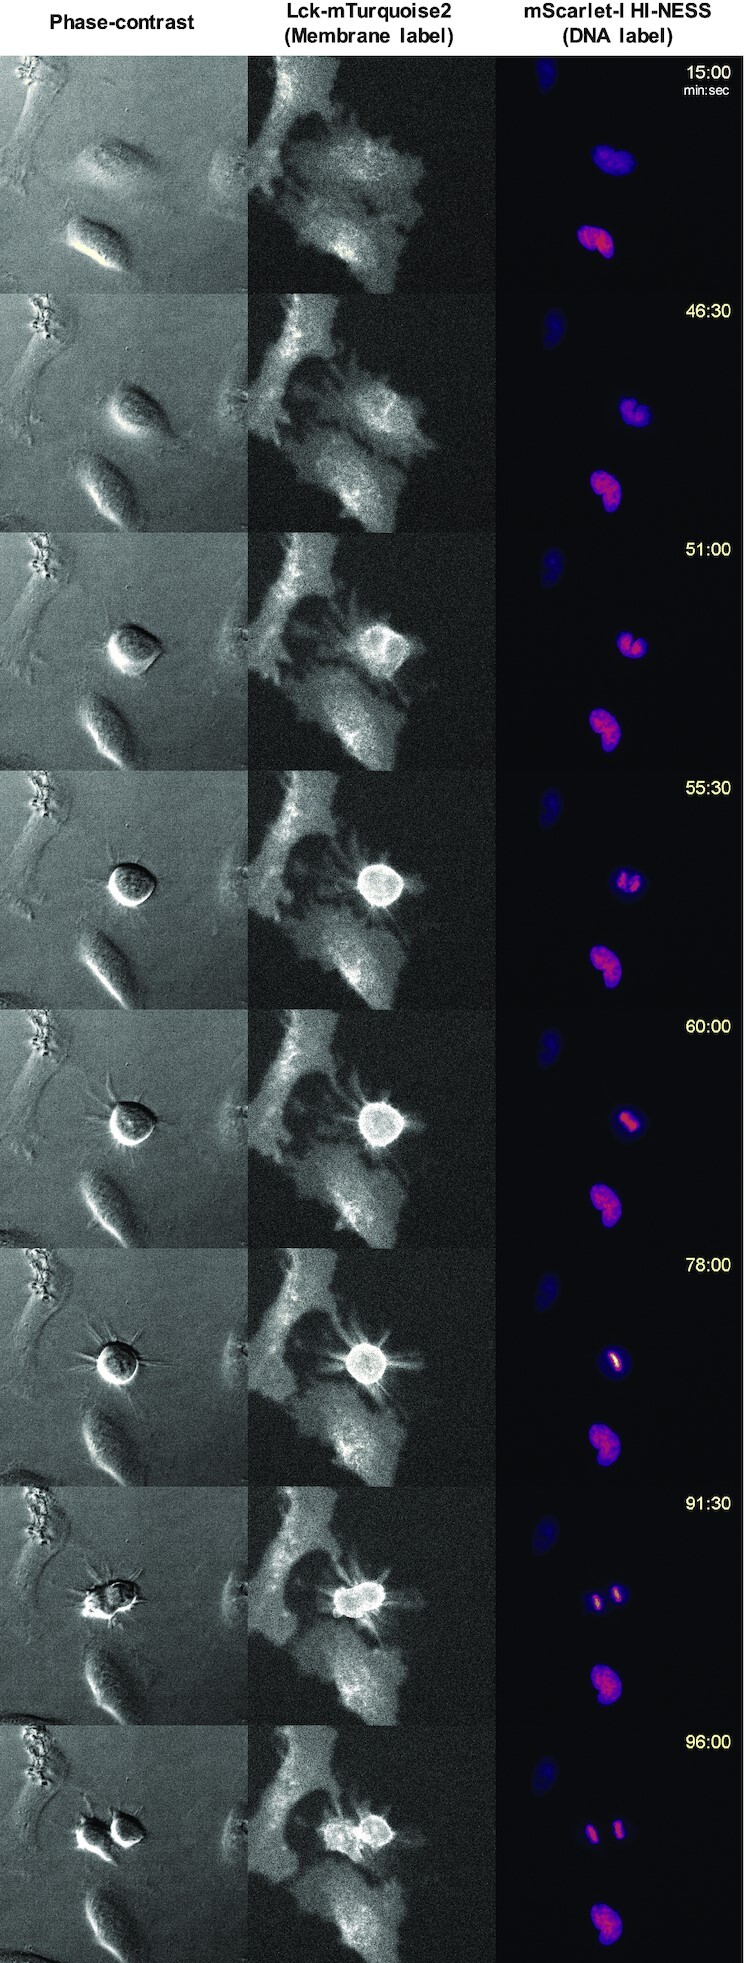
The interplay between three-dimensional chromosome organisation and genomic processes such as replication and transcription necessitates in vivo studies of chromosome dynamics. Fluorescent organic dyes are often used for chromosome labelling in vivo. The mode of binding of these dyes to DNA cause its distortion, elongation, and partial unwinding. The structural changes induce DNA damage and interfere with the binding dynamics of chromatin-associated proteins, consequently perturbing gene expression, genome replication, and cell cycle progression. We have developed a minimally-perturbing, genetically encoded fluorescent DNA label consisting of a (photo-switchable) fluorescent protein fused to the DNA-binding domain of H-NS - a bacterial nucleoid-associated protein. We show that this DNA label, abbreviated as HI-NESS (H-NS-based indicator for nucleic acid stainings), is minimally-perturbing to genomic processes and labels chromosomes in eukaryotic cells in culture, and in zebrafish embryos with preferential binding to AT-rich chromatin.


Figures

Figure 1.
Figure 1.
HI-NESS distribution in wild-type Escherichia coli and E. coli Δhns (Confocal microscopy, single Z-plane). (A) HI-NESS (green) labels the nucleoid in wild-type E. coli where its distribution correlates—albeit poorly—with the DAPI signal (magenta). HI-NESS also distributes in the cytoplasm of these cells, decreasing the signal-to-noise ratio and the applicability of HI-NESS as a DNA label in wild-type E. coli. (B) In E. coli Δhns, HI-NESS localises in the nucleoid. Line scans across E. coli and E. coli Δhns cells are marked in red with start and end positions indicated with S and E, respectively. A white signal in the Overlay images represents colocalization.
Figure 2.
Figure 2.
HI-NESS labels chromosomes in HeLa cells in culture (Confocal microscopy, single Z-plane). Line scans (marked in red with start and end positions indicated with S and E, respectively) across nuclei of HeLa cells co-stained with HI-NESS (green) and SiR-Hoechst (magenta) highlight the overlap between the distributions of the two DNA labels. However, HI-NESS also accumulates in nucleoli due to high levels of the protein in the nucleus and its affinity for RNA as detected in in vitro studies (Supplementary Figure S4; Supplementary Table S1).
Figure 3.
Figure 3.
The overlap between H2A-mTurquoise2 (green) and SiR-Hoechst (magenta) signals in HeLa cells (Confocal microscopy, single Z-plane). Nuclei 1 and 2: Extensive nucleolar accumulation of H2A-mTurquoise2 (H2A-mTq2) drowns its fluorescent signal over the rest of the nucleus. Line scans (marked in red with start and end positions indicated with S and E, respectively) across such nuclei show that the H2A-mTq2 signal only recapitulates that of SiR-Hoechst when the line scan does not cross a nucleolus. Nuclei 3, 4, and 5: in cells expressing low levels of H2A-mTq2 (nuclei 3 and 4), and in nuclei with no visible nucleoli (nucleus 5) the distribution of the SiR-Hoechst and H2A-mTq2 signals are comparable.
Figure 4.
Figure 4.
The distribution of mEos3.2-tagged HI-NESS (green) and H2A-mTq2 (magenta) in the nuclei of HeLa cells in culture (Spinning disk microscopy, single Z-plane). In HeLa cells co-expressing mEos3.2-tagged HI-NESS and H2A-mTq2, the fluorescently-labelled histone exhibits extensive nucleolar retention, and consequently, stains the chromosomes with a low signal-to-noise ratio. The decreased nucleolar accumulation of HI-NESS allows chromosomes to be visualised with a higher signal-to-noise ratio. Line scans (marked in red with start and end positions indicated with S and E, respectively) across these nuclei highlight the effect of nucleolar retention on the signal over the rest of the nucleus.
Figure 5.
Figure 5.
The distribution of mScarlet-I-HI-NESS (magenta) and H2A-mTq2 (green) in the nuclei of HeLa cells expressing lower levels of the fluorescent proteins (Spinning disk microscopy, single Z-plane). The distribution of the mScarlet-I-HI-NESS signal (left) in the nuclei recapitulates that of earlier experiments (Figures 2 and 4), with the label showing some nucleolar accumulation, and the presence of dense foci. The distribution of H2A-mTq2 (middle), on the other hand, differs (Figures 3 and 4). H2A-mTq2 does not accumulate in the nucleoli of cells expressing lower levels of the protein. H2A-mTq2 also exhibits a visibly different distribution compared to that of mScarlet-I-HI-NESS, with a relatively homogeneous signal over the nucleus and the apparent lack of the dense foci observed with HI-NESS. The discrepancy may arise from the homogeneous binding of H2A-mTq2 along the chromosome, in contrast to the preferential binding of Hoechst and HI-NESS to AT-rich sequences (Supplementary Figure S4; Supplementary Table S1) (4–6).
Figure 6.
Figure 6.
HI-NESS does not induce increased rates of DNA damage. The induction of γH2AX—a DNA damage biomarker—in U2OS (FRT) cells stably expressing mEGFP-HI-NESS is comparable to cells expressing mEGFP-NLS as visualised by microscopy (Wide field microscopy, single Z-plane) (Panel A, left). On average, 7.4 ± 3.0 γH2AX foci were detected in U2OS cells expressing mEGFP-HI-NESS cells, compared to 9.3 ± 2.9 foci with mEGFP-NLS expression (Panel B, green). γH2AX is induced when the cells are treated with 3 Gy ionizing radiation (IR) (Panel A, right), 51.0 ± 6.4 γH2AX foci appear in U2OS (FRT) mEGFP-HI-NESS cells, and 57.9 ± 2.6 in U2OS (FRT) mEGFP-NLS cells (Panel B, magenta). Panel C: Western blot shows that γH2AX induction is unaffected by the expression of HI-NESS. Furthermore, γH2AX induction and hence, the DNA damage response, following IR treatment is not affected by HI-NESS.
Figure 7.
Figure 7.
HI-NESS does not interfere with cell cycle progression. Panel A: U2OS (FRT) cells in the S-phase were visualised (Wide field microscopy, single Z-plane) by pulse-labelling the cells with EdU and ‘clicking’ the molecule to 5/6-FAM. Panel B: 56.6 ± 2.9% of U2OS (FRT) cells expressing mEGFP-HI-NESS (U2OS-HI-NESS) occur in the S-phase of the cell cycle compared to 65 ± 7.2% of cells expressing mEGFP-NLS (U2OS-mEGFP). Flow cytometry of propidium iodide-labelled cells (Panels C–E) detects 37% of U2OS-HI-NESS cells in the G1 phase of the cell cycle, 33% in the S phase and 30% in the G2/M phase (Panels C and E). Of the U2OS-mEGFP cells, 38% occur in the G1 phase, 32% in the S phase and 30% in the G2/M phase (Panels D and E).
Figure 8.
Figure 8.
HI-NESS labels chromosomes in zebrafish larvae (confocal microscopy, single Z-plane). The distribution of the mEos3.2 signal (green) in nuclei of zebrafish larvae overlapped with that of DAPI (magenta). Nucleolar accumulation of HI-NESS was not observed. (A) Striated muscle cells (Trunk); (B) from left to right: trunk, blood vessel, yolk extension. The HI-NESS labelled cell is within a blood vessel. The approximate locations in the zebrafish embryo at which (A) and (B) were imaged is provided in (C).
Figure 9.
Figure 9.
HI-NESS can be used to visualise chromosome dynamics during the cell cycle (wide field microscopy, single Z-plane). A time-lapse of a dividing HeLa cell (Movie S8) shows that HI-NESS remains bound to the chromosome during mitosis. From left to right: Phase contrast image, Lck-mTurquoise2 (membrane label), mScarlet-I-HI-NESS (DNA label).

Similar articles

Cited by

References

    1. Dame R.T., Rashid F.Z.M., Grainger D.C.. Chromosome organization in bacteria: mechanistic insights into genome structure and function. Nat. Rev. Genet. 2020; 21:227–242. - PubMed
    1. Dame R.T., Tark-Dame M.. Bacterial chromatin: converging views at different scales. Curr. Opin. Cell Biol. 2016; 40:60–65. - PubMed
    1. Yu M., Ren B.. The three-dimensional organization of mammalian genomes. Annu. Rev. Cell Dev. Biol. 2017; 33:265–289. - PMC - PubMed
    1. Banerjee D., Pal S.K.. Dynamics in the DNA recognition by DAPI: exploration of the various binding modes. J. Phys. Chem. B. 2008; 112:1016–1021. - PubMed
    1. Trotta E., D’Ambrosio E., Ravagnan G., Paci M. Simultaneous and different binding mechanisms of 4′,6-diamidino-2-phenylindole to DNA hexamer (d(CGATCG))2: A 1H NMR study. J. Biol. Chem. 1996; 271:27608–27614. - PubMed

Publication types

LinkOut - more resources