. 2021 Nov 3;187(3):1795-1811.
doi: 10.1093/plphys/kiab325.

Plant PhysioSpace: a robust tool to compare stress response across plant species

Affiliations

Plant PhysioSpace: a robust tool to compare stress response across plant species

Ali Hadizadeh Esfahani et al. Plant Physiol. .

Abstract

Generalization of transcriptomics results can be achieved by comparison across experiments. This generalization is based on integration of interrelated transcriptomics studies into a compendium. Such a focus on the bigger picture enables both characterizations of the fate of an organism and distinction between generic and specific responses. Numerous methods for analyzing transcriptomics datasets exist. Yet, most of these methods focus on gene-wise dimension reduction to obtain marker genes and gene sets for, for example, pathway analysis. Relying only on isolated biological modules might result in missing important confounders and relevant contexts. We developed a method called Plant PhysioSpace, which enables researchers to compute experimental conditions across species and platforms without a priori reducing the reference information to specific gene sets. Plant PhysioSpace extracts physiologically relevant signatures from a reference dataset (i.e. a collection of public datasets) by integrating and transforming heterogeneous reference gene expression data into a set of physiology-specific patterns. New experimental data can be mapped to these patterns, resulting in similarity scores between the acquired data and the extracted compendium. Because of its robustness against platform bias and noise, Plant PhysioSpace can function as an inter-species or cross-platform similarity measure. We have demonstrated its success in translating stress responses between different species and platforms, including single-cell technologies. We have also implemented two R packages, one software and one data package, and a Shiny web application to facilitate access to our method and precomputed models.


Figures

Figure 1
Figure 1
Plant PhysioSpace overview. The method consists of two main sections: space generation and Physio-mapping. A, In space generation, data from public repositories are processed and the relevant information is extracted. After trimming, the extracted information is stored in matrices called “space”, representing physiologically relevant expression patterns. B, Physio-mapping uses a space to analyze previously unknown data, for example, from another experiment. These data are mapped to the generated space, resulting in “similarity” scores that indicate the likeness of these data to the known physiological processes.
Figure 2
Figure 2
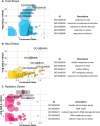
GO analysis of mean stress space. Results of GO analysis on three stress groups are demonstrated using bubble plots: cold stress (A), heat stress (B), and radiation stress (C). A–C, Each enriched GO term is represented by a circle, with adjusted P-values as y-axis and enrichment ratio as x-axis. The size of the circle shows the size of the gene list of the corresponding GO term. Enrichment ratio here means the ratio between the actual number of DEGs and the expected number in each GO group. For each plot, the five most significant GO terms are labeled on the plot and listed in a table beside each plot. Complete set of bubble plots and set of significant GO terms for all 15 stress groups are provided in Supplemental Figures S1–S15. Plots were generated using the GOplot package in R (Walter et al., 2015).
Figure 3
Figure 3
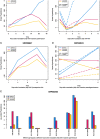
Time series analysis of biotic stress response of wheat RNA-seq data. Five different biotic-stressed datasets from Wheat Expression Browser are mapped to the Arabidopsis space Smr¯, and the three groups with highest stress values are plotted for each dataset. A, Wheat response after inoculation with fungal pathogen F. graminearum is measured through time. B, Responses of two different MTs of wheat are studied to wheat yellow rust pathogen PST. C, Plants went through the infection cycle of the hemibiotrophic fungus Z. tritici. D, The responses of two different traits of resistant and susceptible wheat to Fusarium crown rot are studied. E, Behavior of five different genotypes under the disease pressure of F. graminearum is studied. The five investigated genotypes consist of CM-82036 (CM), a progeny of the resistant Sumai-3, and four NILs bearing either one, both, or none of the resistant alleles Qfhs.ndsu-3BS (also known as Qfhb1 or Fhb1) and Qfhs.ifa-5A. Among the four, NIL1 is a MT with both QTLs, expected to have the highest resistance after CM-82036. NIL2 and NIL3 are MTs harboring Fhb1 and Qfhs.ifa-5A QTL, respectively, with both predicted to behave moderately resistant. NIL4 lacks both QTLs, and is likely to be susceptible. In four out of five cases, BioMone stress group has the highest similarity value, with resistant MTs having higher responses than the susceptible ones (A–D). This figure is generated using ggplot2 package (Wickham, 2016).
Figure 4
Figure 4
Single-cell analysis results of Plant PhysioSpace. Stress scores were calculated for each cell. A, For demonstrating the outcome, we plotted the heat score of the two big groups of control and stressed. This box plot proves how Plant PhysioSpace could correctly detect and quantify stress response in single-cell data. B and C, We overlaid the heat scores on UMAP and tSNE plots, respectively. D, Boxplot of heat scores, on y-axis, was plotted against different cell types, on x-axis. Cell types on the x-axis are ordered based on the morphological anatomy, starting from inner cell types to outermost cell layers (excluding Ambiguous cells, which come at the end). In the boxplots, Wilcoxon rank-sum test is used for statistical testing, the median is shown with a line inside each box, the lower and upper hinges correspond to the first and third quartiles, the upper whisker extends from the hinge to the largest value no further than 1.5 × IQR from the hinge (where IQR is the inter-quartile range, or distance between the first and third quartiles), the lower whisker extends from the hinge to the smallest value at most 1.5 × IQR of the hinge, and data beyond the end of the whiskers are plotted individually. This figure is generated using ggplot2 package (Wickham, 2016).
Figure 5
Figure 5
Plant PhysioSpace Web-application, with the address http://physiospace.shinyapps.io/plant/. A, Home page of the web-app. B, Results of a mock example analysis on the Plant PhysioSpace web-app.
Figure 6
Figure 6
DEGs in the Smr¯, their specificity, and their effects on the performance of Plant PhysioSpace. A, The number of genes with an absolute fold change value of >1 in each stress group is demonstrated. Since there are 22,249 genes available in the space Smr¯, the ratio of DEGs to all genes among different stress groups spans from around 0.07% in BioMone (biotic, hormone, or both stresses) to around 5.8% in the Drought.Light (double stress) group. B, We explored the specificity of DEGs to stress groups. Among all 22,249 genes in Smr¯, only 2,905 (∼13%) are differentially expressed in one or more stress groups. From these 2,905 genes, 2,175 (∼10%) are specifically expressed in only one stress group, 488 (∼2%) are expressed in two stress groups, and 242 (∼1%) in more than two stress groups. Hence, we conclude that the majority of expressed genes in the Smr¯ are specific to one stress group. C, We used the heated single cells to study the effect of the 2,905 DEGs on applicability of Smr¯ as a reference. We compared the performance of Smr¯ against Smr¯ without the 2,905 DEGs, which we called the “reduced” Smr¯. As evident from the boxplot, the heat scores are still substantially different between control and heated cells, even when the reduced space is used, although the magnitude of the heat scores is decreased compared to when the complete space is used. In the boxplot, the median is shown with a line inside each box, the lower and upper hinges correspond to the first and third quartiles, the upper whisker extends from the hinge to the largest value no further than 1.5 × IQR from the hinge (or distance between the first and third quartiles), the lower whisker extends from the hinge to the smallest value at most 1.5 × IQR of the hinge, and data beyond the end of the whiskers are plotted individually. This figure is generated using ggplot2 package (Wickham, 2016).
Figure 7
Figure 7
Space trimming. A, Stress groups are clustered and for each group, LOOCV accuracy is calculated, written in parenthesis. Clustering is done using physio scores; physio scores are normalized using min–max normalization (values are rescaled to span from 0 to 1), and since physio score is a measure of similarity, 1normalizedphysioscores are used as the distance measure for clustering. Y-axis represents this distance measure. B, Close groups with low accuracy, written in red, are combined to form new stress groups, called meta-groups. Groups are considered close if they merge in the dendrogram in a height ˂0.5 (50% of maximum height). This cut-off height is shown in the figure with a dashed red line. In this figure, Salt, Drought, and Osmotic stress groups, marked with underlined text and brown color, merge into DrouSaTic meta-group; Hormone, Biotic, and Biotic.Hormone groups form BioMone meta-group, written in green with italic font, and Light and UV groups combine into LighUV, shown in light yellow.
Figure 8
Figure 8
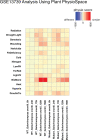
Analysis results of GSE13739. The GEO dataset GSE13739 is mapped against Smr¯using Plant PhysioSpace. The dataset provides samples of WT and MT Arabidopsis plants that are infected with G. orontii (Biotic stress). The MT plants are expected to be more resilient.

References

    1. Bergman NH (2007) Comparative Genomics. Humana Press, Springer Science & Business Media, Totowa, NJ https://www.ncbi.nlm.nih.gov/books/NBK1732/ - PubMed
    1. Bolger AM, Lohse M, Usadel B (2014) Trimmomatic: a flexible trimmer for Illumina sequence data. Bioinformatics 30: 2114–2120 - PMC - PubMed
    1. Boratyn GM, Camacho C, Cooper PS, Coulouris G, Fong A, Ma N, Madden TL, Matten WT, McGinnis SD, Merezhuk Y, et al. (2013) Blast: a more efficient report with usability improvements. Nucleic Acids Res 41: W29–W33 - PMC - PubMed
    1. Borrill P, Ramirez-Gonzalez R, Uauy C (2016) expVIP: a customisable RNA-seq data analysis and visualisation platform. Plant Physiol 170: 2172–2186 - PMC - PubMed
    1. Butler AP, Hoffman P, Smibert P, Papalexi E, Satija R (2018) Integrating single-cell transcriptomic data across different conditions, technologies, and species. Nat Biotechnol 36: 411–420 - PMC - PubMed

Publication types

LinkOut - more resources