. 2022 Jan;11(1):e2100684.
doi: 10.1002/adhm.202100684. Epub 2021 Nov 17.

Modeling Metastatic Colonization in a Decellularized Organ Scaffold-Based Perfusion Bioreactor

Affiliations

Modeling Metastatic Colonization in a Decellularized Organ Scaffold-Based Perfusion Bioreactor

Maria Rafaeva et al. Adv Healthc Mater. 2022 Jan.

Abstract

Metastatic cancer spread is responsible for most cancer-related deaths. To colonize a new organ, invading cells adapt to, and remodel, the local extracellular matrix (ECM), a network of proteins and proteoglycans underpinning all tissues, and a critical regulator of homeostasis and disease. However, there is a major lack in tools to study cancer cell behavior within native 3D ECM. Here, an in-house designed bioreactor, where mouse organ ECM scaffolds are perfused and populated with cells that are challenged to colonize it, is presented. Using a specialized bioreactor chamber, it is possible to monitor cell behavior microscopically (e.g., proliferation, migration) within the organ scaffold. Cancer cells in this system recapitulate cell signaling observed in vivo and remodel complex native ECM. Moreover, the bioreactors are compatible with co-culturing cell types of different genetic origin comprising the normal and tumor microenvironment. This degree of experimental flexibility in an organ-specific and 3D context, opens new possibilities to study cell-cell and cell-ECM interplay and to model diseases in a controllable organ-specific system ex vivo.

Keywords: cancer metastasis; experimental methods; extracellular matrix; specialized bioreactors.


Conflict of interest statement

The authors declare no conflict of interest.

Figures
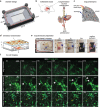
Figure 1
Figure 1
Design of decellularized organ scaffold‐based perfusion bioreactor and population with cancer cells. a) Chamber design schematic (dimensions in mm, cf. Figure S2, Supporting Information). b) Schematic for microsurgery and catheterization of one lung lobe for perfusion decellularization and introduction of cells. A lung lobe is excised along with the heart and catheterized through the aorta and the trachea. c) Schematic of lung liquid supply and drainage routes. d) Bioreactor chamber cross section showing: 1) heating element placed above or below the chamber, 2) transparent plastic lid, 3) chamber body, 4) metal chamber base, 5) aortic catheter, 6) tracheal catheter, 7) organ, and 8) optical glass window. e) Timeline of the lung lobe decellularization inside of a bioreactor chamber. Times shown since beginning of perfusion (deionized water 15 min, 0.5% DOC 24 h, medium perfusion before introducing cells). f) Live‐cell imaging of the lung bioreactor after population with 4T1‐H2B‐GFP breast cancer cells via trachea, monitored for 2 days. Simultaneous imaging of SHG (fibrillar collagens) and GFP signal (nuclei). Inset 1 shows a cell division event; inset 2 shows cell migration along collagen fiber (all scales in microns). See Movie S1, Supporting Information.
Figure 2
Figure 2
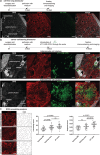
Cancer cells colonize the lung scaffold through the aortic route and remodel the ECM scaffold. a) Cell‐free bioreactor sample imaged for fibrillar collagens (by SHG) and collagen IV. b) 4T1‐H2B‐GFP populated bioreactor sample imaged for fibrillar collagens and collagen IV. Representative images of “intravascular cell clusters” (cells contained in the vessels) and “extravascular cell clusters” (cells colonizing parenchyma). n = 3 bioreactors, see Figure S4, Supporting Information for more examples. c) Quantitative analysis of ECM remodeling. Left panel: representative images and derived masks of regions of interest (ROI) of col IV‐stained lung parenchyma from cell‐free control bioreactor, 4T1 bioreactor in cell‐free area, and in area with an extravascular cluster of 4T1s. Right panel: quantification of lacunarity (irregularity of patterns) and endpoints (endings of ECM branches) from col IV created masks by TWOMBLI plugin. Data points present values per ROIs, Mean ± SD. n = 4 bioreactors with 4T1, n = 3 control bioreactors (BR). p values are calculated by one‐way ANOVA test. All scales in microns.
Figure 3
Figure 3
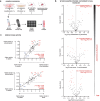
Cancer cells in the lung bioreactor recapitulate in vivo metastatic tyrosine kinase signaling. a) Schematic showing sample preparation and processing. b) Volcano plots showing that lung bioreactors have the least significant changes (number of changed peptides, mean fold change—FC) of peptide intensities relative to lung metastases, followed by primary tumors and cells cultured on plastic. Significantly changed values (unpaired two‐tailed t‐test, p < 0.05) are in red. c) Positive correlation of the relative tyrosine kinase activity (mean kinase statistic values) between 1) 4T1‐H2B‐GFP lung bioreactor and lung metastasis (normalized to culture on plastic). Simple linear regression analysis: R 2 = 0.673, p < 0.0001; 2) 4T1‐H2B‐GFP lung bioreactor and primary tumor (normalized to culture on plastic). Simple linear regression analysis: R 2 = 0.691, p <0.0001. n = 3 biological repeats for all conditions, except n = 2 for primary tumor. Top upregulated kinases are highlighted in red (mean kinase statistic > 1 in lung bioreactor) and top downregulated (mean kinase statistic < −0.4 in lung bioreactor) in blue. For dataset see Tables S1, S2, Supporting Information.
Figure 4
Figure 4
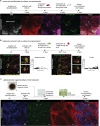
Lung bioreactor as a platform for culturing multiple cell types. a) mNF1 and 4T1‐H2B‐GFP co‐culture bioreactor imaged for fibrillar collagens and collagen IV. See Figure S6, Supporting Information for an additional example. b) Cell tracking of human melanoma cells (FM‐82‐GFP) and primary T‐cells after 24 h of co‐culture. Insets show melanoma cells covered with T‐cells. Tracks are shown in yellow. Graphs present track displacement and maximum speed (µm min−1) of 148 cancer cell migration tracks and 370 T‐cell migration tracks, respectively. Automated tracking performed for a period of 2 h. n = 1 bioreactor. c) Liver bioreactor populated with patient‐derived organoids cells from colorectal cancer metastasis. Organoids were pre‐conditioned for 24 h in medium without growth factors and cultured in the same conditions for 48 h post‐injection. DAPI shows cell nuclei, ki‐67 staining shows nuclei of proliferating cells. All scales in microns.

References

    1. Discher D. E., Janmey P., Wang Y. L., Science 2005, 310, 1139. - PubMed
    1. Humphries J. D., Byron A., Humphries M. J., J. Cell Sci. 2006, 119, 3901. - PMC - PubMed
    1. Hynes R. O., Naba A., Cold Spring Harb. Perspect. Biol. 2012, 4, a004903. - PMC - PubMed
    1. Iozzo R. V., Gubbiotti M. A., Matrix Biol. 2018, 71, 1. - PMC - PubMed
    1. Winkler J., Abisoye‐Ogunniyan A., Metcalf K. J., Werb Z., Nat. Commun. 2020, 11, 5120. - PMC - PubMed

Publication types

LinkOut - more resources