. 2022 Feb 1;8(2):287-291.
doi: 10.1001/jamaoncol.2021.5153.

Implications of Selection Bias Due to Delayed Study Entry in Clinical Genomic Studies

Collaborators, Affiliations

Implications of Selection Bias Due to Delayed Study Entry in Clinical Genomic Studies

Samantha Brown et al. JAMA Oncol. .

Abstract

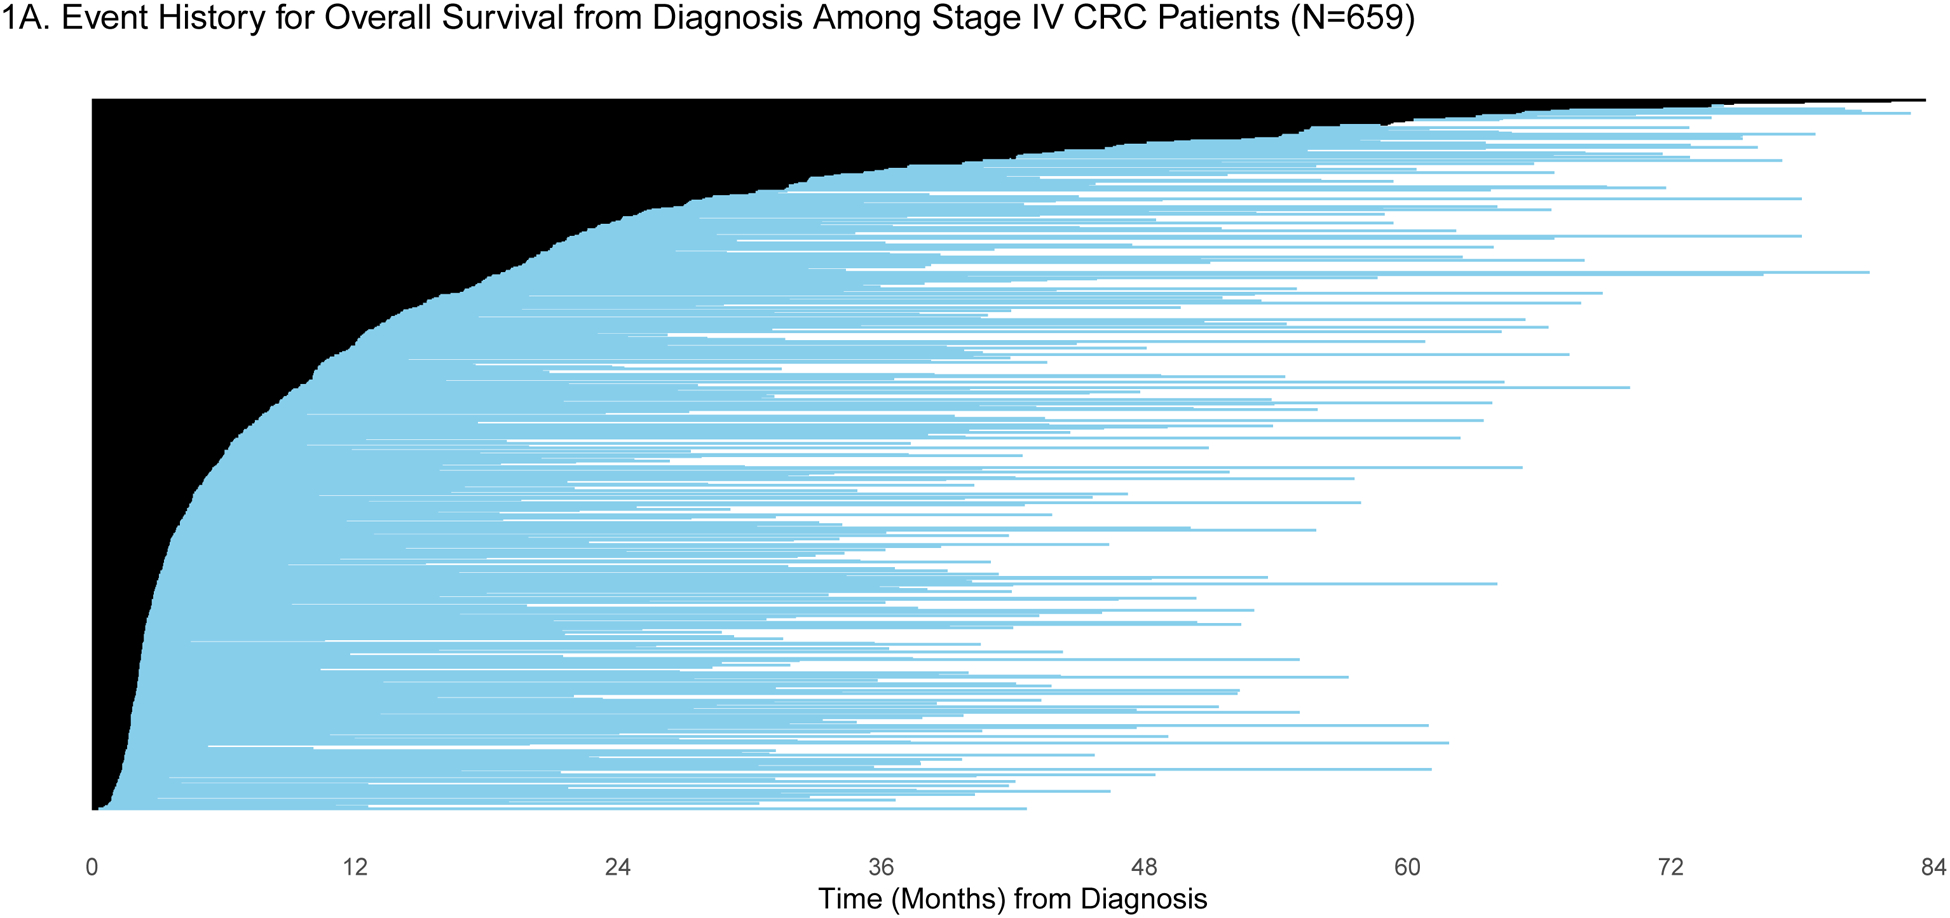
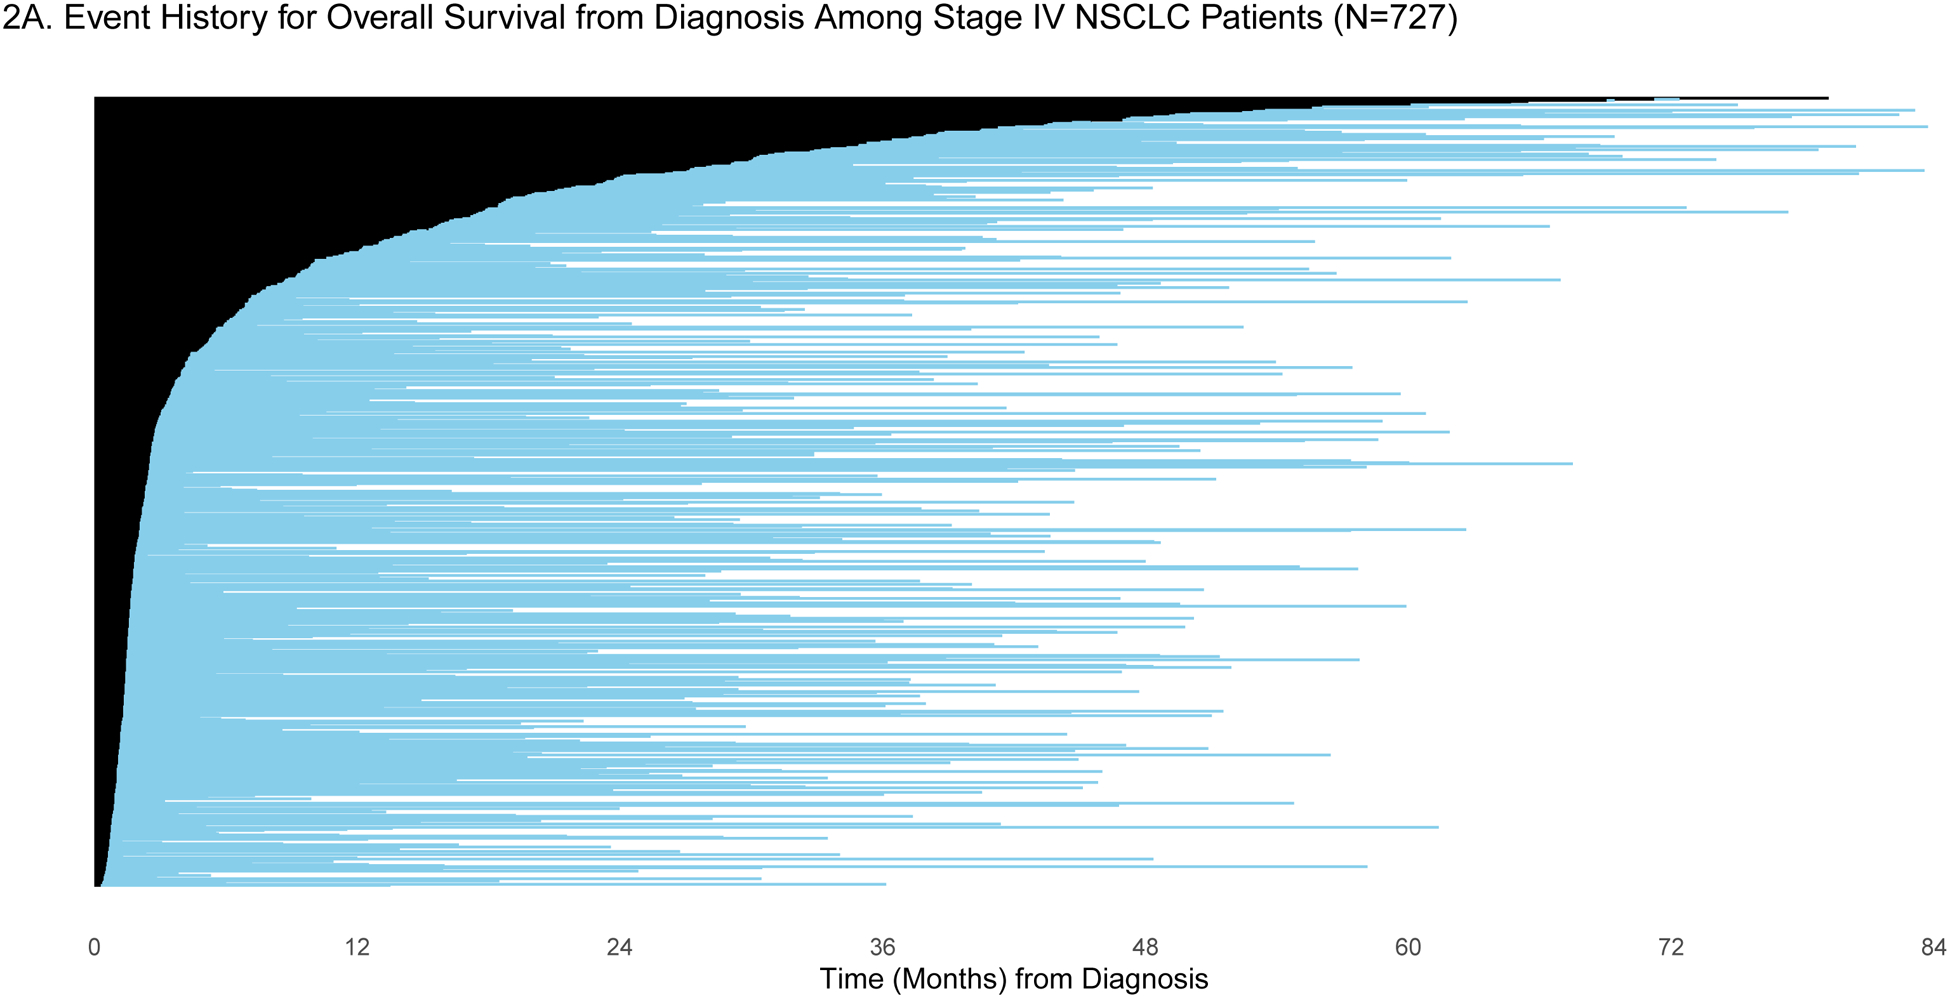
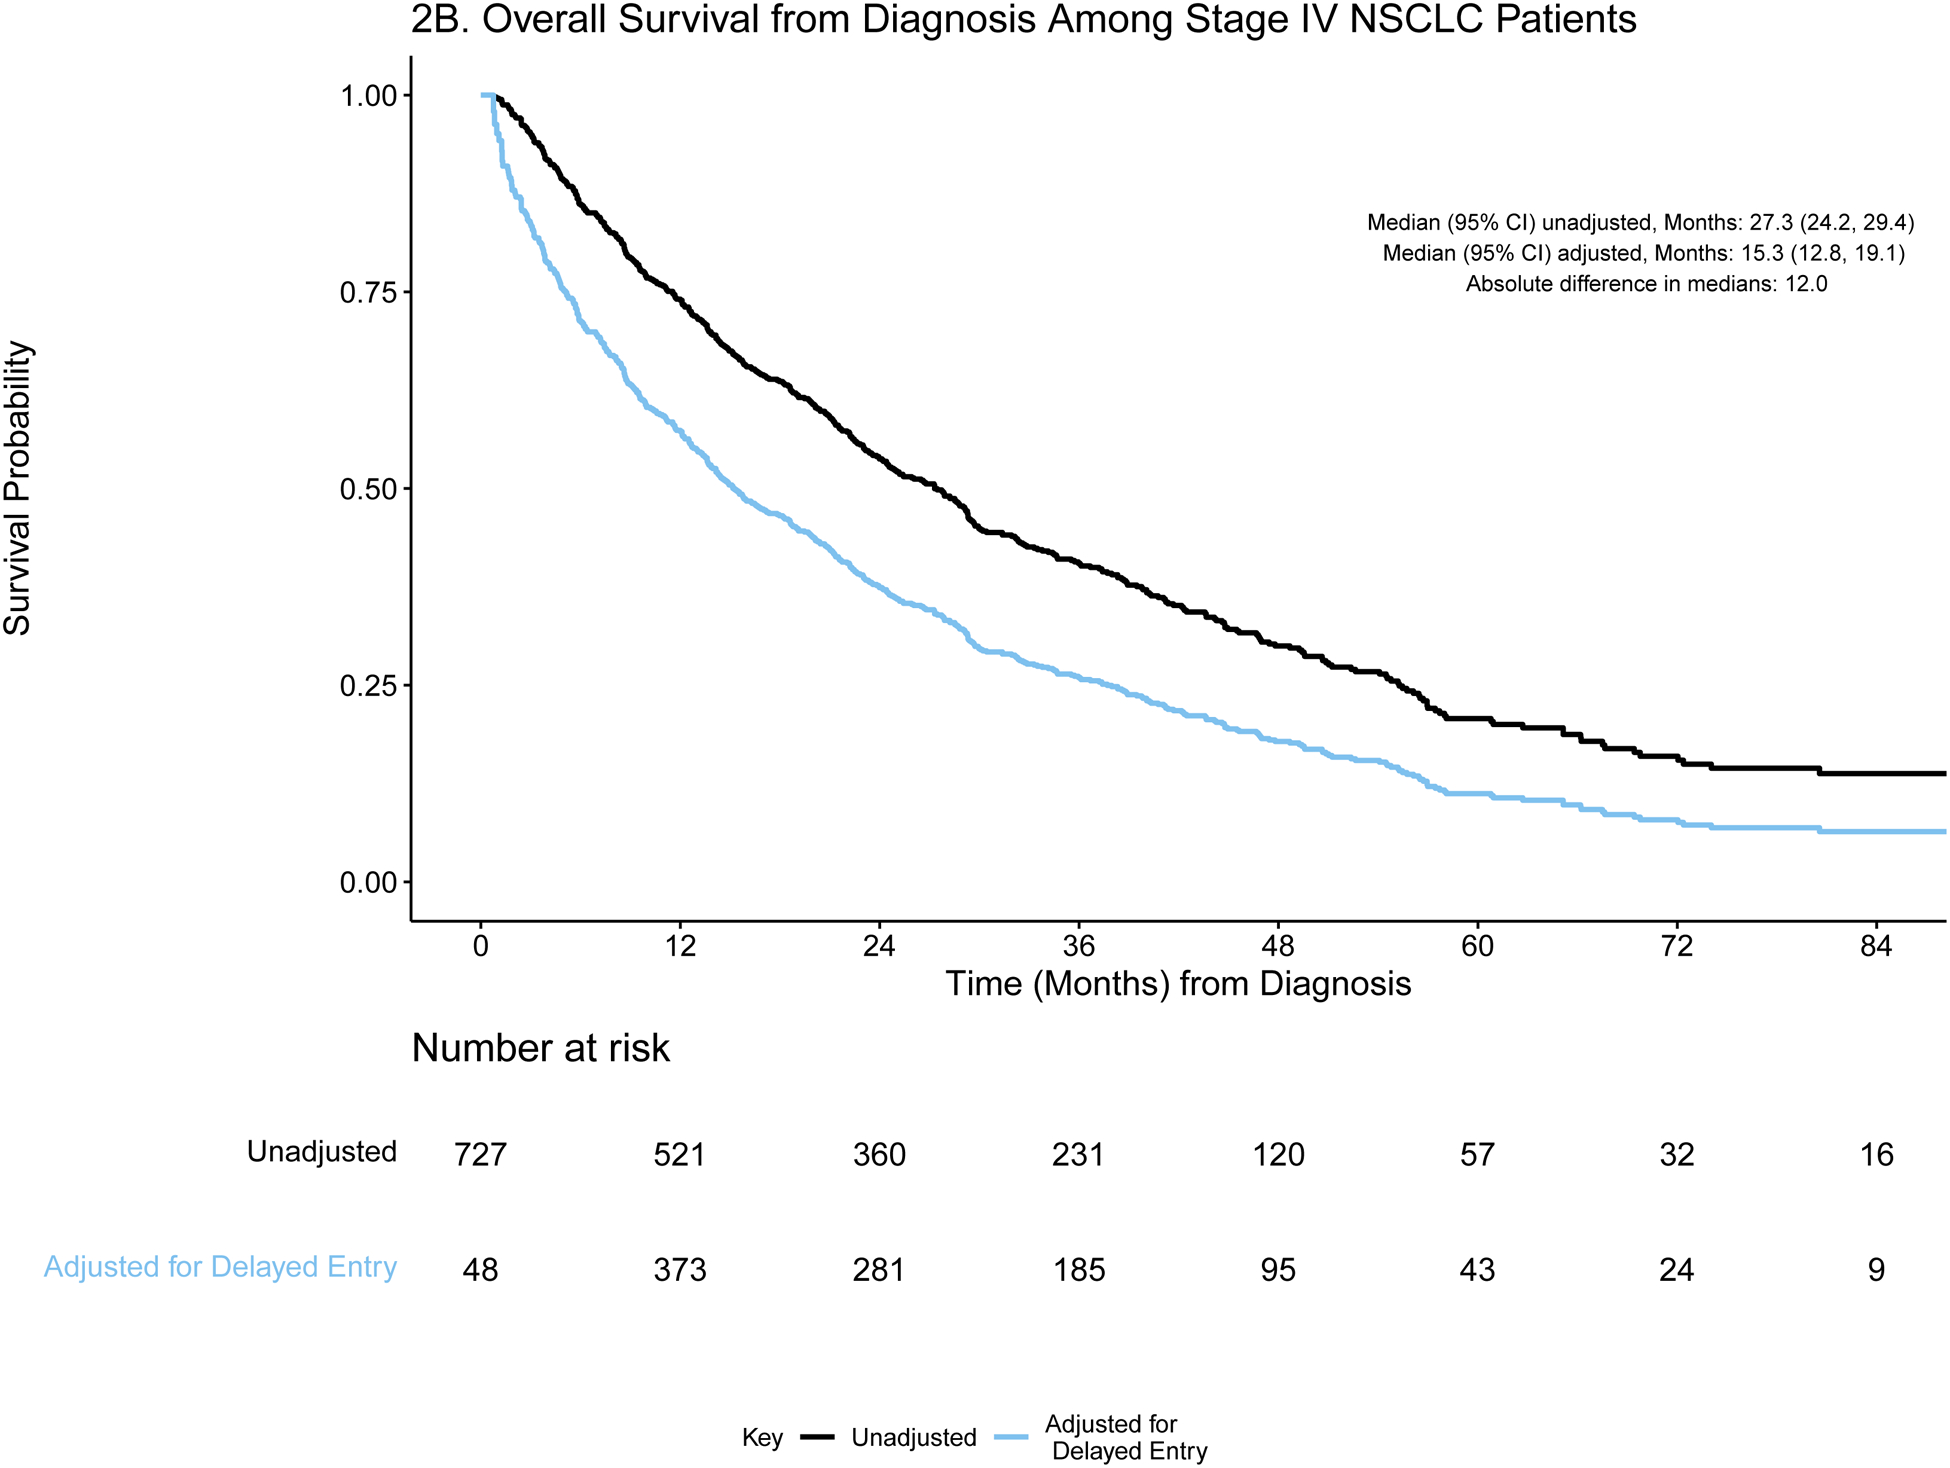
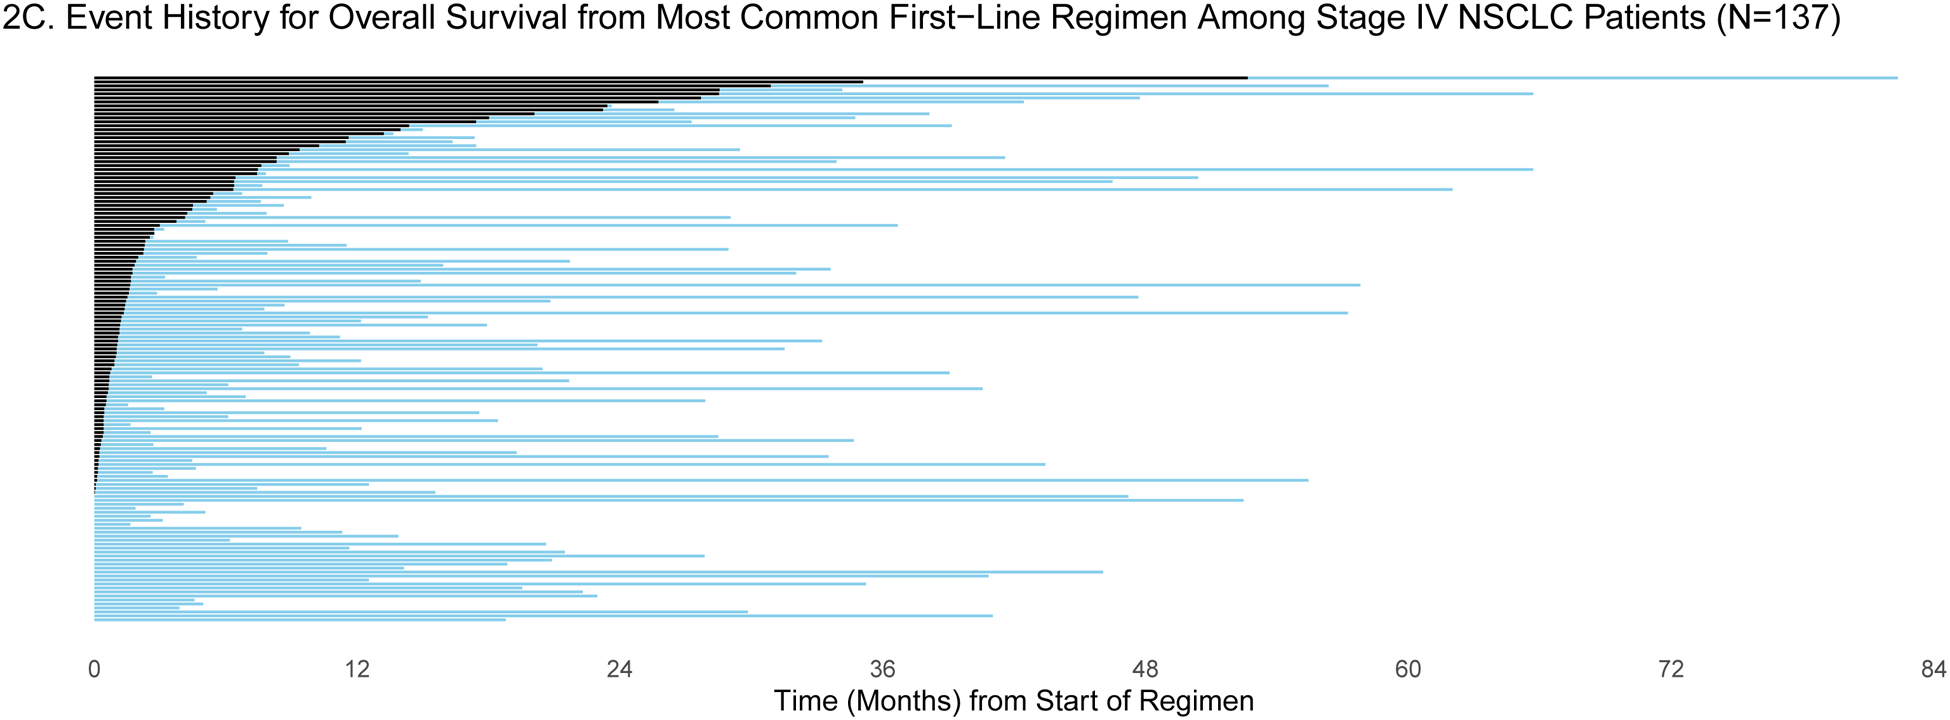
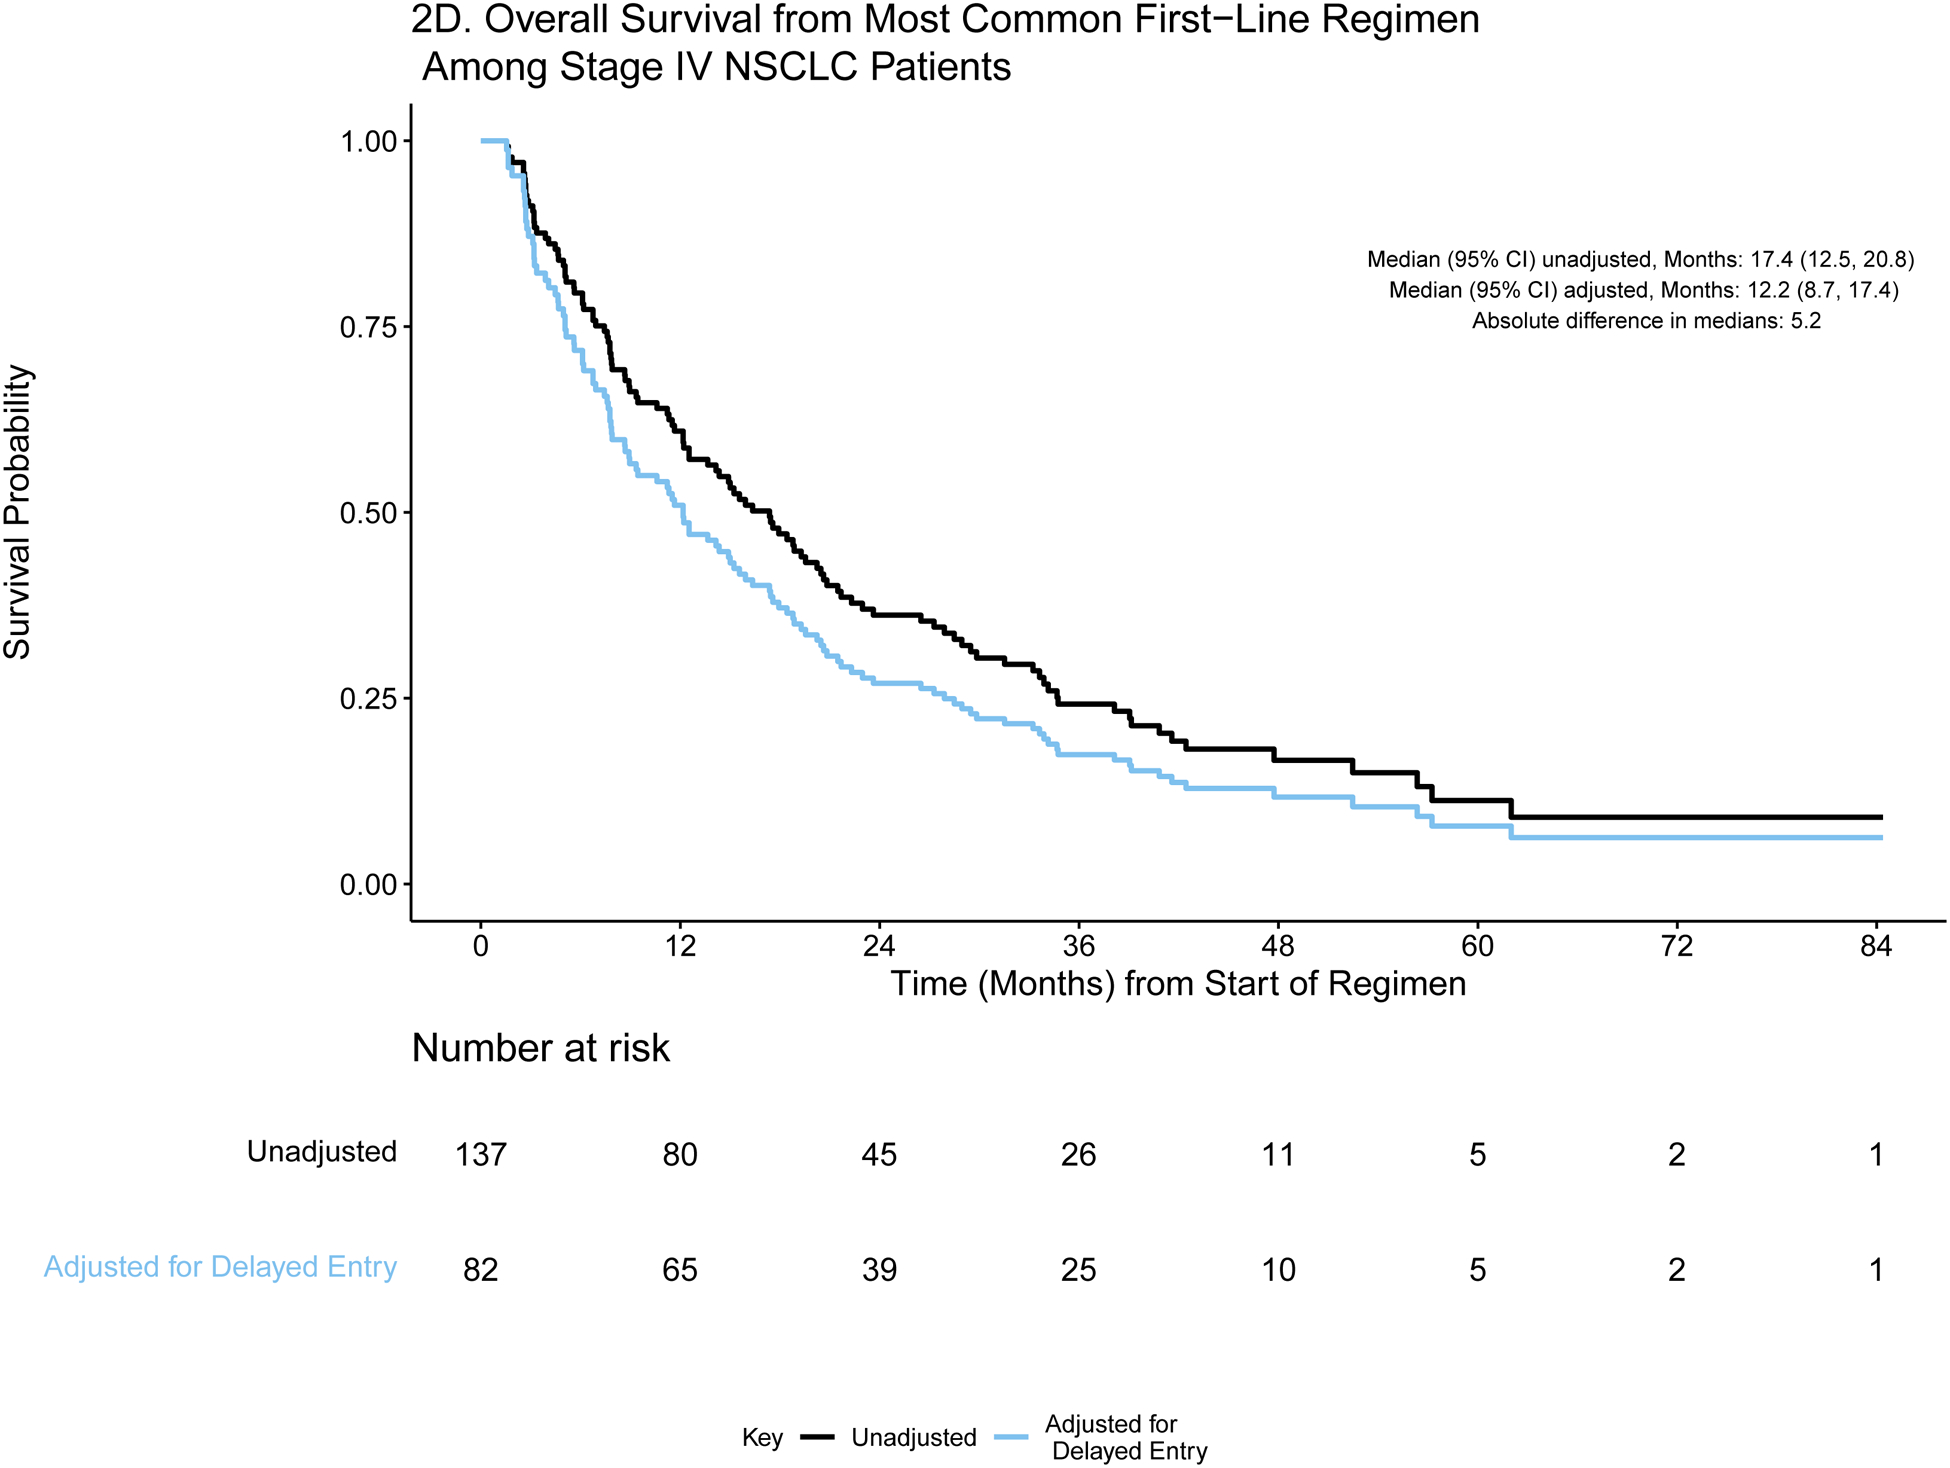
Importance: Real-world data sets that combine clinical and genomic data may be subject to left truncation (when potential study participants are not included because they have already passed the milestone of interest at the time of study recruitment). The lapse between diagnosis and molecular testing can present analytic challenges and threaten the validity and interpretation of survival analyses.

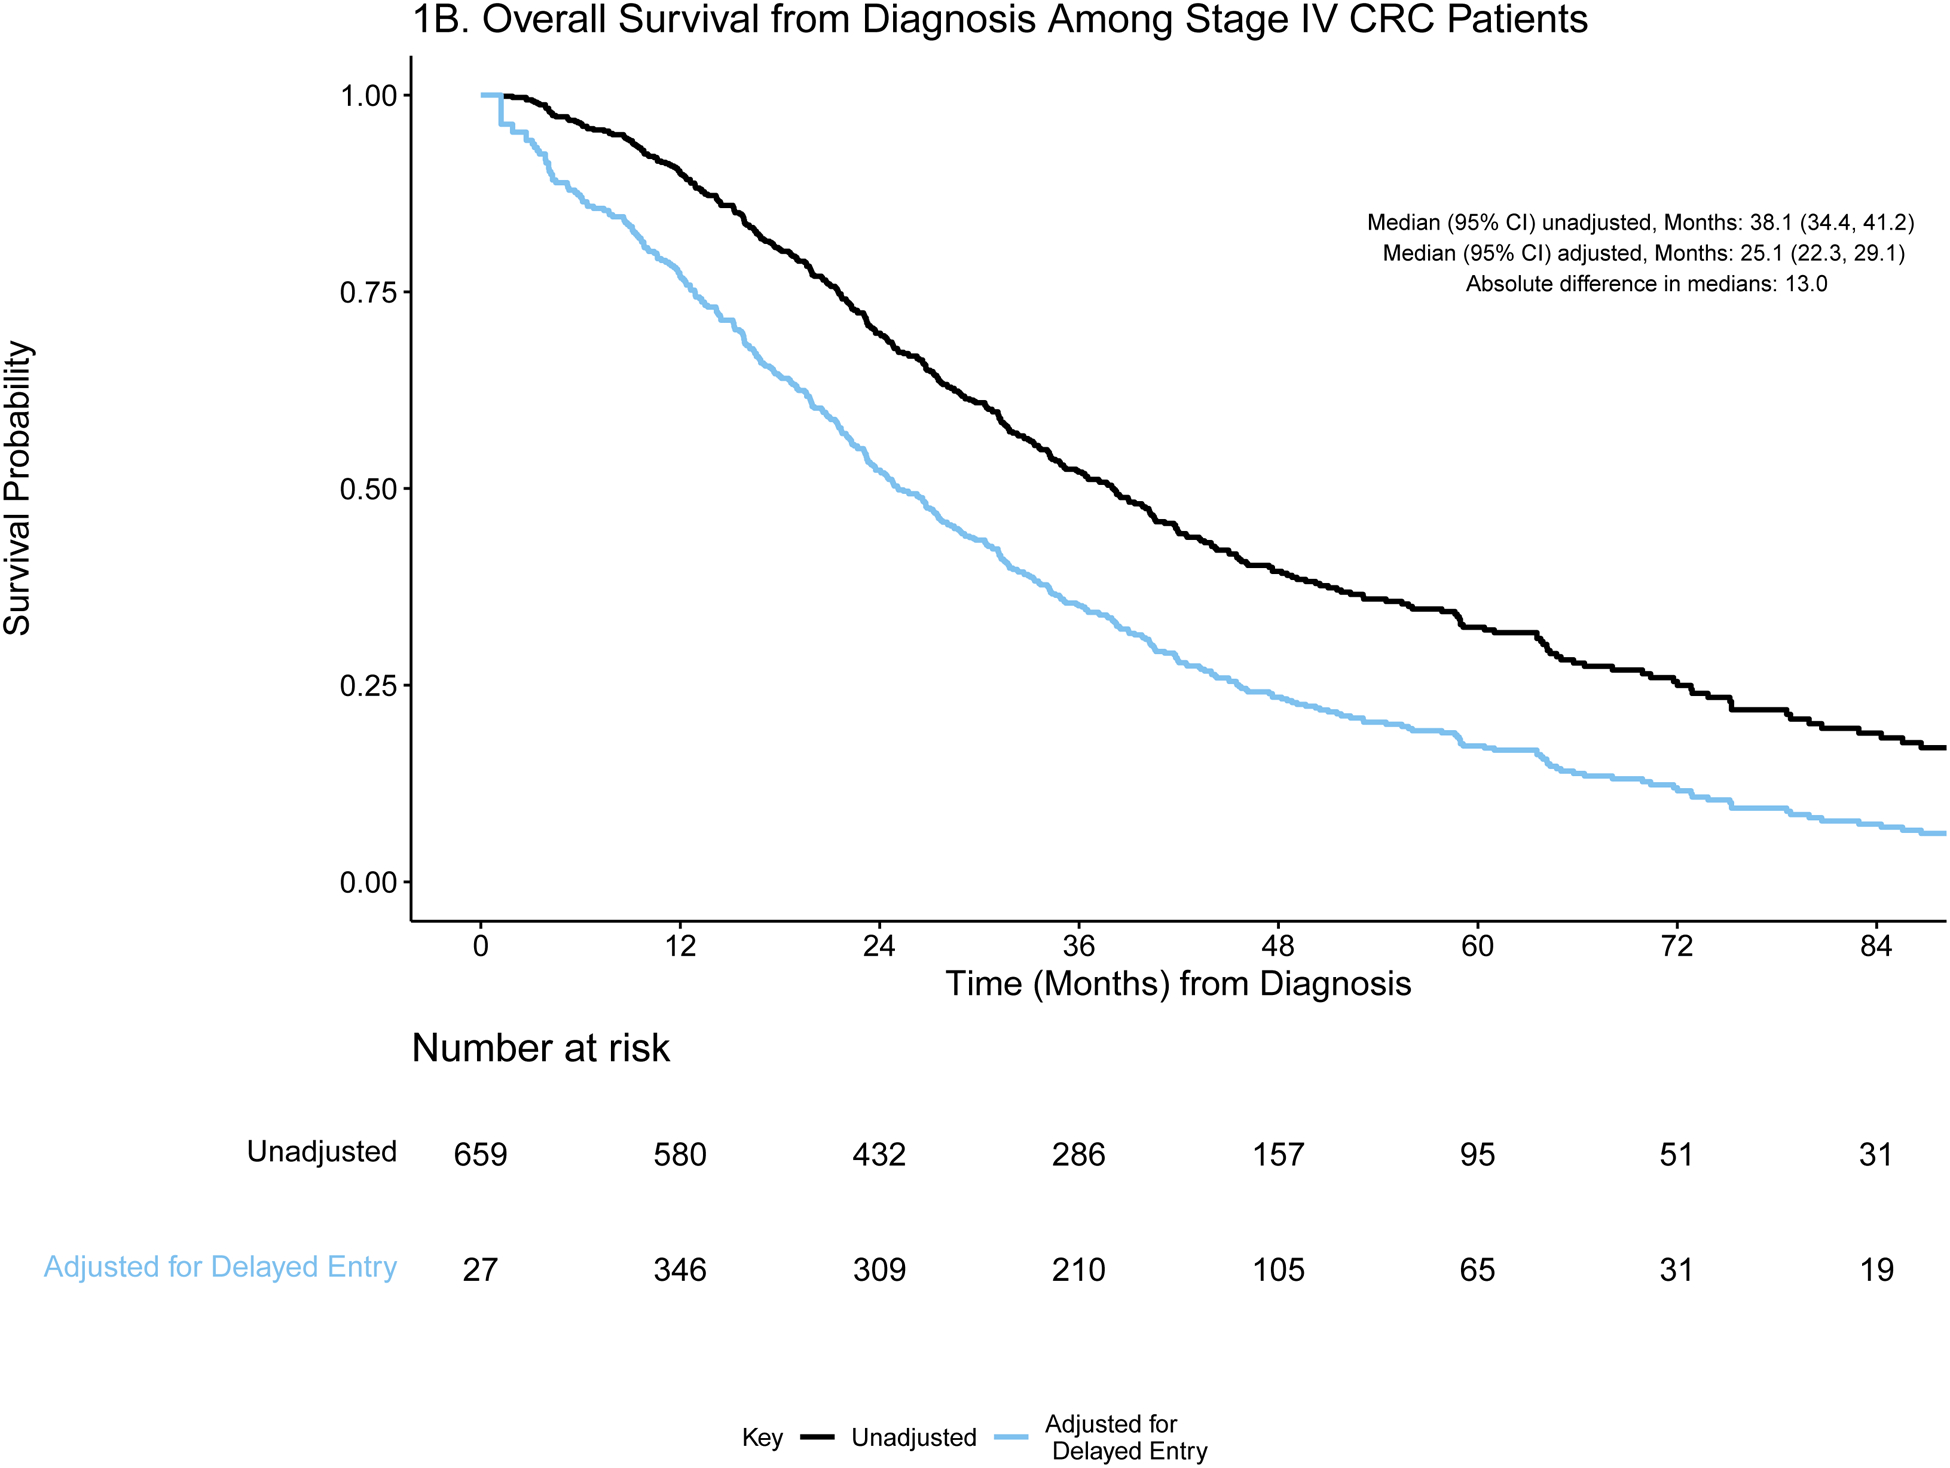
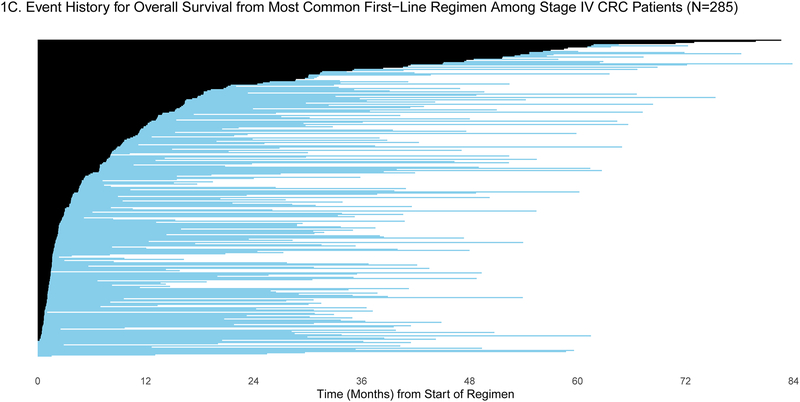
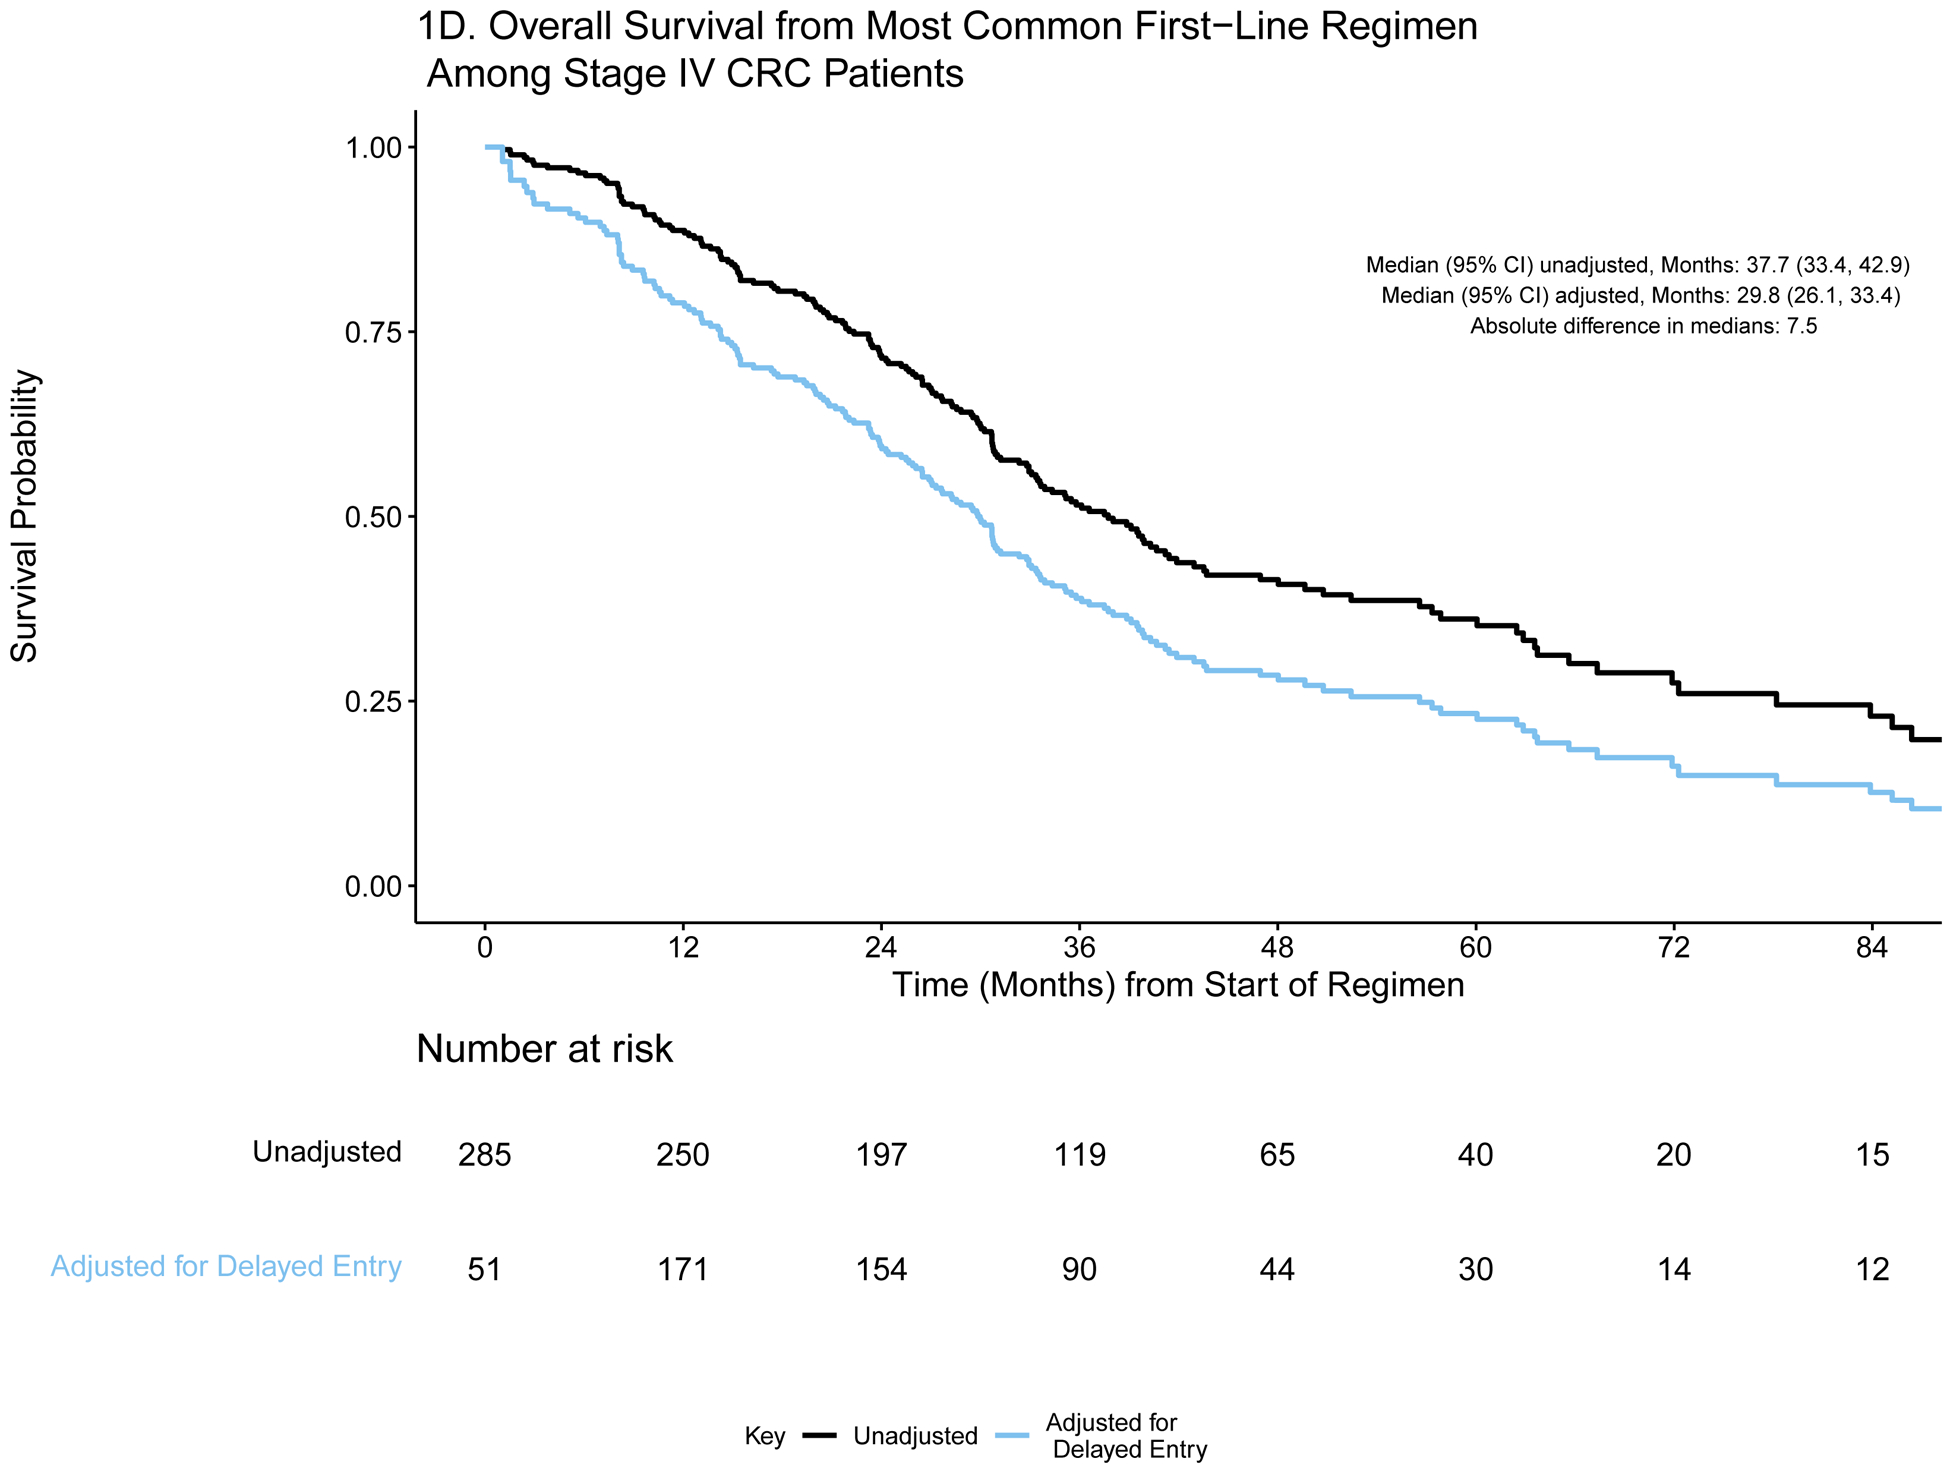
Observations: Effects of ignoring left truncation when estimating overall survival are illustrated using data from the American Association for Cancer Research (AACR) Project Genomics Evidence Neoplasia Information Exchange Biopharma Collaborative (GENIE BPC), and a straightforward risk-set adjustment approach is described. Ignoring left truncation results in overestimation of overall survival: unadjusted median survival estimates from diagnosis among patients with stage IV non-small cell lung cancer or stage IV colorectal cancer were overestimated by more than 1 year.

Conclusions and relevance: Clinicogenomic data are a valuable resource for evaluation of real-world cancer outcomes and should be analyzed using appropriate methods to maximize their potential. Analysts must become adept at application of appropriate statistical methods to ensure valid, meaningful, and generalizable research findings.


Figures

Figure 1:
Figure 1:
A) Event history for overall survival from diagnosis among stage IV CRC patients (N=659). Each patient’s survival time from diagnosis is indicated by a blue line with a black line overlaid to illustrate duration of delayed study entry. B) Kaplan-Meier curves illustrating overall survival from diagnosis among stage IV CRC patients with and without adjustment for delayed study entry. C) Event history for overall survival from most common first-line regimen among stage IV CRC patients (N=285). Each patient’s survival time from start of regimen is indicated by a blue line with a black line overlaid to illustrate duration of delayed study entry. D) Kaplan-Meier curves illustrating overall survival from start of most common first-line regimen among stage IV CRC patients with and without adjustment for delayed study entry.
Figure 1:
Figure 1:
A) Event history for overall survival from diagnosis among stage IV CRC patients (N=659). Each patient’s survival time from diagnosis is indicated by a blue line with a black line overlaid to illustrate duration of delayed study entry. B) Kaplan-Meier curves illustrating overall survival from diagnosis among stage IV CRC patients with and without adjustment for delayed study entry. C) Event history for overall survival from most common first-line regimen among stage IV CRC patients (N=285). Each patient’s survival time from start of regimen is indicated by a blue line with a black line overlaid to illustrate duration of delayed study entry. D) Kaplan-Meier curves illustrating overall survival from start of most common first-line regimen among stage IV CRC patients with and without adjustment for delayed study entry.
Figure 2:
Figure 2:
A) Event history for overall survival from diagnosis among stage IV NSCLC patients (N=727). Each patient’s survival time from diagnosis is indicated by a blue line with a black line overlaid to illustrate duration of delayed study entry. B) Kaplan-Meier curves illustrating overall survival from diagnosis among stage IV NSCLC patients with and without adjustment for delayed study entry. C) Event history for overall survival from most common first-line regimen among stage IV NSCLC patients (N=137). Each patient’s survival time from start of regimen is indicated by a blue line with a black line overlaid to illustrate duration of delayed study entry. D) Kaplan-Meier curves illustrating overall survival from start of most common first-line regimen among stage IV NSCLC patients with and without adjustment for delayed study entry.
Figure 2:
Figure 2:
A) Event history for overall survival from diagnosis among stage IV NSCLC patients (N=727). Each patient’s survival time from diagnosis is indicated by a blue line with a black line overlaid to illustrate duration of delayed study entry. B) Kaplan-Meier curves illustrating overall survival from diagnosis among stage IV NSCLC patients with and without adjustment for delayed study entry. C) Event history for overall survival from most common first-line regimen among stage IV NSCLC patients (N=137). Each patient’s survival time from start of regimen is indicated by a blue line with a black line overlaid to illustrate duration of delayed study entry. D) Kaplan-Meier curves illustrating overall survival from start of most common first-line regimen among stage IV NSCLC patients with and without adjustment for delayed study entry.

References

    1. Chubak J, Boudreau DM, Wirtz HS, et al. Threats to validity of nonrandomized studies of postdiagnosis exposures on cancer recurrence and survival. J Natl Cancer Inst. 2013;105(19):1456–62. doi: 10.1093/jnci/djt211. Epub 2013 Aug 12. - DOI - PMC - PubMed
    1. Betensky RA, Mandel M. Recognizing the problem of delayed entry in time-to-event studies: Better late than never for clinical neuroscientists. Ann Neurol. 2015;78(6):839–44. doi: 10.1002/ana.24538. Epub 2015 Nov 13. - DOI - PMC - PubMed
    1. Schisterman EF, Cole SR, Ye A, et al. Accuracy loss due to selection bias in cohort studies with left truncation. Paediatr Perinat Epidemiol. 2013;27(5):491–502. doi: 10.1111/ppe.12073. - DOI - PMC - PubMed
    1. Cain KC, Harlow SD, Little RJ, et al. Bias due to left truncation and left censoring in longitudinal studies of developmental and disease processes. Am J Epidemiol. 2011;173(9):1078–84. doi: 10.1093/aje/kwq481. Epub 2011 Mar 21. - DOI - PMC - PubMed
    1. Haneuse S, Daniels M. A General Framework for Considering Selection Bias in EHR-Based Studies: What Data Are Observed and Why? EGEMS (Wash DC). 2016. Aug 31;4(1):1203. doi: 10.13063/2327-9214.1203. - DOI - PMC - PubMed

Publication types