. 2021 Nov 5;374(6568):717-723.
doi: 10.1126/science.abj2949. Epub 2021 Nov 4.

Profiling cellular diversity in sponges informs animal cell type and nervous system evolution

Affiliations

Profiling cellular diversity in sponges informs animal cell type and nervous system evolution

Jacob M Musser et al. Science. .

Abstract

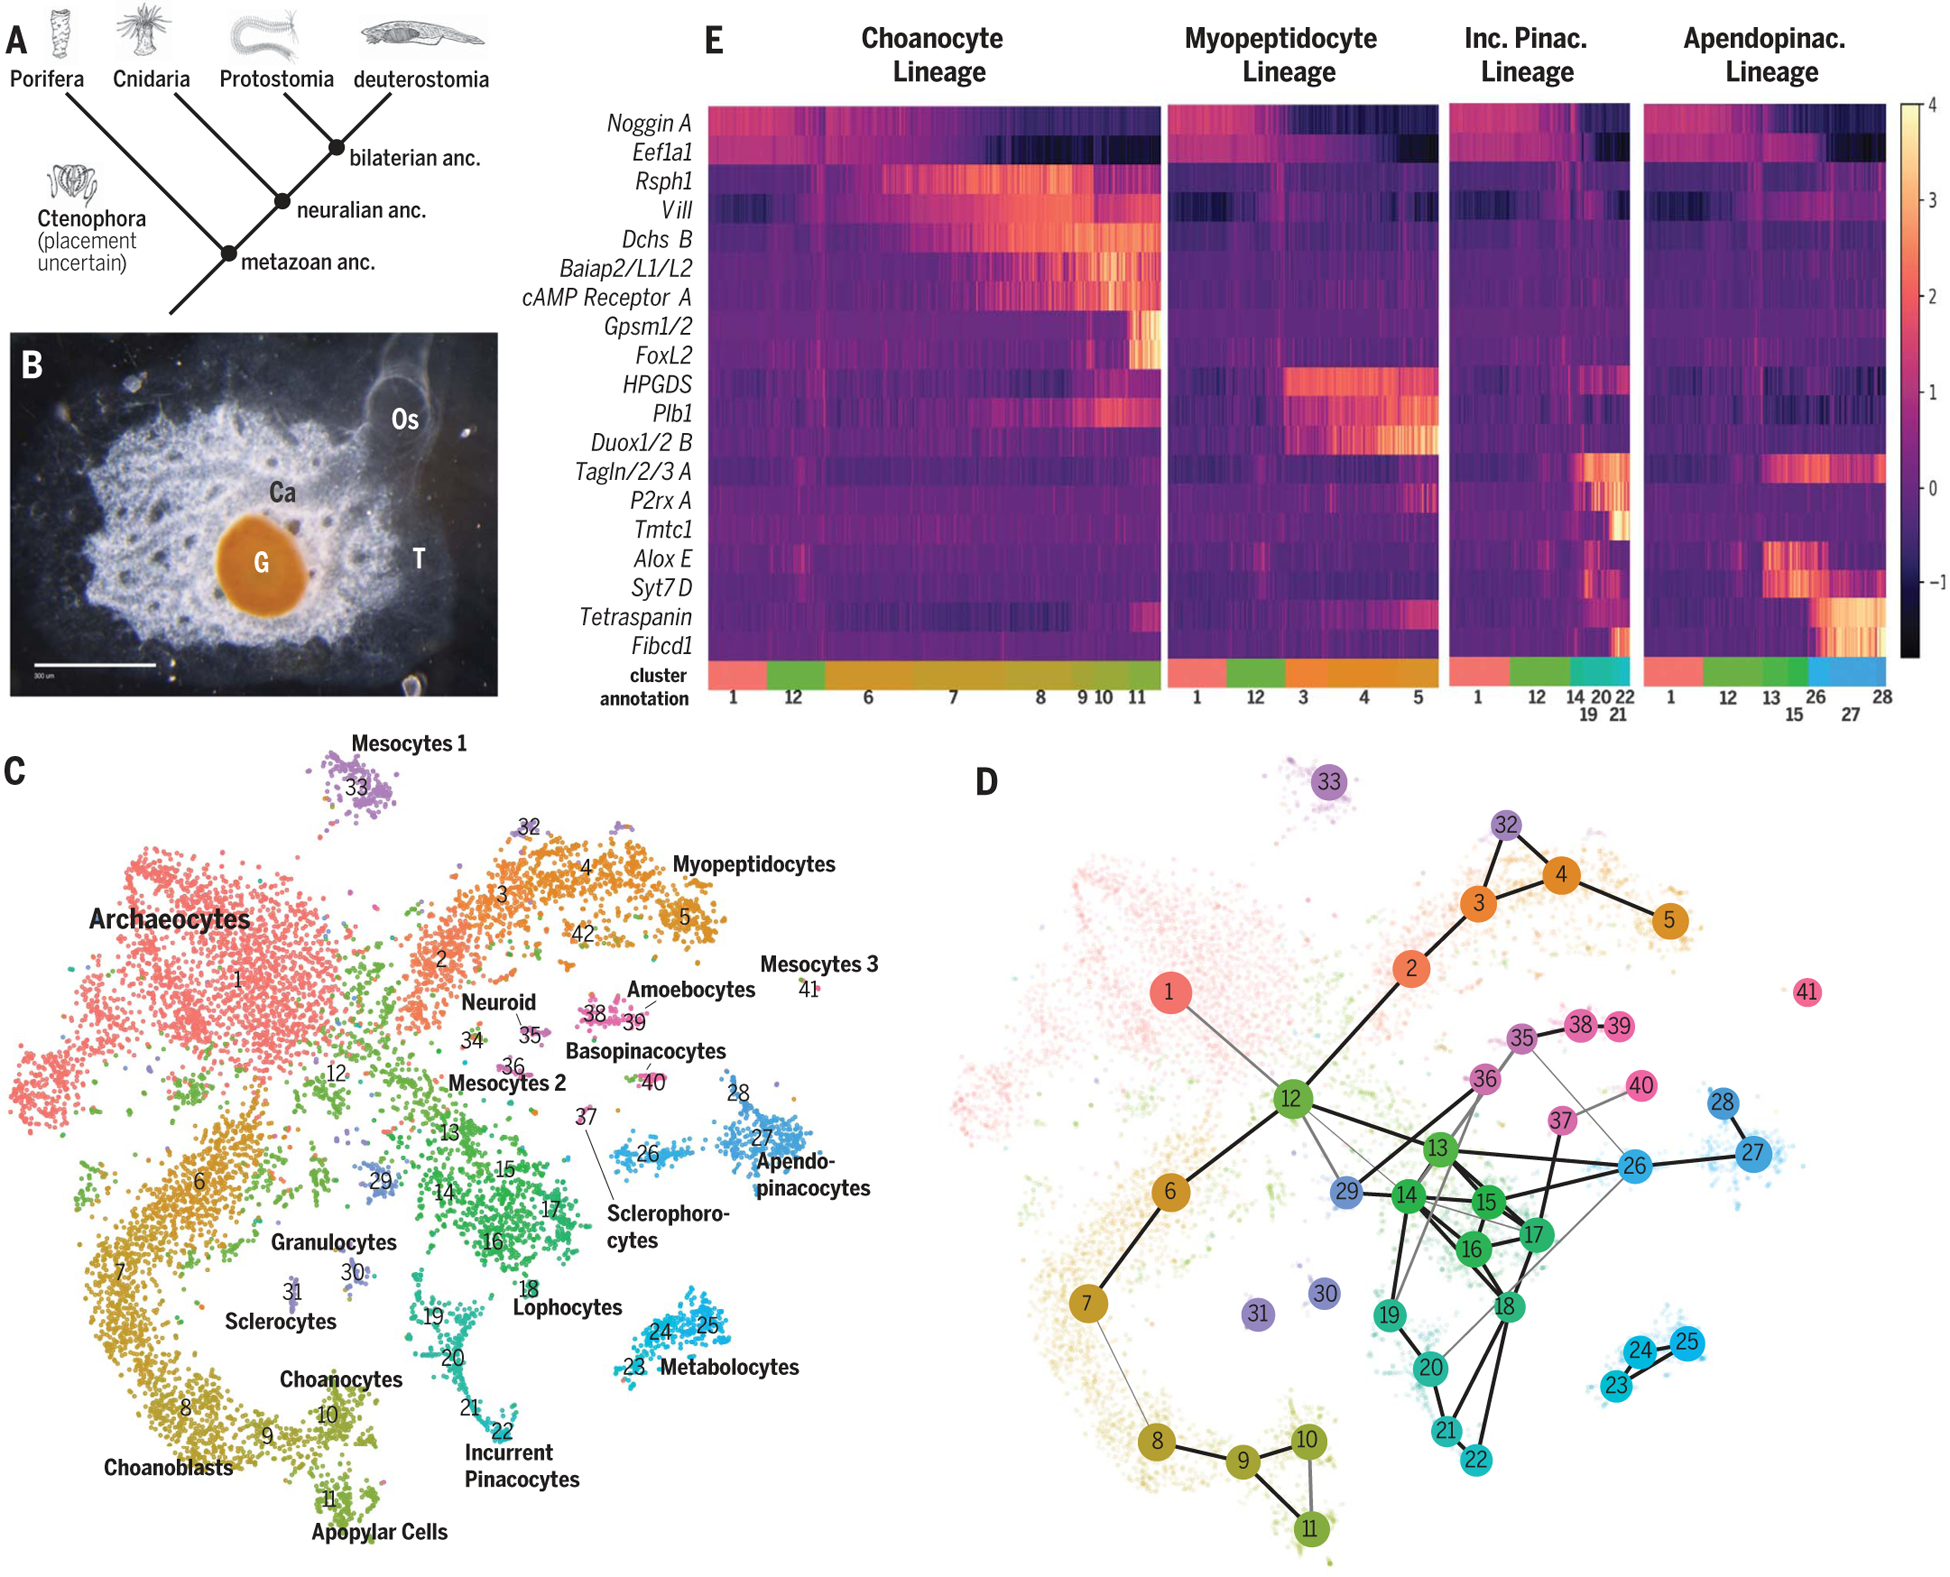
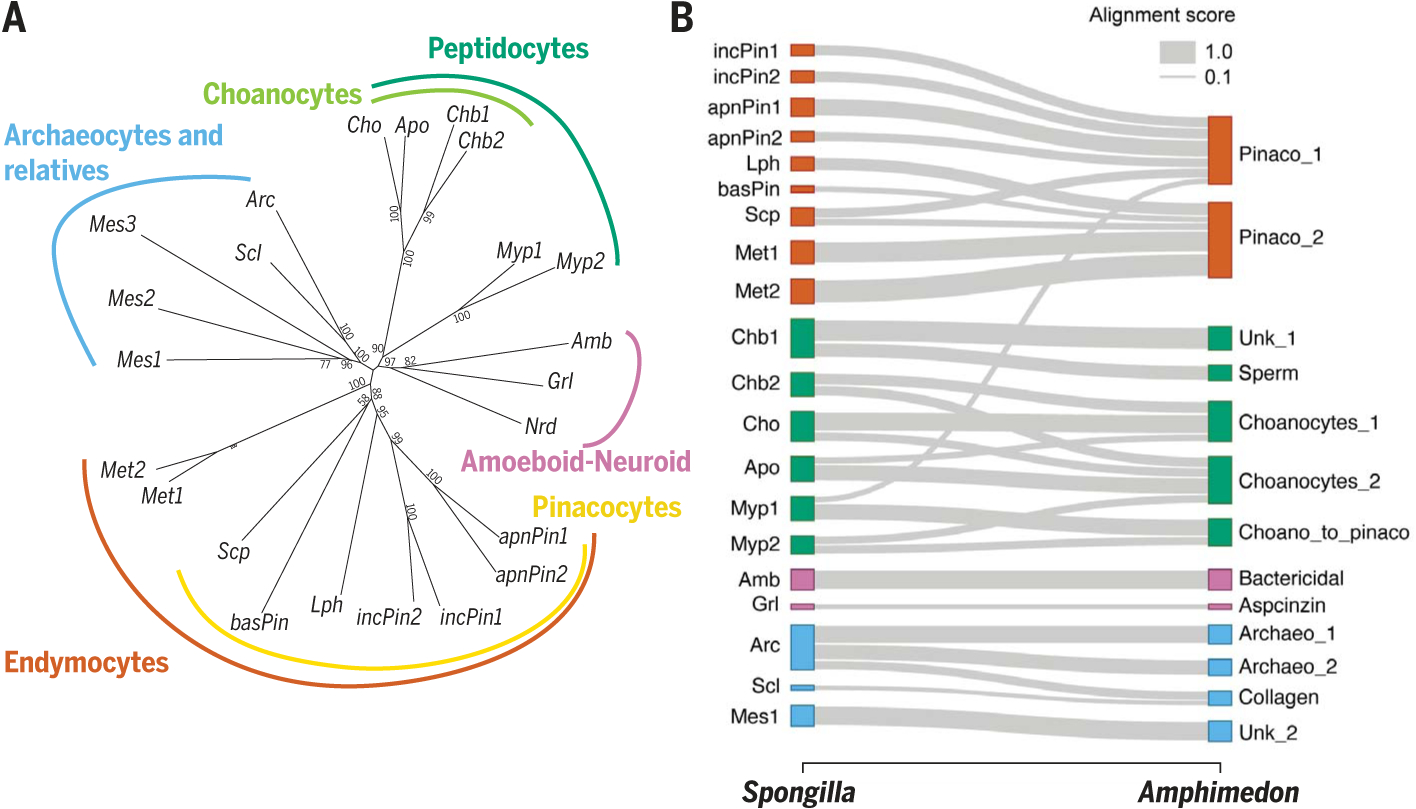
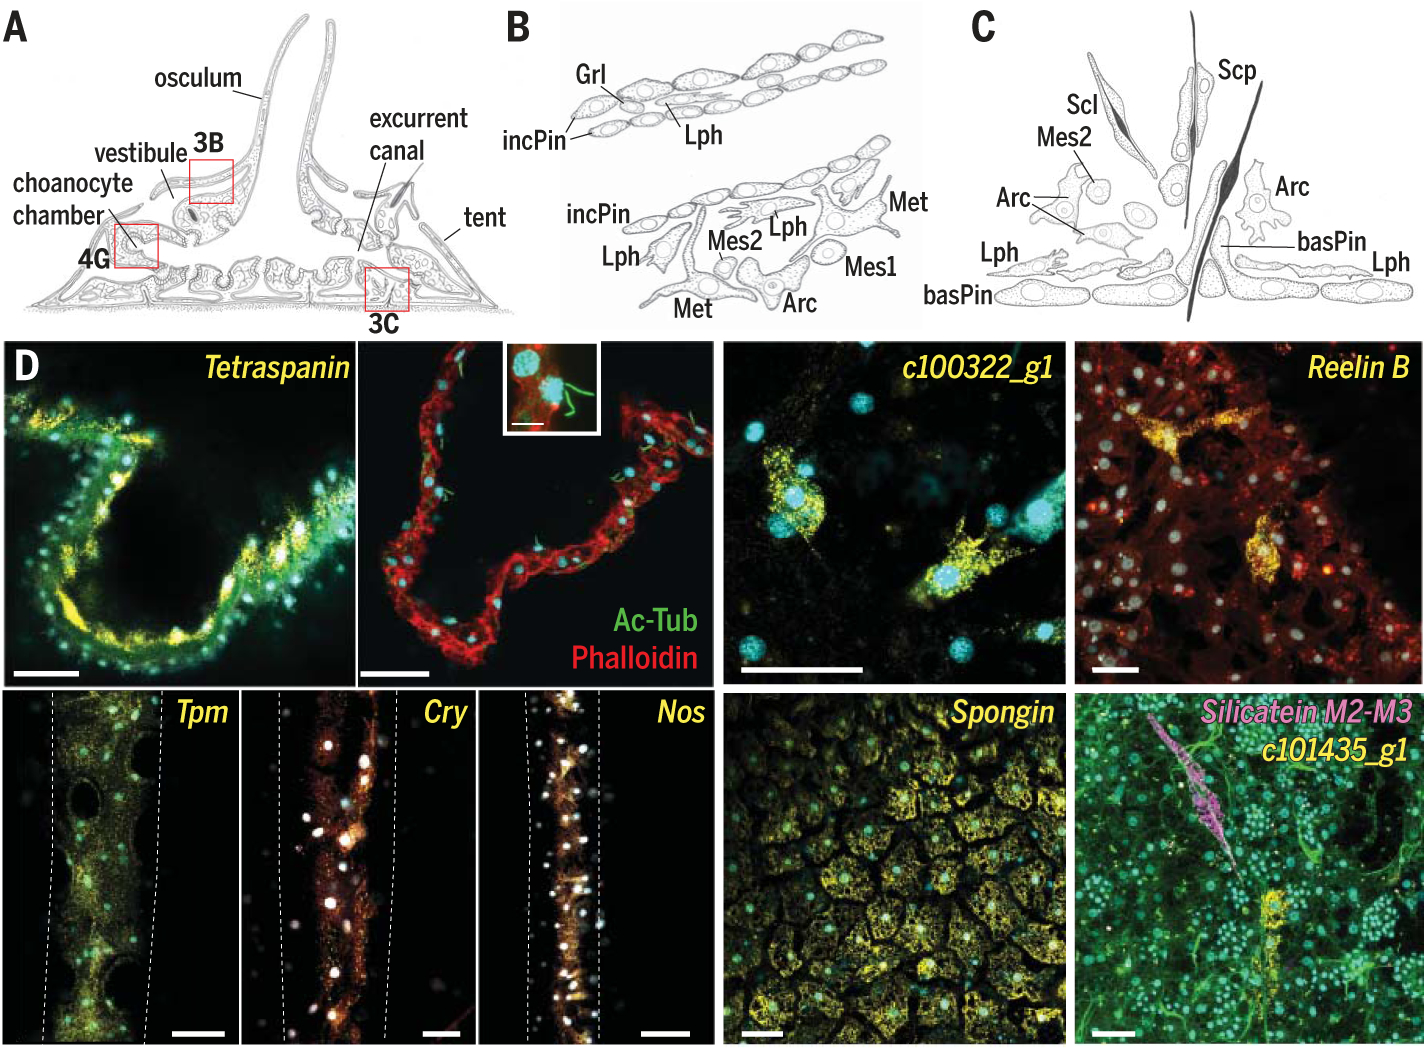
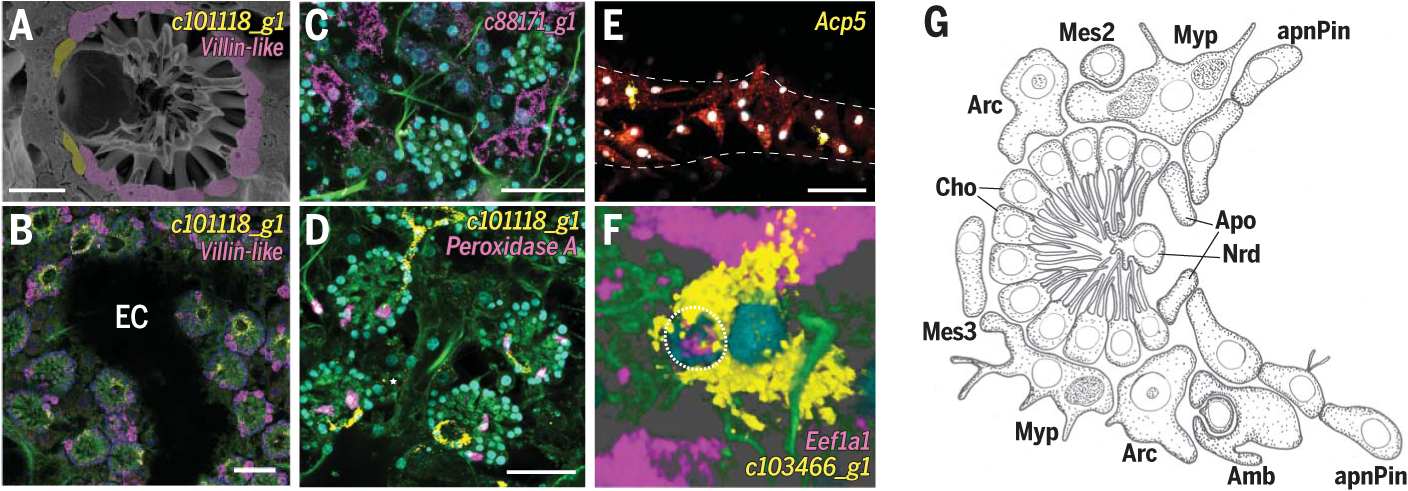
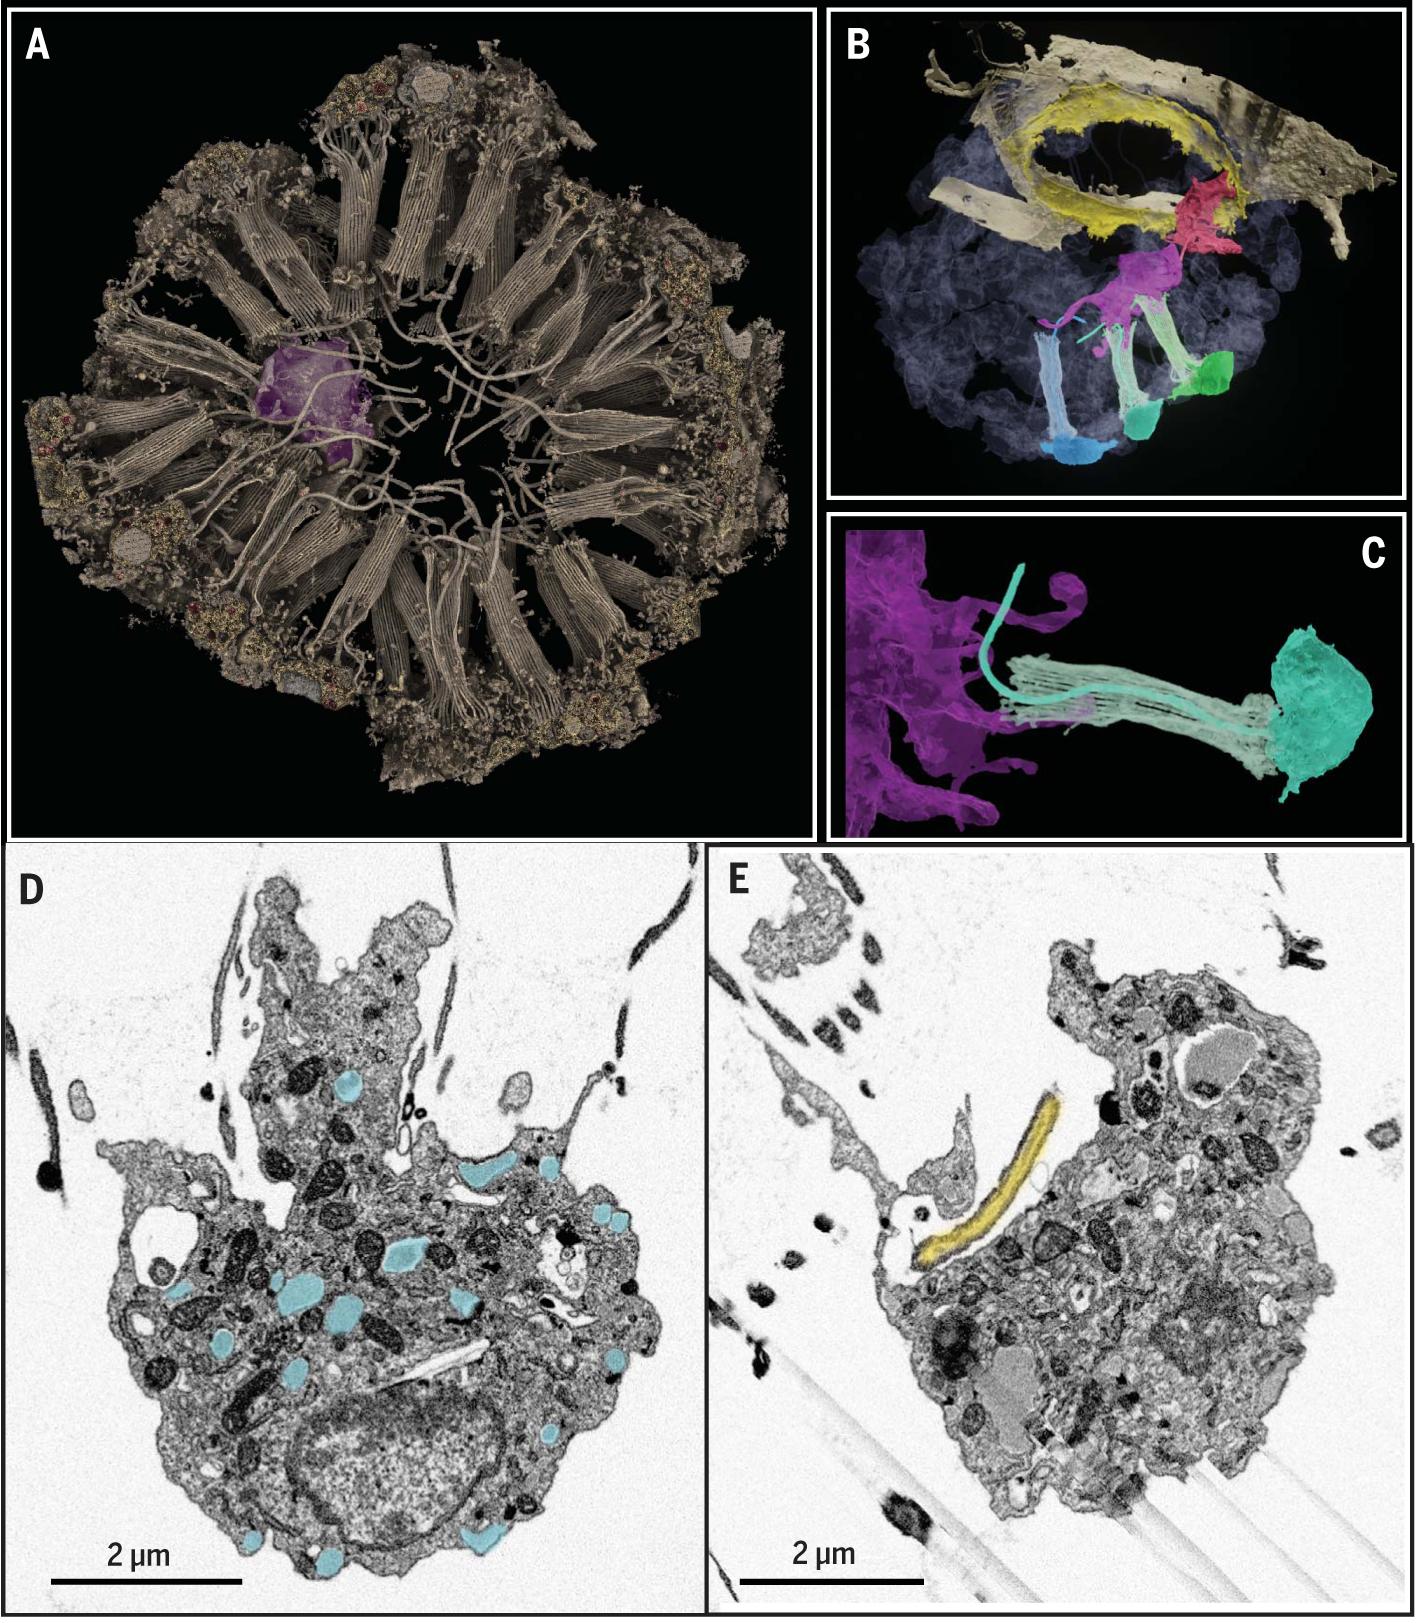
The evolutionary origin of metazoan cell types such as neurons and muscles is not known. Using whole-body single-cell RNA sequencing in a sponge, an animal without nervous system and musculature, we identified 18 distinct cell types. These include nitric oxide–sensitive contractile pinacocytes, amoeboid phagocytes, and secretory neuroid cells that reside in close contact with digestive choanocytes that express scaffolding and receptor proteins. Visualizing neuroid cells by correlative x-ray and electron microscopy revealed secretory vesicles and cellular projections enwrapping choanocyte microvilli and cilia. Our data show a communication system that is organized around sponge digestive chambers, using conserved modules that became incorporated into the pre- and postsynapse in the nervous systems of other animals.


Conflict of interest statement

Competing interests: The authors declare no competing interests.

Figures

Fig. 1.
Fig. 1.. S. lacustris cell types from whole-body single-cell RNA sequencing.
(A) Animal phylogeny. anc., ancestor. (B) S. lacustris overhead view. Scale bar, 300 mm. Ca, excurrent canals; G, gemmule; Os, osculum; T, epithelial tent. (C) tSNE plot of 10,106 cells colored by 42 clusters. (D) PAGA connectivity plot showing connection strength (edge thickness) and log number of cells in cluster (node diameter). (E) Scaled expression values of differentially expressed markers for PAGA paths. Apendopinac., apendopinacocyte; Inc. Pinac., incurrent pinacocyte.
Fig. 2.
Fig. 2.. Spongilla cell type families and single-cell SAMap alignment to Amphimedon.
(A) Spongilla cell type tree with bootstrap support. (B) Sankey plot mapping S. lacustris to adult A. queenslandica cell types. Amb, amoebocytes; Apo, apopylar cells; Arc, archaeocytes; basPin, basopinacocytes; Cho, choanocytes; Grl, granulocytes; incPin, incurrent pinacocytes; Lph, lophocytes; Mes1, mesocytes 1; Mes2, mesocytes 2; Met, metabolocytes; Myp, myopeptidocytes; Nrd, neuroid cells; Scl, sclerocytes; Scp, sclerophorocytes.
Fig. 3.
Fig. 3.. Endymocyte cell type family.
(A) Illustration of juvenile S. lacustris. Red boxes outline locations illustrated in other figure panels. (B) Drawing of incurrent pinacocytes (incPin) that make up the tent and vestibule, with adjacent mesenchymal cells: lophocytes (Lph), metabolocytes (Met), archaeocytes (Arc), mesocytes 1 (Mes1), and mesocytes 2 (Mes2). (C) Illustration of spicule production (sclerocytes, Scl), transport (sclerophorocytes, Scp), and anchoring (basopinacocytes, basPin). (D) smFISH of endymocyte markers. incPin, Tpm; apnPin, Tetraspanin; lph, c100322_g1; met, Reelin B; basPin, Spongin; Scp, c101435_g1. Membrane stains Fm-143Fx (red) and CellBrite Fix (green; also possibly stains collagen); nuclei 4′,6-diamidino-2-phenylindole (DAPI) stain (cyan). Scale bar, 30 μm.
Fig. 4.
Fig. 4.. Peptidocyte and amoeboid-neuroid cell type families.
(A) SEM of choanocyte chamber. Scale bar, 10 mm. (B to F) smFISH of neuroid and amoeboid markers: choanocytes (Cho), villin-like; apopylar cells (Apo), c101118_g1; myopeptidocytes (Myp), c88171_g1; neuroid cells (Nrd), Peroxidase A; granulocytes (Grl), Acp5; and amoebocytes (Amb), c103466_g1. Dashed line indicates epithelial tent. Dotted line outlines archaeocyte being engulfed by amoebocyte. Membrane stains Fm-143Fx (red) and CellBrite Fix (green); nuclei DAPI stain (cyan). Scale bars, 30 μm. EC, excurrent canal. (G) Illustration of choanocyte chamber and neighboring mesenchymal cells.
Fig. 5.
Fig. 5.. Expression of “pre-” and “postsynaptic” genes.
Dot plot showing expression of manually curated synaptic GO terms. Archae., Archaeocytes; rel., relatives.
Fig. 6.
Fig. 6.. FIB-SEM of neuroid-choanocyte interactions.
(A) Rendered three-dimensional volume of choanocyte chamber with neuroid cell (violet). (B) Segmented volume showing two neuroid cells (violet and red) contacting cilia and microvillar collars of three choanocytes (blue, turquoise, and green) and apopylar cells (yellow). (C) Segmented neuroid cell (violet) with filopodia extending into the microvillar collar (turquoise). (D) High-resolution FIB-SEM section of neuroid cell 1 with secretory vesicles (cyan overlay). (E) High-resolution FIB-SEM section of neuroid cell 1 forming pocket around tip of choanocyte cilia (yellow overlay).

Comment in

References

    1. Srivastava M et al., Nature 466, 720–726 (2010). - PMC - PubMed
    1. Elliott GRD, Leys SP, J. Exp. Biol 210, 3736–3748 (2007). - PubMed
    1. Alié A et al., Proc. Natl. Acad. Sci. U.S.A 112, E7093–E7100 (2015). - PMC - PubMed
    1. Wolf FA et al., Genome Biol. 20, 59–9 (2019). - PMC - PubMed
    1. Peña JF et al., Evodevo 7, 13 (2016). - PMC - PubMed

Publication types