

The dose-response relationship between socioeconomic deprivation and alcohol-attributable mortality risk-a systematic review and meta-analysis
- PMID: 34736475
- PMCID: PMC8569998
- DOI: 10.1186/s12916-021-02132-z
The dose-response relationship between socioeconomic deprivation and alcohol-attributable mortality risk-a systematic review and meta-analysis
Abstract
Background: Individuals with low socioeconomic status (SES) experience a higher risk of mortality, in general, and alcohol-attributable mortality in particular. However, a knowledge gap exists concerning the dose-response relationships between the level of socioeconomic deprivation and the alcohol-attributable mortality risk.
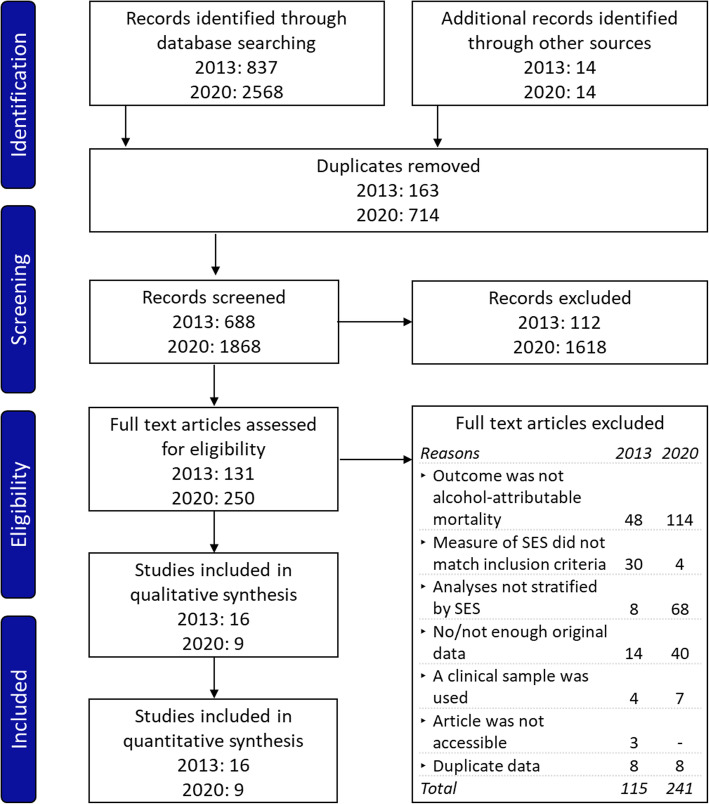
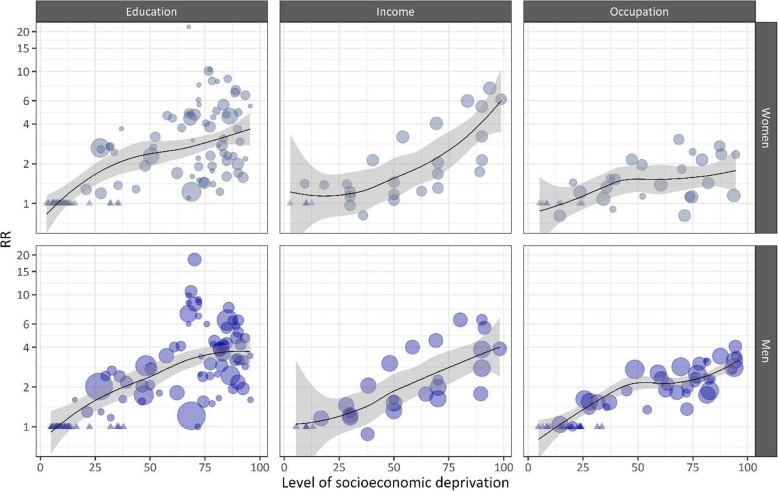
Methods: We conducted a systematic literature search in August of 2020 to update a previous systematic review that included studies published up until February of 2013. Quantitative studies reporting on socioeconomic inequality in alcohol-attributable mortality among the general adult population were included. We used random-effects dose-response meta-analyses to investigate the relationship between the level of socioeconomic deprivation and the relative alcohol-attributable risk (RR), by sex and indicator of SES (education, income, and occupation).
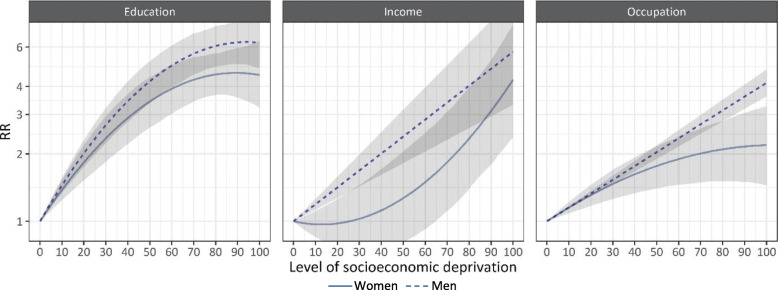
Results: We identified 25 eligible studies, comprising about 241 million women and 230 million men, among whom there were about 75,200 and 308,400 alcohol-attributable deaths, respectively. A dose-response relationship between the level of socioeconomic deprivation and the RR was found for all indicators of SES. The sharpest and non-linear increase in the RR of dying from an alcohol-attributable cause of death with increasing levels of socioeconomic deprivation was observed for education, where, compared to the most educated individuals, individuals at percentiles with decreasing education had the following RR of dying: women: 25th: 2.09 [95% CI 1.70-2.59], 50th: 3.43 [2.67-4.49], 75th: 4.43 [3.62-5.50], 100th: 4.50 [3.26-6.40]; men: 25th: 2.34 [1.98-2.76], 50th: 4.22 [3.38-5.24], 75th: 5.87 [4.75-7.10], 100th: 6.28 [4.89-8.07].
Conclusions: The findings of this study show that individuals along the entire continuum of SES are exposed to increased alcohol-attributable mortality risk. Differences in the dose-response relationship can guide priorities in targeting public health initiatives.
Keywords: Alcohol use; Dose-response; Inequality; Mortality; Public health; Socioeconomic deprivation; Socioeconomic status.
© 2021. The Author(s).
Conflict of interest statement
The authors declare that they have no competing interests.
Figures
References
-
- Strand BH, Grøholt EK, Steingrímsdóttir OA, Blakely T, Graff-Iversen S, Næss Ø. Educational inequalities in mortality over four decades in Norway: prospective study of middle aged men and women followed for cause specific mortality, 1960-2000. BMJ. 2010;340(c654):c654. doi: 10.1136/bmj.c654. - DOI - PMC - PubMed
-
- Mackenbach JP, Valverde JR, Bopp M, Bronnum-Hansen H, Deboosere P, Kalediene R, Kovacs K, Leinsalu M, Martikainen P, Menvielle G, et al. Determinants of inequalities in life expectancy: an international comparative study of eight risk factors. Lancet Public Health. 2019;4(10):e529–e537. doi: 10.1016/S2468-2667(19)30147-1. - DOI - PubMed
-
- Stringhini S, Carmeli C, Jokela M, Avendaño M, Muennig P, Guida F, Ricceri F, d'Errico A, Barros H, Bochud M, Chadeau-Hyam M, Clavel-Chapelon F, Costa G, Delpierre C, Fraga S, Goldberg M, Giles GG, Krogh V, Kelly-Irving M, Layte R, Lasserre AM, Marmot MG, Preisig M, Shipley MJ, Vollenweider P, Zins M, Kawachi I, Steptoe A, Mackenbach JP, Vineis P, Kivimäki M, Alenius H, Avendano M, Barros H, Bochud M, Carmeli C, Carra L, Castagné R, Chadeau-Hyam M, Clavel-Chapelon F, Costa G, Courtin E, Delpierre C, D'Errico A, Dugué PA, Elliott P, Fraga S, Gares V, Giles G, Goldberg M, Greco D, Hodge A, Irving MK, Karisola P, Kivimäki M, Krogh V, Lang T, Layte R, Lepage B, Mackenbach J, Marmot M, McCrory C, Milne R, Muennig P, Nusselder W, Panico S, Petrovic D, Polidoro S, Preisig M, Raitakari O, Ribeiro AI, Ribeiro AI, Ricceri F, Robinson O, Valverde JR, Sacerdote C, Satolli R, Severi G, Shipley MJ, Stringhini S, Tumino R, Vineis P, Vollenweider P, Zins M. Socioeconomic status and the 25 × 25 risk factors as determinants of premature mortality: A multicohort study and meta-analysis of 1.7 million men and women. Lancet. 2017;389(10075):1229–1237. doi: 10.1016/S0140-6736(16)32380-7. - DOI - PMC - PubMed
Publication types
MeSH terms
Grants and funding
LinkOut - more resources
Full Text Sources
Medical
Miscellaneous
