. 2021 Dec:213:108809.
doi: 10.1016/j.exer.2021.108809. Epub 2021 Nov 1.

Interplay between intraocular and intracranial pressure effects on the optic nerve head in vivo

Affiliations

Interplay between intraocular and intracranial pressure effects on the optic nerve head in vivo

Ziyi Zhu et al. Exp Eye Res. 2021 Dec.

Abstract

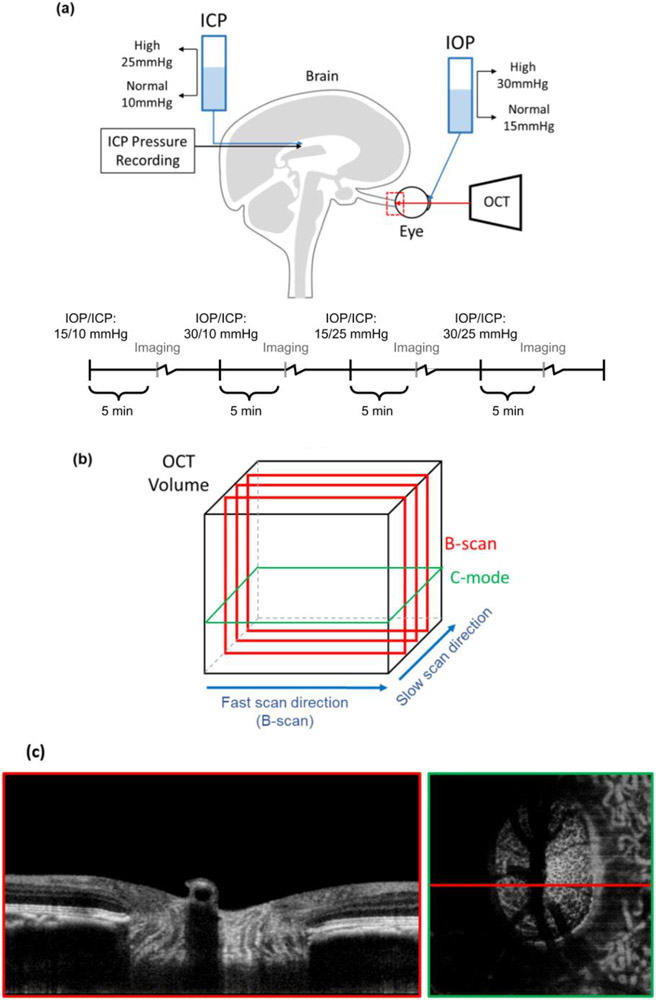
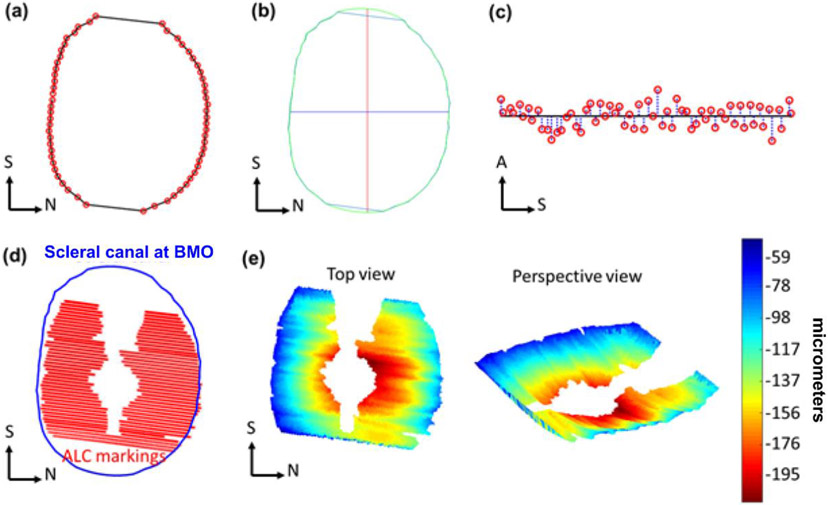
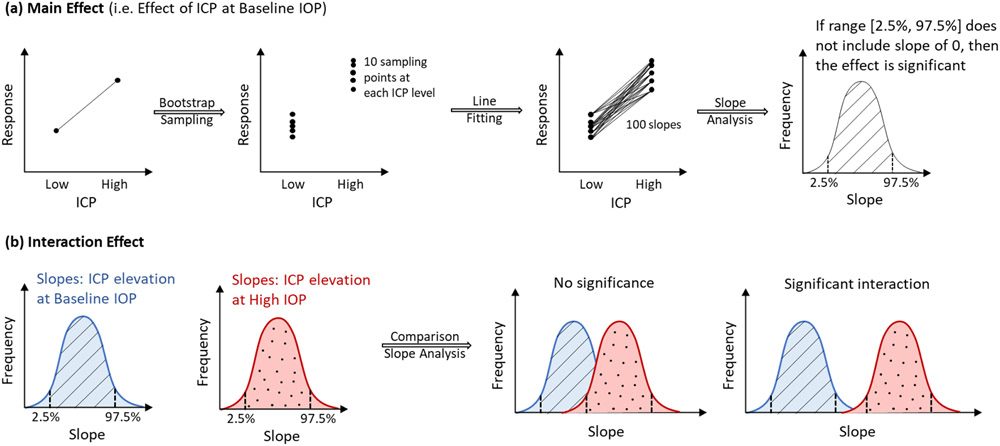
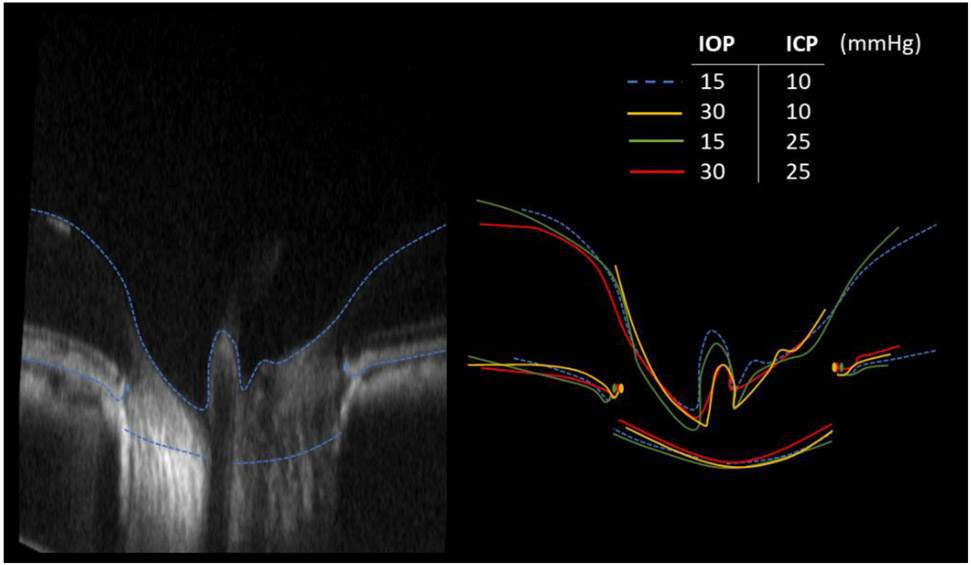
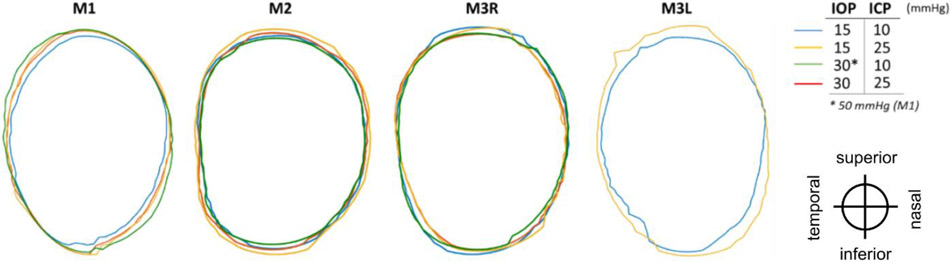
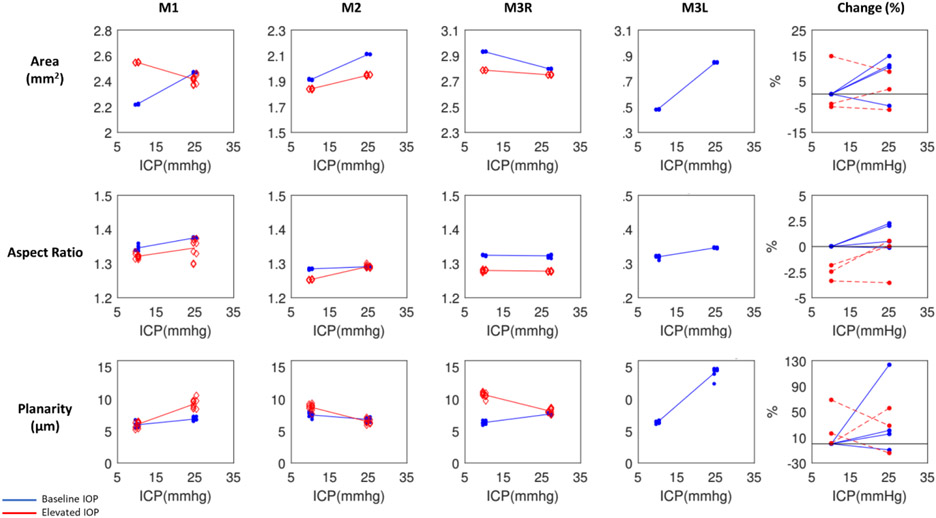
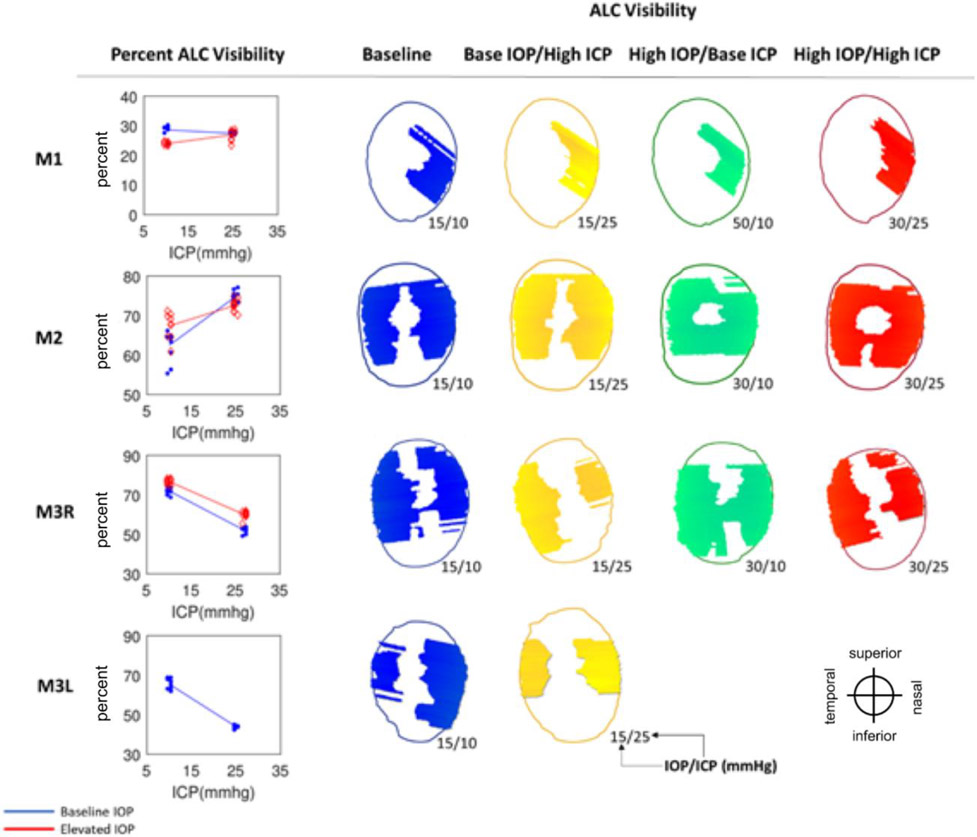
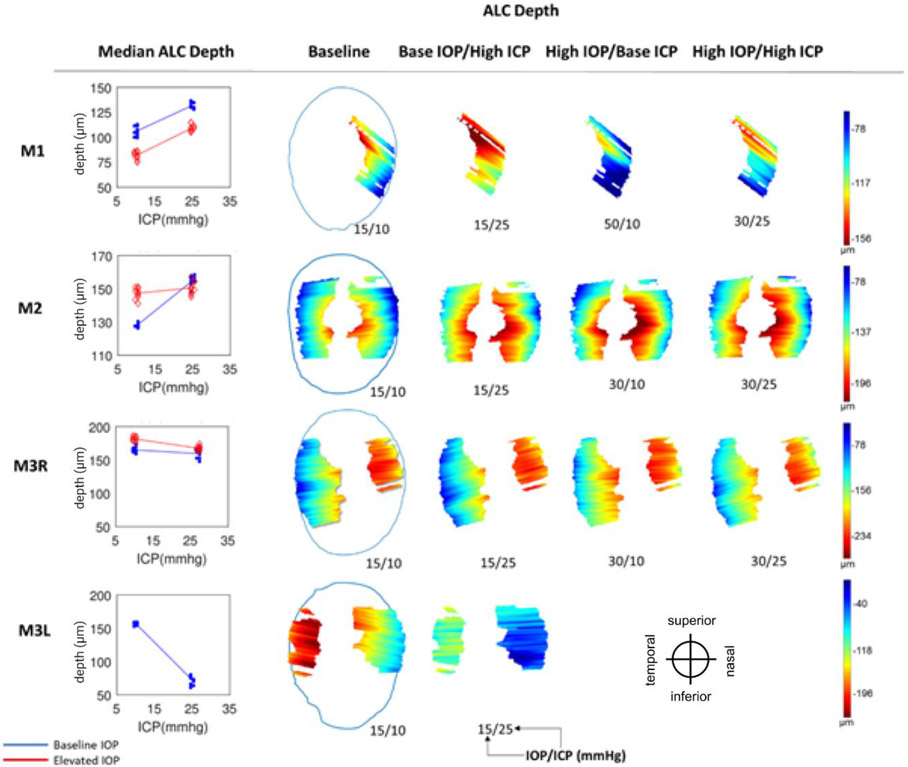
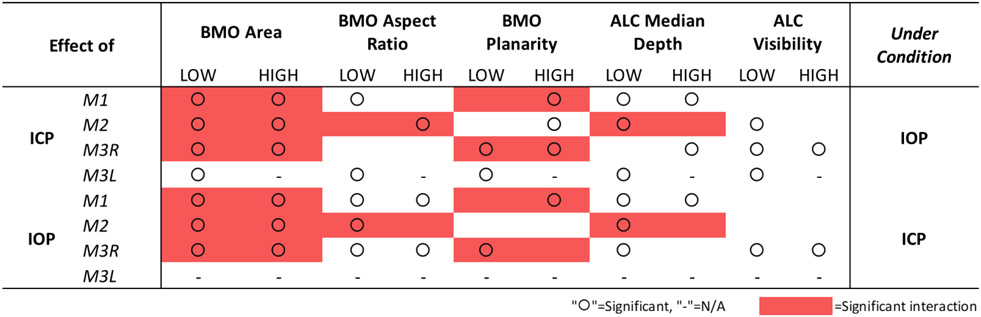
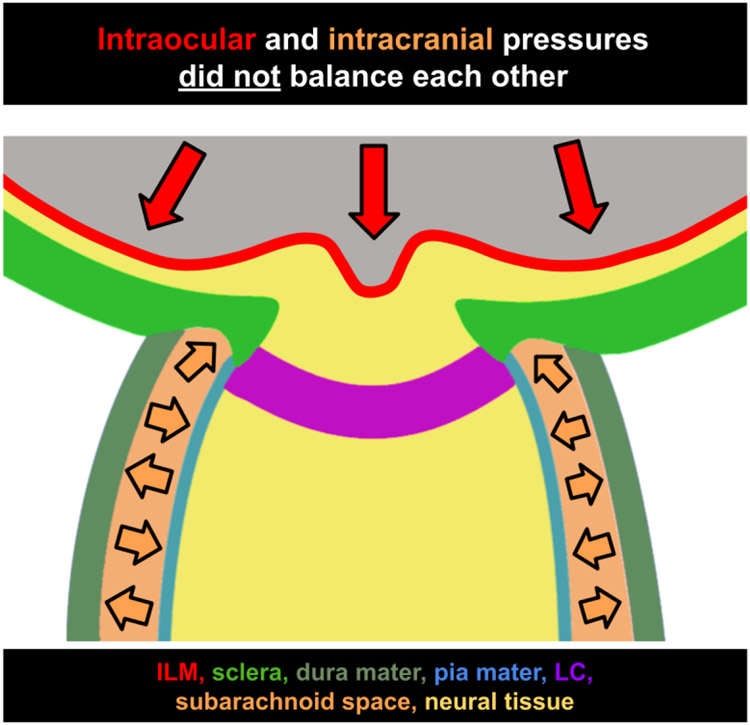
Intracranial pressure (ICP) has been proposed to play an important role in the sensitivity to intraocular pressure (IOP) and susceptibility to glaucoma. However, the in vivo effects of simultaneous, controlled, acute variations in ICP and IOP have not been directly measured. We quantified the deformations of the anterior lamina cribrosa (ALC) and scleral canal at Bruch's membrane opening (BMO) under acute elevation of IOP and/or ICP. Four eyes of three adult monkeys were imaged in vivo with OCT under four pressure conditions: IOP and ICP either at baseline or elevated. The BMO and ALC were reconstructed from manual delineations. From these, we determined canal area at the BMO (BMO area), BMO aspect ratio and planarity, and ALC median depth relative to the BMO plane. To better account for the pressure effects on the imaging, we also measured ALC visibility as a percent of the BMO area. Further, ALC depths were analyzed only in regions where the ALC was visible in all pressure conditions. Bootstrap sampling was used to obtain mean estimates and confidence intervals, which were then used to test for significant effects of IOP and ICP, independently and in interaction. Response to pressure manipulation was highly individualized between eyes, with significant changes detected in a majority of the parameters. Significant interactions between ICP and IOP occurred in all measures, except ALC visibility. On average, ICP elevation expanded BMO area by 0.17 mm2 at baseline IOP, and contracted BMO area by 0.02 mm2 at high IOP. ICP elevation decreased ALC depth by 10 μm at baseline IOP, but increased depth by 7 μm at high IOP. ALC visibility decreased as ICP increased, both at baseline (-10%) and high IOP (-17%). IOP elevation expanded BMO area by 0.04 mm2 at baseline ICP, and contracted BMO area by 0.09 mm2 at high ICP. On average, IOP elevation caused the ALC to displace 3.3 μm anteriorly at baseline ICP, and 22 μm posteriorly at high ICP. ALC visibility improved as IOP increased, both at baseline (5%) and high ICP (8%). In summary, changing IOP or ICP significantly deformed both the scleral canal and the lamina of the monkey ONH, regardless of the other pressure level. There were significant interactions between the effects of IOP and those of ICP on LC depth, BMO area, aspect ratio and planarity. On most eyes, elevating both pressures by the same amount did not cancel out the effects. Altogether our results show that ICP affects sensitivity to IOP, and thus that it can potentially also affect susceptibility to glaucoma.

Keywords: Biomechanics; Glaucoma; Intracranial pressure; Intraocular pressure; Lamina cribrosa; OCT; Optic nerve head; Translaminar pressure.


Figures

Figure 1:
Figure 1:
(a) Diagram of in vivo experimental set up and timeline, in which both intraocular and intracranial pressures were controlled via gravity perfusion while the optic nerve head region (red) was imaged with optical coherence tomography. This study focuses on analysis of the four IOP/ICP conditions highlighted. The experimental protocol included other IOP/ICP conditions between the ones highlighted. See the main text for details. Motion artifacts in the slow scan direction were removed (b). Example B-scan and C-mode views at the lamina cribrosa level acquired with an IOP of 15 mmHg and ICP of 8 mmHg (c).
Figure 2:
Figure 2:
Example markings of Bruch’s membrane opening, (BMO, red) (a). Example scleral canal area (within green perimeter), interpolated from BMO markings, and its corresponding principal axes (red, blue) (b). Scleral canal planarity was calculated as the average of distances (blue) from BMO markings (red) to BMO best-fit plane (black) (c). Example scleral canal (blue) and anterior lamina cribrosa (ALC) markings (red) used to reconstruct ALC surface and compute ALC depth (d). Heat maps of ALC depth (shallow to deep: blue to red) (e). S: Superior, N: Nasal, A: Anterior.
Figure 3:
Figure 3:
Diagram of statistical tests for the main effects of IOP, ICP (a) and the interaction of their effects (b). (a) Main effect: Bootstrap sampling was used to generate 20 sampling points, 10 sampling points at each of 2 ICP levels. Fitting lines through these points, 100 slopes and their 95% range (between 2.5% and 97.5%), were computed. A significant main effect was detected if the range did not include a slope of 0. (b) Interaction effect: From left to right: Similar procedure in (a) is performed to generate slopes and their two corresponding ranges due to ICP elevation at baseline and at high IOP. A significant interaction between ICP effects and IOP effects was detected if these two ranges did overlap.
Figure 4:
Figure 4:
Example qualitative comparison of effects of IOP and ICP. (Left) Baseline B-scan and markings. (Right) Overlay markings from all pressure conditions on baseline B-scan to demonstrate deformations of ONH structures. For this study we analyzed the scleral canal at BMO and the anterior boundary of the LC. In this image we also show delineations of the BM and the inner limiting membrane (including over the central retinal vessels). The dashed lines are delineations at the baseline IOP and ICP levels. Note that to simplify discerning the differences, the B-scan and outlines are shown exaggerated 3 times in axial direction, as is the common for presenting OCT.
Figure 5:
Figure 5:
Outlines of the scleral canal at the Bruch’s membrane openings, for each eye at 4 pressure conditions: baseline (blue), base IOP/high ICP (yellow), high IOP/base ICP (green), and high IOP/high ICP (red). Outlines were registered rigidly by the centroid and principal axes. Images of M3L at elevated IOP had poor LC visibility and were therefore excluded from analysis. Orientation of eyes as displayed is indicated at the lower right-hand side.
Figure 6:
Figure 6:
Scleral canal displacements due to variations in intraocular (IOP) and intracranial (ICP) pressures. Percentage changes of BMO area, aspect ratio, and planarity with respect to baseline values due to ICP elevation at baseline IOP (blue) and elevated IOP (red). Each line represents the regression of the estimates, or average of 10 bootstrap sampling points, at each ICP. To reduce overlap, the symbols were scattered laterally slightly.
Figure 7:
Figure 7:
Anterior lamina cribrosa (ALC) visibility. (Left) Percentage of ALC visibility at baseline IOP (blue) and elevated IOP (red). Each line represents the regression of the estimates, or average of 10 bootstrap sampling points, at each ICP. (Right) Maps of ALC visibility. Shown are canal outline (thin line) and ALC for 4 pressure conditions: baseline (blue), baseline IOP/high ICP (yellow), high IOP/baseline ICP (green), and high IOP/high ICP (red). Pressures for each condition are indicated as IOP/ICP.
Figure 8:
Figure 8:
Anterior lamina cribrosa (ALC) depth. (Left) Median ALC depth at baseline IOP (blue) and elevated IOP (red). Each line represents the regression of the estimates, or average of 10 bootstrap sampling points, at each ICP. (Right) Heat maps of ALC depth (blue to red: shallower to deeper) with respect to scleral canal (blue outline), shown only on regions visible across all 4 pressure conditions within an eye. Pressures for each condition are indicated as IOP/ICP.
Figure 9:
Figure 9:
Summary of statistical results showing the significance of IOP and ICP independent effects (“O”) as well as the significance of their interaction effects (red box) on ONH structures. Scleral canal measurements taken at BMO.
Figure 10:
Figure 10:
Intraocular and intracranial pressures do not balance each other. Diagram of the ONH with representations of the inner limiting membrane (ILM, red), sclera (green), dura mater (gray-green), pia mater (blue), lamina cribrosa (LC, purple), subarachnoid space (orange), and neural tissue (yellow). Direction of force placed by intraocular pressure (red arrows) and intracranial pressure (orange arrows.)

References

    1. Quigley HA. Number of people with glaucoma worldwide. Br J Ophthalmol. 1996;80(5):389–393. - PMC - PubMed
    1. Quigley HA, Broman AT. The number of people with glaucoma worldwide in 2010 and 2020. Br J Ophthalmol. 2006;90(3):262–267. - PMC - PubMed
    1. Furlanetto RL, Park SC, Damle UJ, et al. Posterior displacement of the lamina cribrosa in glaucoma: in vivo interindividual and intereye comparisons. Invest Ophthalmol Vis Sci. 2013;54(7):4836–4842. - PubMed
    1. Quigley HA, Sanchez RM, Dunkelberger GR, L’Hernault NL, Baginski TA. Chronic glaucoma selectively damages large optic nerve fibers. Invest Ophthalmol Vis Sci. 1987;28(6):913–920. - PubMed
    1. Quigley HA, Addicks EM. Regional Differences in the Structure of the Lamina Cribrosa and Their Relation to Glaucomatous Optic Nerve Damage. Archives of Ophthalmology. 1981;99(1):137–143. doi:10.1001/archopht.1981.03930010139020 - DOI - PubMed

Publication types

MeSH terms