Clinical Trial
. 2021 Dec:54:101367.
doi: 10.1016/j.molmet.2021.101367. Epub 2021 Nov 1.

Serum integrative omics reveals the landscape of human diabetic kidney disease

Affiliations
Clinical Trial

Serum integrative omics reveals the landscape of human diabetic kidney disease

Shijia Liu et al. Mol Metab. 2021 Dec.

Abstract

Objective: Diabetic kidney disease (DKD) is the most common microvascular complication of type 2 diabetes mellitus (2-DM). Currently, urine and kidney biopsy specimens are the major clinical resources for DKD diagnosis. Our study proposes to evaluate the diagnostic value of blood in monitoring the onset of DKD and distinguishing its status in the clinic.

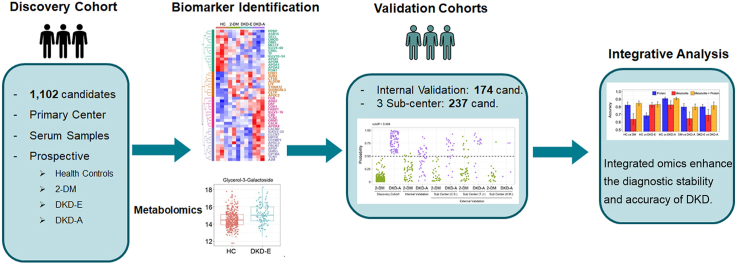
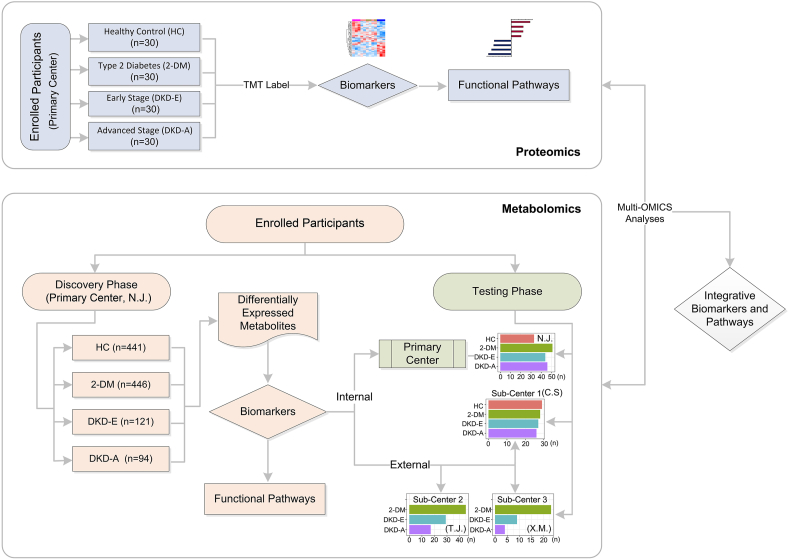
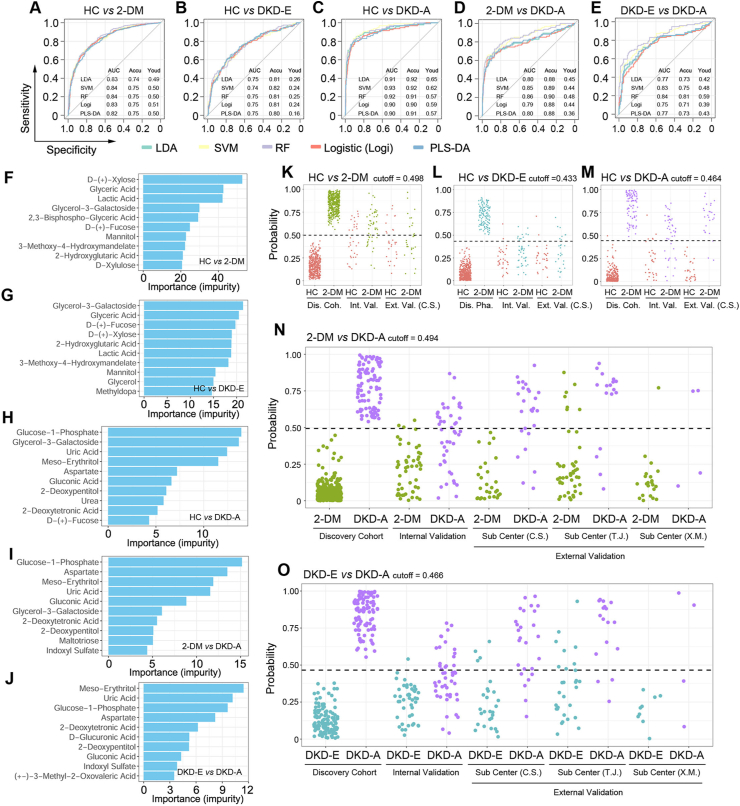
Methods: This study recruited 1,513 participants including healthy adults and patients diagnosed with 2-DM, early-stage DKD (DKD-E), and advanced-stage DKD (DKD-A) from 4 independent medical centers. One discovery and four testing cohorts were established. Sera were collected and subjected to training proteomics and large-scale metabolomics.

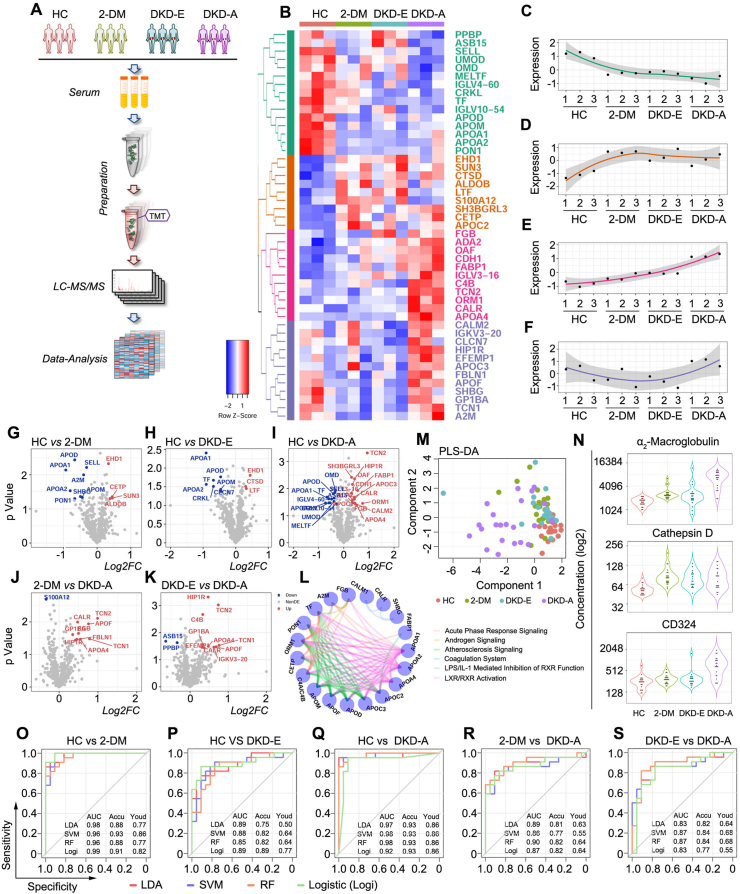
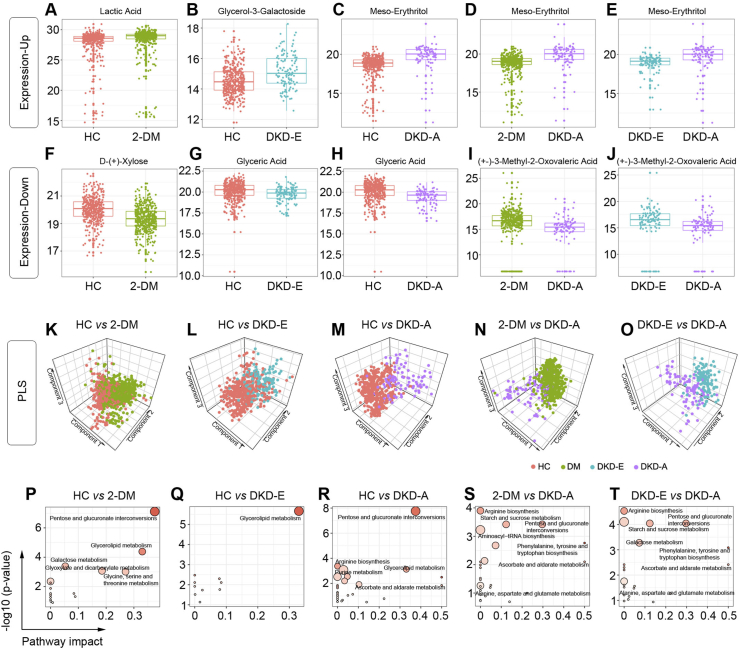
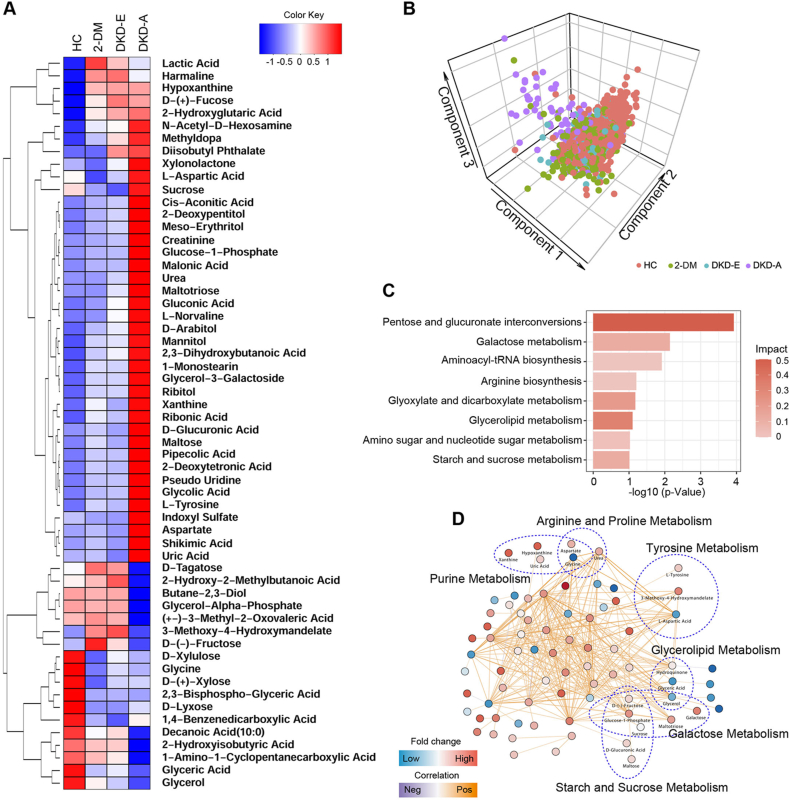
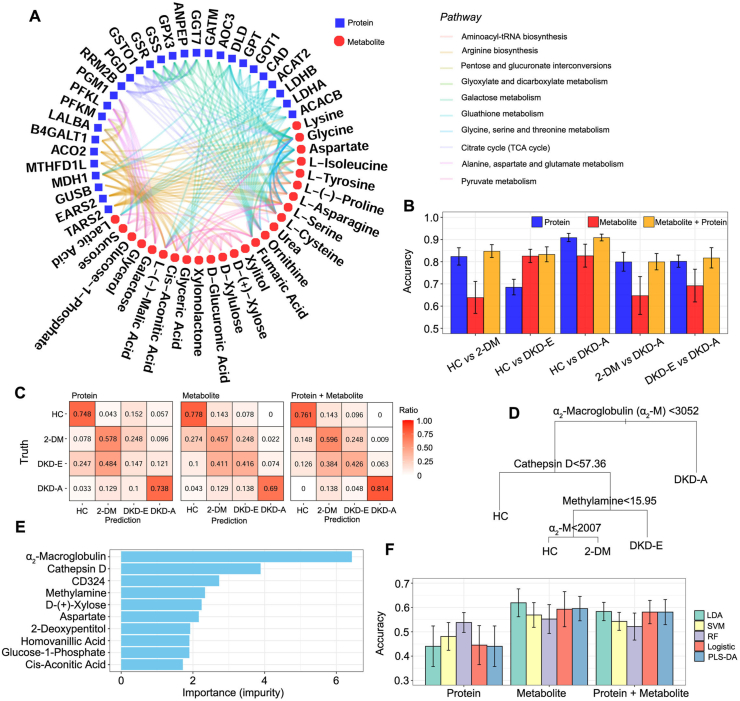
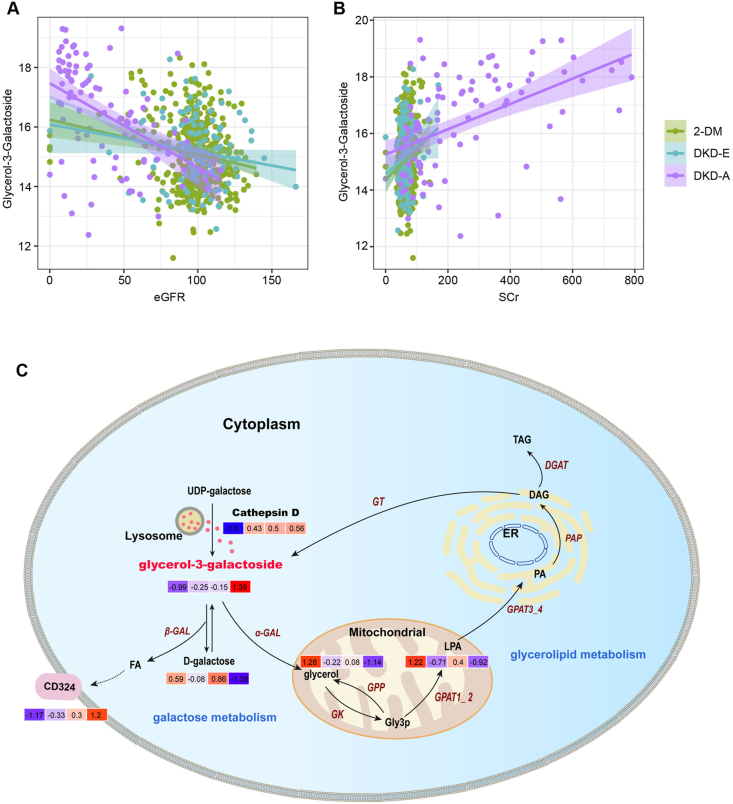
Results: Deep profiling of serum proteomes and metabolomes revealed several insights. First, the training proteomics revealed that the combination of α2-macroglobulin, cathepsin D, and CD324 could serve as a surrogate protein biomarker for monitoring DKD progression. Second, metabolomics demonstrated that galactose metabolism and glycerolipid metabolism are the major disturbed metabolic pathways in DKD, and serum metabolite glycerol-3-galactoside could be used as an independent marker to predict DKD. Third, integrating proteomics and metabolomics increased the diagnostic and predictive stability and accuracy for distinguishing DKD status.

Conclusions: Serum integrative omics provide stable and accurate biomarkers for early warning and diagnosis of DKD. Our study provides a rich and open-access data resource for optimizing DKD management.

Keywords: Diabetic kidney disease; Machine learning; Metabolomics; Proteomics; Serum; Type 2 diabetes mellitus.


Figures

Image 1
Graphical abstract
Figure 1
Figure 1
Summary of the study design and cohort details. This clinical study recruited 1,513 participants from four independent medical centers, which includes 503 HC, 593 2-DM, 230 DKD-E, and 187 DKD-A patients in one discovery and four testing cohorts. Sera were collected and subjected to training proteomics and large-scale metabolomics. HC: healthy control; 2-DM: type 2 diabetes mellitus; DKD-E: early-stage diabetic kidney disease; DKD-A: advanced-stage diabetic kidney disease.
Figure 2
Figure 2
Proteomics deciphered the status of DKD. (A) Working pipeline for proteomics data collection from the participants. (B) Heatmap for biomarker detection from the proteomics data. Each row represents a protein marker, and each column represents a loading sample across the four groups, including HC, 2-DM, DKD-E, and DKD-A. Protein markers are grouped into four clusters via hierarchical clustering. (C–F) Protein expression corresponding to the four clusters shown in Figure 1B. The four clusters showed out-down, up-flat, up, and down-up patterns, respectively. (G–K) Volcano plots of the proteomics data for each pairwise comparison. The x-axis is log2 fold-change and the y-axis represents the minus log10 p-value. Overexpressed and underexpressed proteins are marked with red and blue colors, respectively. (L) Network plot illustrating the enriched pathways detected by the differentially expressed proteins. Each node represents a protein, and the proteins are connected by their involved pathways. (M) Partial least squares discriminant analysis based on the ELISA markers. (N) Violin plots illustrate the concentration of α2-macroglobulin, cathepsin D, and CD324 in each group by ELISA. (O–S) Receiver operating characteristic (ROC) curves for each pairwise prediction by four different machine learning methods. Redline for linear discriminant analysis (LDA), blue line for support vector machine (SVM), orange line for random forest (RF), and green line for logistic regression (Logi). AUC: the area under the curve; Accu: accuracy; Youd: Youden index.
Figure 3
Figure 3
Detection of differentially expressed metabolites by pairwise comparison of DKD status. (A–E) Representative box plots for top upregulated metabolites. (FJ) Representative box plots for the top downregulated metabolites. (K–O) Partial least squares discriminant analysis based on the differentially expressed metabolites. (P–T) Top significant functional pathways involved according to the differentially expressed metabolites.
Figure 4
Figure 4
Metabolite biomarker identification of DKD. (A) Hierarchical clustering of differentially expressed metabolites. The median expression levels of metabolites for each group are presented in the heatmap. (B) Partial least squares discriminant analysis of the four groups. (C) Top significant pathways detected by the differentially expressed metabolites. (D) Network analysis based on the differentially expressed metabolites. Each node represents a metabolite, and the edges indicate the correlations between the metabolites. The metabolites highlighted are further grouped into metabolism pathways.
Figure 5
Figure 5
Prediction of the DKD status via machine learning algorithms of the metabolomics data. (A–E) Receiver operating characteristic (ROC) curves for each pairwise prediction by five different machine learning methods. (F–J) Top prediction features selected by random forest impurity measurements. (K–O) Prediction probabilities based on the random forest algorithm. The best cutoff was trained from the discovery cohort and applied to testing cohorts for prediction. Dis. Coh. = Discovery Cohort; Int. Val. = Internal Validation; Ext. Val. = External Validation.
Figure 6
Figure 6
Integrative analysis of proteomics and metabolomics data. (A) Significant pathways detected by the differentially expressed proteins and metabolites. Proteins and metabolites are presented in blue and red nodes, respectively. Proteins or metabolites that are involved in the same pathways are connected by the edges with the corresponding colors for each pathway. (B) Pairwise prediction accuracy based on protein features only (blue), metabolite features only (red), and integration of protein and metabolite features (orange). (C) Heatmap for the prediction accuracy. The numbers in the heatmap cells represent the ratio of true to predicted cases. (D) Prediction tree trained by the random forest model on all the discovery cohorts when integrating ELISA and metabolite features. (E) Top ELISA and metabolite features ranked by impurity measurements based on the random forest algorithm. (F) Prediction accuracy to distinguish 2-DM and DKD-E based on the five machine learning algorithms when integrating ELISA and metabolomics data.
Figure 7
Figure 7
Glycerol-3-galactoside synthesis is an independent metabolic event amid DKD progression. (A–-B) The correlations between glycerol-3-galactoside and eGFR or serum creatinine (Scr) levels. (C) Schematic diagram depicting the process of glycerol-3-galactoside synthesis and its roles in the onset of DKD. Each color box (left to right) indicates the normalized expression value of the corrsponding metabolite in the HC, 2-DM, DKD-E, and DKD-A groups, respectively.

References

    1. Saeedi P., Petersohn I., Salpea P., Malanda B., Karuranga S., Unwin N., et al. Global and regional diabetes prevalence estimates for 2019 and projections for 2030 and 2045: results from the international diabetes federation diabetes atlas. Diabetes Research and Clinical Practice. 2019;157:107843. 9(th) edition. - PubMed
    1. Fu H., Liu S., Bastacky S.I., Wang X., Tian X.J., Zhou D. Diabetic kidney diseases revisited: a new perspective for a new era. Molecular Metabolism. 2019;30:250–263. - PMC - PubMed
    1. Reidy K., Kang H.M., Hostetter T., Susztak K. Molecular mechanisms of diabetic kidney disease. Journal of Clinical Investigation. 2014;124(6):2333–2340. - PMC - PubMed
    1. Atkins R.C., Zimmet P., Committee I-IWKDS Diabetes: diabetic kidney disease: act now or pay later. Nature Reviews Nephrology. 2010;6(3):134–136. - PubMed
    1. Chen Y., Lee K., Ni Z., He J.C. Diabetic kidney disease: challenges, advances, and opportunities. Kidney Disease. 2020;6(4):215–225. - PMC - PubMed

Publication types