Review
. 2022 Jan;43(1):11-18.
doi: 10.3174/ajnr.A7333. Epub 2021 Nov 4.

Glutamine Imaging: A New Avenue for Glioma Management

Affiliations
Review

Glutamine Imaging: A New Avenue for Glioma Management

S Ekici et al. AJNR Am J Neuroradiol. 2022 Jan.

Abstract

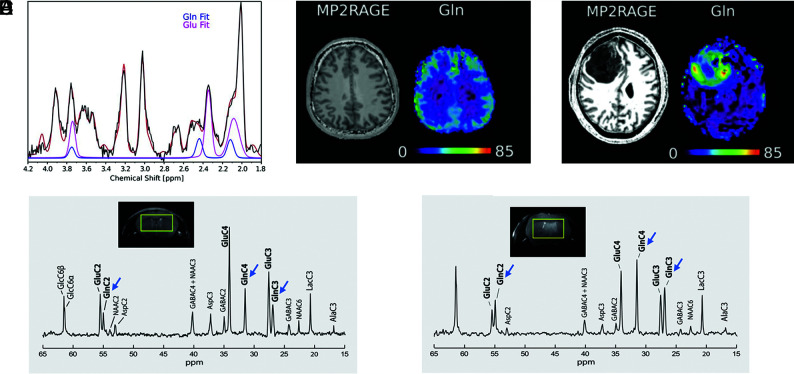
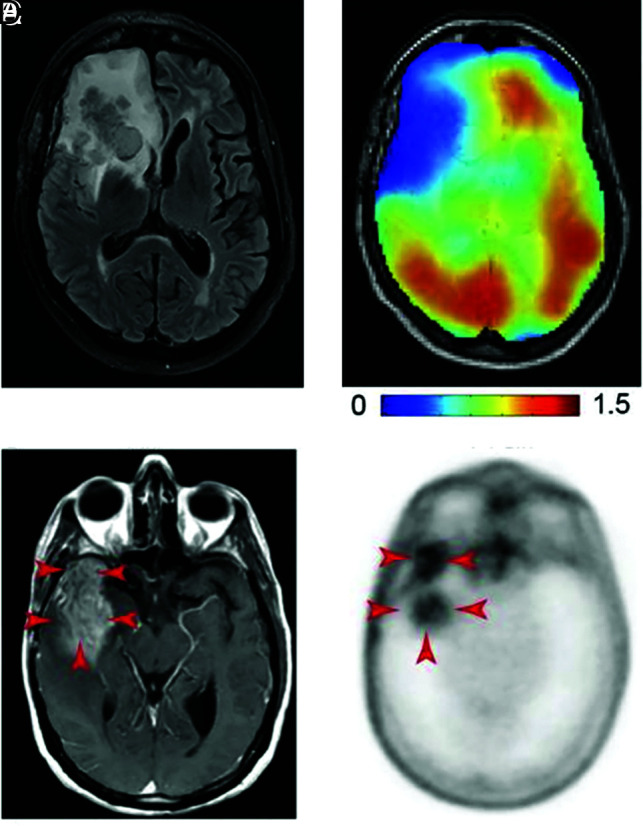
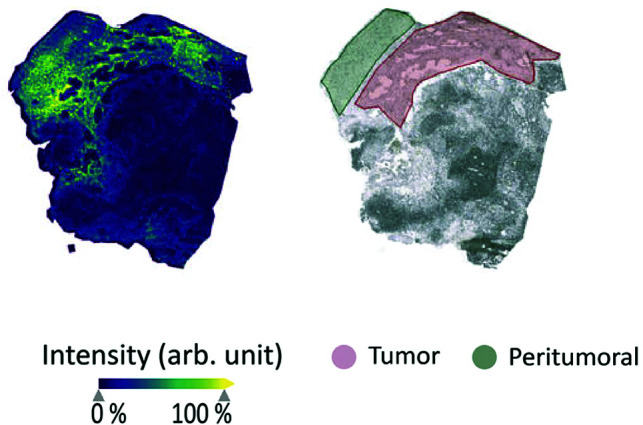
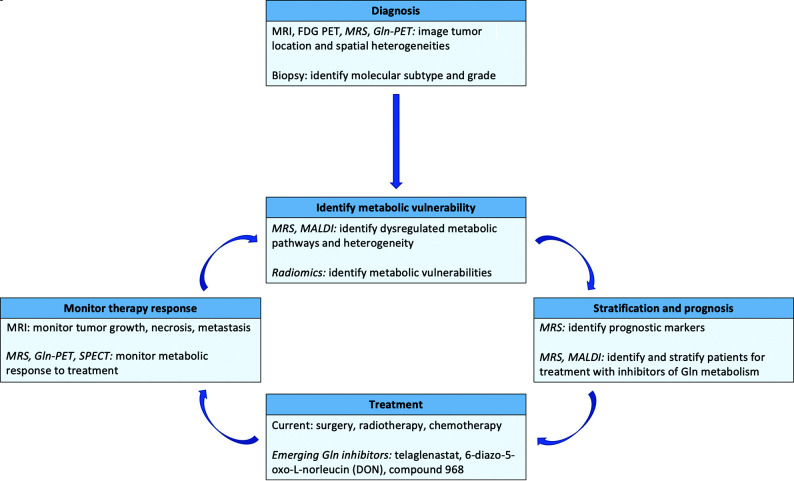
The glutamine pathway is emerging as an important marker of cancer prognosis and a target for new treatments. In gliomas, the most common type of brain tumors, metabolic reprogramming leads to abnormal consumption of glutamine as an energy source, and increased glutamine concentrations are associated with treatment resistance and proliferation. A key challenge in the development of glutamine-based biomarkers and therapies is the limited number of in vivo tools to noninvasively assess local glutamine metabolism and monitor its changes. In this review, we describe the importance of glutamine metabolism in gliomas and review the current landscape of translational and emerging imaging techniques to measure glutamine in the brain. These techniques include MRS, PET, SPECT, and preclinical methods such as fluorescence and mass spectrometry imaging. Finally, we discuss the roadblocks that must be overcome before incorporating glutamine into a personalized approach for glioma management.


Figures

FIG 1.
FIG 1.
1H- and 13C-MR spectra of healthy brain and glioma tissue. A, 1H-MR spectrum acquired at 7T using a 3D MR spectroscopic imaging sequence in a healthy human volunteer. Glutamine and glutamate peak fits are shown in blue and pink, respectively, demonstrating separation at 7T. B, Structural MP2RAGE image and glutamine metabolite map acquired in the same subject as in A. The Color bar shows metabolite concentrations in arbitrary units. C, Structural MP2RAGE image and a glutamine metabolite map acquired in a male patient with glioblastoma (51 years of age). The Color bar shows metabolite concentrations in arbitrary units. Glutamine concentrations are increased in the tumor region, indicated by the dark mass in the MP2RAGE image, relative to the rest of the brain. A–C adapted and reprinted with permission from Hingerl et al. D, 13C-MR spectrum acquired in a healthy mouse brain at 14.1T after 3 hours of infusion with [1,6-13C]-glucose. E, 13C-MR spectrum acquired from a tumor-bearing mouse brain after 3 hours of infusion of [1,6-13C]-glucose. Decreased glutamate peak intensities (carbon [C]2, C3, and C4) and glutamine peak intensities (C2, C3, and C4) are observed compared with healthy brain without tumor (blue arrows). D and E adapted and reprinted with permission from Lai et al. Ala indicates alanine; Asp, aspartate; GABA, γ-aminobutyric acid; Glc, glucose; Gln, glutamine; Glu, glutamate; Lac, lactate; NAA, N-acetylaspartate.
FIG 2.
FIG 2.
DMI and PET images of glutamine metabolism in gliomas. A, T2-weighted FLAIR MR image acquired in a patient with a glioblastoma with a tumor in the right frontal lobe. B, DMI maps of the same section position as in A showing 2H-labeled glutamine + glutamate, with lower concentrations in the tumor region compared with normal-appearing brain tissue. Color bar is in millimolar units. A and B reprinted with permission from DeFeyter et al and used under the CC BY-NC license 4.0. C, T1-weighted MR image with contrast enhancement acquired in a patient with glioblastoma. The tumor region is indicated with red arrows. D, 4-[18F]-FGln PET image acquired in the same patient as in C, with high uptake in the tumor region (red arrows) and minimal background uptake. C and D reprinted from Venneti et al, with permission from AAAS.
FIG 3.
FIG 3.
MSI to image glutamine metabolism. Matrix-assisted laser desorption/ionization TOF MSI of glutamine distribution in an ex vivo human glioma sample (left), with an annotated brightfield image of the same sample showing the tumor and peritumoral regions (right). The MSI map shows increased intensity of glutamine in the tumor regions compared with both peritumoral and nontumoral regions and is a promising emerging method for imaging glutamine. Arb. unit indicates arbitrary unit. Reprinted with permission from Kampa et al and used under the CC BY license 4.0.
FIG 4.
FIG 4.
Framework for using glutamine imaging techniques in glioma management. Imaging methods to quantify and measure local glutamine changes may be useful for diagnosis, identification of metabolic vulnerabilities, patient stratification, and improved treatment monitoring. Methods currently not integrated into clinical workflows are indicated with italics. MALDI indicates matrix-assisted laser desorption/ionization.

References

    1. Reni M, Mazza E, Zanon S, et al. . Central nervous system gliomas. Crit Rev Oncol Hematol 2017;113:213–34 10.1016/j.critrevonc.2017.03.021 - DOI - PubMed
    1. Pavlova NN, Thompson CB. The emerging hallmarks of cancer metabolism. Cell Metab 2016;23:27–47 10.1016/j.cmet.2015.12.006 - DOI - PMC - PubMed
    1. Hensley CT, Wasti AT, DeBerardinis RJ. Glutamine and cancer: cell biology, physiology, and clinical opportunities. J Clin Invest 2013;123:3678–84 10.1172/JCI69600 - DOI - PMC - PubMed
    1. Márquez J, Alonso FJ, Matés JM, et al. . Glutamine addiction in gliomas. Neurochem Res 2017;42:1735–46 10.1007/s11064-017-2212-1 - DOI - PubMed
    1. Vander Heiden MG, DeBerardinis RJ. Understanding the intersections between metabolism and cancer biology. Cell 2017;168:657–69 10.1016/j.cell.2016.12.039 - DOI - PMC - PubMed