. 2022 Mar 1;12(3):712-729.
doi: 10.1158/2159-8290.CD-20-0930.

DIPG Harbors Alterations Targetable by MEK Inhibitors, with Acquired Resistance Mechanisms Overcome by Combinatorial Inhibition

Affiliations

DIPG Harbors Alterations Targetable by MEK Inhibitors, with Acquired Resistance Mechanisms Overcome by Combinatorial Inhibition

Elisa Izquierdo et al. Cancer Discov. .

Abstract

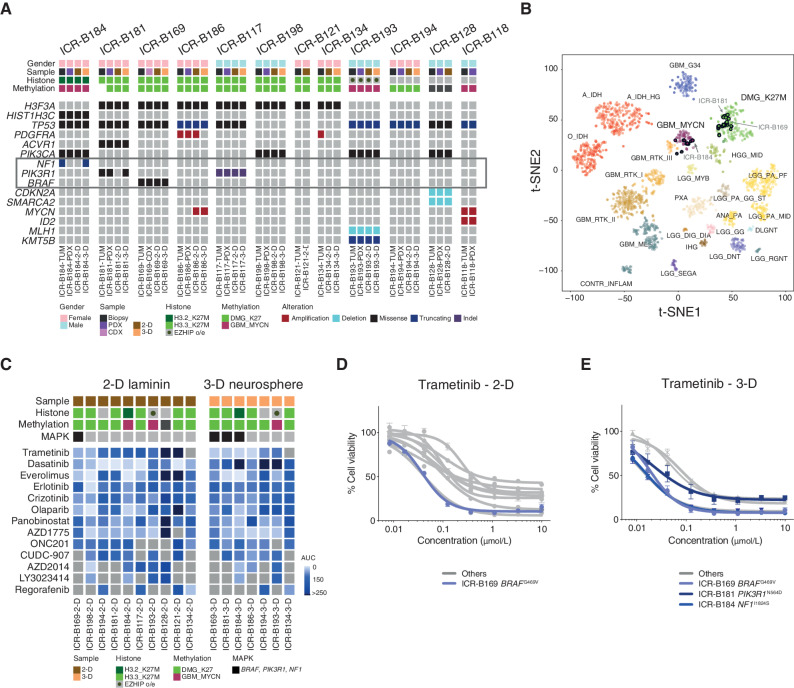
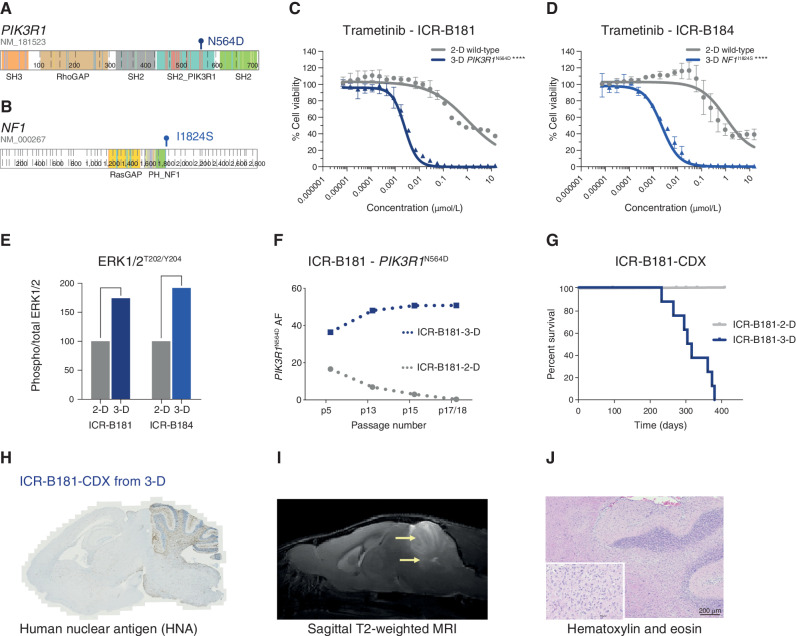
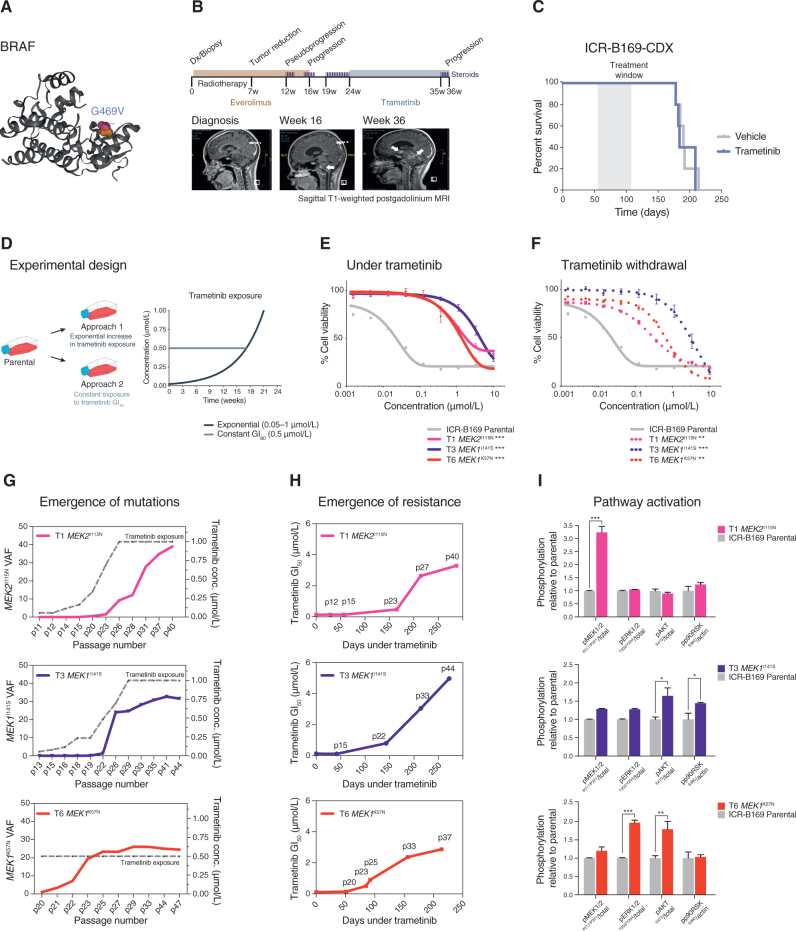
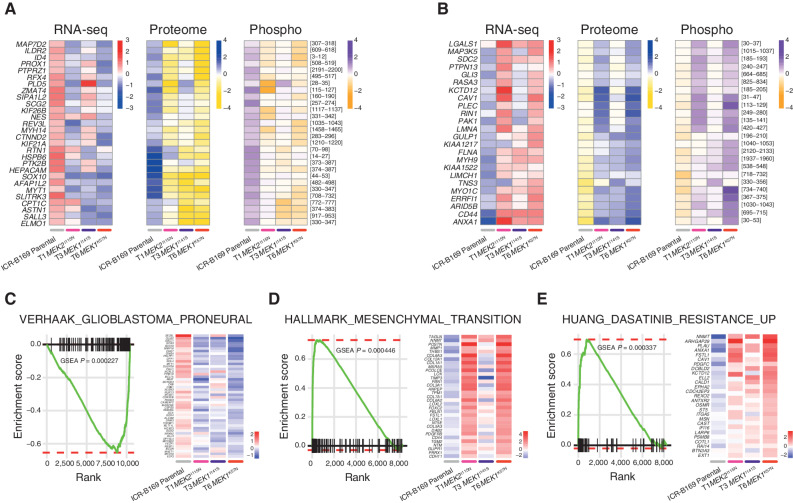
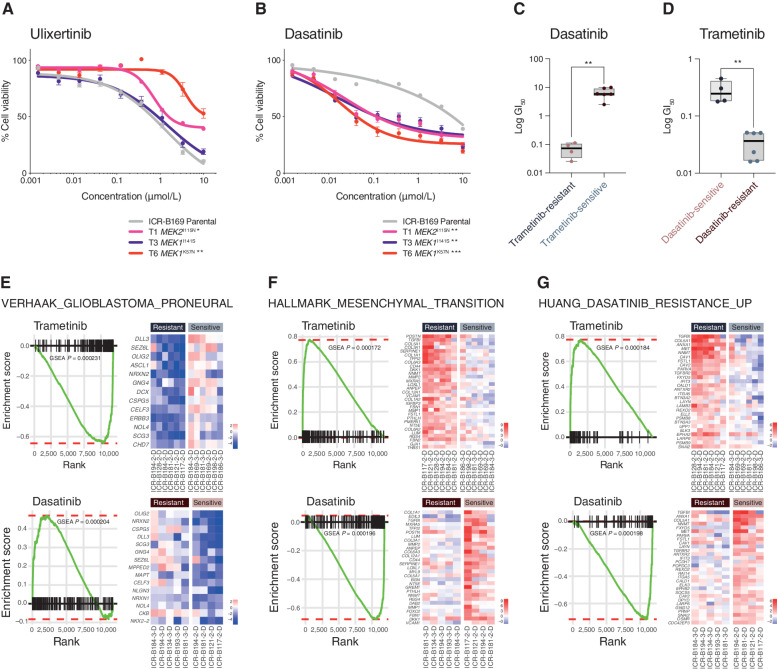
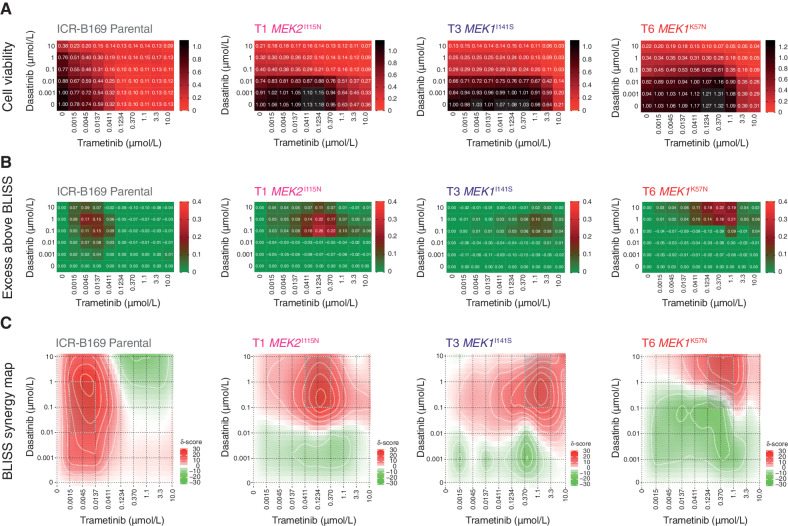
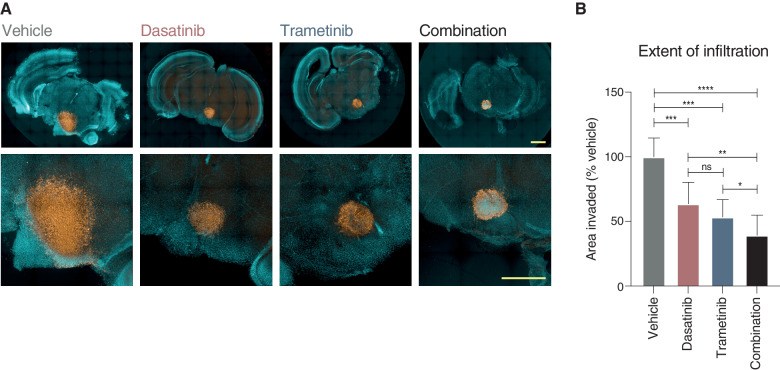
The survival of children with diffuse intrinsic pontine glioma (DIPG) remains dismal, with new treatments desperately needed. In a prospective biopsy-stratified clinical trial, we combined detailed molecular profiling and drug screening in newly established patient-derived models in vitro and in vivo. We identified in vitro sensitivity to MEK inhibitors in DIPGs harboring MAPK pathway alterations, but treatment of patient-derived xenograft models and a patient at relapse failed to elicit a significant response. We generated trametinib-resistant clones in a BRAFG469V model through continuous drug exposure and identified acquired mutations in MEK1/2 with sustained pathway upregulation. These cells showed hallmarks of mesenchymal transition and expression signatures overlapping with inherently trametinib-insensitive patient-derived cells, predicting sensitivity to dasatinib. Combined trametinib and dasatinib showed highly synergistic effects in vitro and on ex vivo brain slices. We highlight the MAPK pathway as a therapeutic target in DIPG and show the importance of parallel resistance modeling and combinatorial treatments for meaningful clinical translation.

Significance: We report alterations in the MAPK pathway in DIPGs to confer initial sensitivity to targeted MEK inhibition. We further identify for the first time the mechanism of resistance to single-agent targeted therapy in these tumors and suggest a novel combinatorial treatment strategy to overcome it in the clinic. This article is highlighted in the In This Issue feature, p. 587.


Figures

Figure 1. In vitro sensitivity to trametinib in patient-derived DIPG models. A, Oncoprint representation of an integrated annotation of single-nucleotide variants, DNA copy number changes, and structural variants for patient-derived models and tumor biopsy specimens. Samples are arranged in columns with genes labeled along rows. Clinicopathologic and molecular annotations are provided as bars according to the included key. B, The t-statistic–based stochastic neighbor embedding (t-SNE) projection of a combined methylation data set comprising the in vitro models (circled) plus a reference set of glioma subtypes (n = 1,766). The first two projections are plotted on the x- and y-axes, with samples represented by dots colored by subtype as labeled on the figure. C, Drug sensitivities in the mini-screens carried out on cells grown under 2-D and 3-D conditions, visualized by heat map of normalized AUC values. Clinicopathologic and molecular annotations are provided as bars according to the included key. D, Dose–response curves for the MEK inhibitor trametinib tested against patient-derived models in vitro grown in 2-D. E, Dose–response curves for the MEK inhibitor trametinib tested against patient-derived models in vitro grown in 3-D. Cells harboring MAPK pathway alterations are highlighted in blue. Concentration of compound is plotted on a log scale (x-axis) against cell viability (y-axis). Means plus standard errors are plotted from at least n = 3 experiments.
Figure 1.
In vitro sensitivity to trametinib in patient-derived DIPG models. A, Oncoprint representation of an integrated annotation of single-nucleotide variants, DNA copy number changes, and structural variants for patient-derived models and tumor biopsy specimens. Samples are arranged in columns with genes labeled along rows. Clinicopathologic and molecular annotations are provided as bars according to the included key. B, The t-statistic–based stochastic neighbor embedding (t-SNE) projection of a combined methylation data set comprising the in vitro models (circled) plus a reference set of glioma subtypes (n = 1,766). The first two projections are plotted on the x- and y-axes, with samples represented by dots colored by subtype as labeled on the figure. C, Drug sensitivities in the mini-screens carried out on cells grown under 2-D and 3-D conditions, visualized by heat map of normalized AUC values. Clinicopathologic and molecular annotations are provided as bars according to the included key. D, Dose–response curves for the MEK inhibitor trametinib tested against patient-derived models in vitro grown in 2-D. E, Dose–response curves for the MEK inhibitor trametinib tested against patient-derived models in vitro grown in 3-D. Cells harboring MAPK pathway alterations are highlighted in blue. Concentration of compound is plotted on a log scale (x-axis) against cell viability (y-axis). Means plus standard errors are plotted from at least n = 3 experiments.
Figure 2. PIK3R1 and NF1 mutations drive the sensitivity of DIPG cells to trametinib. A, Cartoon representing the protein domains of PIK3R1 showing the mutant residue for the observed hotspot N564D mutation observed in ICR-B181. B, Cartoon representing the protein domains of NF1 showing the mutant residue for the observed I1824S missense mutation observed in ICR-B184. Generated in ProteinPaint (pecan.stjude.cloud/proteinpaint). C, Dose–response validation curves for trametinib tested against ICR-B181 cells in vitro grown in 3-D (PIK3R1N564D, blue) and 2-D (PIK3R1 wild-type, gray). D, Dose–response curves for trametinib tested against ICR-B184 cells in vitro grown in 3-D (NF1I1824S, blue) and 2-D (NF1 wild-type, gray). Concentration of compound is plotted on a log scale (x-axis) against cell viability (y-axis). Mean plus standard error are plotted from at least n = 3 experiments. ****, P < 0.0001, AUC t test. E, Bar plot of quantitative capillary phospho-protein assessment of phospho-ERK1/2T202/Y204, plotted as a ratio to total ERK1/2, and normalized to the 2-D (MAPK wild-type) model in each case. F, VAF (y-axis) of PIK3R1N564D in ICR-B181 cells grown in 3-D (blue) and 2-D (gray) over time, as measured by ddPCR. Passage number of cells assessed is given on the x-axis. G, Survival curves for ICR-B181-CDX models, separated by mice implanted with cells grown as either 2-D (gray) or 3-D (blue). H, Anti–human nuclear antigen (HNA), staining for ICR-B181-CDX derived from cells grown in 3-D, with extensive tumor cell infiltration. Sagittal sections, counterstained with hematoxylin. I, Sagittal T2-weighted image (day 246 postimplantation) for ICR-B181-CDX derived from cells grown in 3-D, showing hyperintense tumor throughout the cerebellum and upper pons (indicated by arrow). J, Hematoxylin and eosin–stained section of ICR-B181–3-D CDX, showing histology consistent with high-grade glioma. Scale bar, 200 μm.
Figure 2.
PIK3R1 and NF1 mutations drive the sensitivity of DIPG cells to trametinib. A, Cartoon representing the protein domains of PIK3R1 showing the mutant residue for the observed hotspot N564D mutation observed in ICR-B181. B, Cartoon representing the protein domains of NF1 showing the mutant residue for the observed I1824S missense mutation observed in ICR-B184. Generated in ProteinPaint (pecan.stjude.cloud/proteinpaint). C, Dose–response validation curves for trametinib tested against ICR-B181 cells in vitro grown in 3-D (PIK3R1N564D, blue) and 2-D (PIK3R1 wild-type, gray). D, Dose–response curves for trametinib tested against ICR-B184 cells in vitro grown in 3-D (NF1I1824S, blue) and 2-D (NF1 wild-type, gray). Concentration of compound is plotted on a log scale (x-axis) against cell viability (y-axis). Mean plus standard error are plotted from at least n = 3 experiments. ****, P < 0.0001, AUC t test. E, Bar plot of quantitative capillary phospho-protein assessment of phospho-ERK1/2T202/Y204, plotted as a ratio to total ERK1/2, and normalized to the 2-D (MAPK wild-type) model in each case. F, VAF (y-axis) of PIK3R1N564D in ICR-B181 cells grown in 3-D (blue) and 2-D (gray) over time, as measured by ddPCR. Passage number of cells assessed is given on the x-axis. G, Survival curves for ICR-B181-CDX models, separated by mice implanted with cells grown as either 2-D (gray) or 3-D (blue). H, Anti–human nuclear antigen (HNA), staining for ICR-B181-CDX derived from cells grown in 3-D, with extensive tumor cell infiltration. Sagittal sections, counterstained with hematoxylin. I, Sagittal T2-weighted image (day 246 postimplantation) for ICR-B181-CDX derived from cells grown in 3-D, showing hyperintense tumor throughout the cerebellum and upper pons (indicated by arrow). J, Hematoxylin and eosin–stained section of ICR-B181–3-D CDX, showing histology consistent with high-grade glioma. Scale bar, 200 μm.
Figure 3. MEK1/2 mutations drive resistance to trametinib in BRAFG469V-driven DIPG cells. A, Protein structure representation of BRAF showing the mutant residue (shaded orange) for the observed G469 missense mutation observed in ICR-B169. Generated in COSMIC-3D (cancer.sanger.ac.uk/cosmic3d). B, Timeline of clinical experience for the child with BRAFG469V-mutant DIPG treated with trametinib at progression. Initial therapy with everolimus and radiotherapy is shaded in orange, later treatment with trametinib in blue. Sagittal T1-weighted postgadolinium MRI images are provided at diagnosis, the initial progression, and the later progression immediately prior to death from disease. Periods of steroid treatment are noted by purple lines. The tumor is highlighted with arrows. C, Survival curves for mice bearing ICR-B169 cell-derived orthotopic xenografts, treated with trametinib (blue), compared with vehicle-treated controls (gray). Treatment window is shaded in gray. D, Experimental design for the generation of cells resistant to trametinib by the continuous exposure model. Parental ICR-B169 cells are treated with either an exponentially increasing dose of inhibitor over time (approach 1) or a constant IC80 dose (approach 2). E, Dose–response curves for trametinib tested against ICR-B169 parental cells (gray) and resistant clones T1 (MEK2I115N, pink), T3 (MEK1I141S, purple), and T6 (MEK1K57N, red) after 7 to 9 months of exposure to inhibitor. F, Dose–response curves for trametinib tested against ICR-B169 parental cells (gray) and resistant clones (dashed lines) after 2-month withdrawal of inhibitor. Concentration of compound is plotted on a log scale (x-axis) against cell viability (y-axis). Means plus standard errors are plotted from at least n = 3 experiments. **, P < 0.001; ***, P < 0.001, AUC t test. G, Emergence of MEK1/2 mutations in clones T1 (pink), T3 (purple), and T6 (red) over time, as assessed by ddPCR. The x-axes represent passage number; left y-axes are specific mutation VAFs; right y-axes plot the concentration of trametinib that cells were exposed to (gray dashed line). H, Emergence of resistance in clones over time (T1, pink; T3, purple; T6, red), plotted as days exposed to inhibitor on the x-axis, with passage numbers labeled. The y-axis is a GI50 value for trametinib in cells harvested at the given passage. I, Pathway activation in resistant clones (T1, pink; T3, purple; T6, red) assessed by a capillary electrophoresis assay and plotted as a ratio of respective phosphorylated/total protein compared to ICR-B169 parental cells (gray).
Figure 3.
MEK1/2 mutations drive resistance to trametinib in BRAFG469V-driven DIPG cells. A, Protein structure representation of BRAF showing the mutant residue (shaded orange) for the observed G469 missense mutation observed in ICR-B169. Generated in COSMIC-3D (cancer.sanger.ac.uk/cosmic3d). B, Timeline of clinical experience for the child with BRAFG469V-mutant DIPG treated with trametinib at progression. Initial therapy with everolimus and radiotherapy is shaded in orange, later treatment with trametinib in blue. Sagittal T1-weighted postgadolinium MRI images are provided at diagnosis, the initial progression, and the later progression immediately prior to death from disease. Periods of steroid treatment are noted by purple lines. The tumor is highlighted with arrows. C, Survival curves for mice bearing ICR-B169 cell-derived orthotopic xenografts, treated with trametinib (blue), compared with vehicle-treated controls (gray). Treatment window is shaded in gray. D, Experimental design for the generation of cells resistant to trametinib by the continuous exposure model. Parental ICR-B169 cells are treated with either an exponentially increasing dose of inhibitor over time (approach 1) or a constant IC80 dose (approach 2). E, Dose–response curves for trametinib tested against ICR-B169 parental cells (gray) and resistant clones T1 (MEK2I115N, pink), T3 (MEK1I141S, purple), and T6 (MEK1K57N, red) after 7 to 9 months of exposure to inhibitor. F, Dose–response curves for trametinib tested against ICR-B169 parental cells (gray) and resistant clones (dashed lines) after 2-month withdrawal of inhibitor. Concentration of compound is plotted on a log scale (x-axis) against cell viability (y-axis). Means plus standard errors are plotted from at least n = 3 experiments. **, P < 0.001; ***, P < 0.001, AUC t test. G, Emergence of MEK1/2 mutations in clones T1 (pink), T3 (purple), and T6 (red) over time, as assessed by ddPCR. The x-axes represent passage number; left y-axes are specific mutation VAFs; right y-axes plot the concentration of trametinib that cells were exposed to (gray dashed line). H, Emergence of resistance in clones over time (T1, pink; T3, purple; T6, red), plotted as days exposed to inhibitor on the x-axis, with passage numbers labeled. The y-axis is a GI50 value for trametinib in cells harvested at the given passage. I, Pathway activation in resistant clones (T1, pink; T3, purple; T6, red) assessed by a capillary electrophoresis assay and plotted as a ratio of respective phosphorylated/total protein compared to ICR-B169 parental cells (gray).
Figure 4. Integrated gene and protein expression profiling of trametinib-resistant DIPG cells. A, Coordinately downregulated genes (left), proteins (middle), and phospho-sites (right) in all three trametinib-resistant subclones of ICR-B169 BRAFG469V cells as compared with parental. B, Coordinately upregulated genes (left), proteins (middle), and phospho-sites (right) in all three trametinib-resistant subclones, as compared with ICR-B169 parental (gray). T1, MEK2I115N, pink; T3, MEK1I141S, purple; T6, MEK1K57N, red. C, GSEA enrichment plots for the signature VERHAAK_GLIOBLASTOMA_PRONEURAL in T6 MEK1K57N cells compared with ICR-B169 parental. The curves show the enrichment score on the y-axis and the rank list metric on the x-axis. Alongside is a heat map representation of expression of significantly differentially expressed genes in the signature in all three trametinib-resistant clones compared with parental. D, GSEA enrichment plots for the signature HALLMARK_EPITHELIAL_MESENCHYMAL_ TRANSITION in T6 MEK1K57N cells compared with ICR-B169 parental. The curves show the enrichment score on the y-axis and the rank list metric on the x-axis. Alongside is a heat map representation of expression of significantly differentially expressed genes in the signature in all three trametinib-resistant clones compared with parental. E, GSEA enrichment plots for the signature HUANG_DASATINIB_RESISTANCE_UP in T6 MEK1K57N cells compared with ICR-B169 parental. The curves show the enrichment score on the y-axis and the rank list metric on the x-axis. Alongside is a heat map representation of expression of significantly differentially expressed genes in the signature in all three trametinib-resistant clones compared with parental. T1, MEK2I115N, pink; T3, MEK1I141S, purple; T6, MEK1K57N, red.
Figure 4.
Integrated gene and protein expression profiling of trametinib-resistant DIPG cells. A, Coordinately downregulated genes (left), proteins (middle), and phospho-sites (right) in all three trametinib-resistant subclones of ICR-B169 BRAFG469V cells as compared with parental. B, Coordinately upregulated genes (left), proteins (middle), and phospho-sites (right) in all three trametinib-resistant subclones, as compared with ICR-B169 parental (gray). T1, MEK2I115N, pink; T3, MEK1I141S, purple; T6, MEK1K57N, red. C, GSEA enrichment plots for the signature VERHAAK_GLIOBLASTOMA_PRONEURAL in T6 MEK1K57N cells compared with ICR-B169 parental. The curves show the enrichment score on the y-axis and the rank list metric on the x-axis. Alongside is a heat map representation of expression of significantly differentially expressed genes in the signature in all three trametinib-resistant clones compared with parental. D, GSEA enrichment plots for the signature HALLMARK_EPITHELIAL_MESENCHYMAL_ TRANSITION in T6 MEK1K57N cells compared with ICR-B169 parental. The curves show the enrichment score on the y-axis and the rank list metric on the x-axis. Alongside is a heat map representation of expression of significantly differentially expressed genes in the signature in all three trametinib-resistant clones compared with parental. E, GSEA enrichment plots for the signature HUANG_DASATINIB_RESISTANCE_UP in T6 MEK1K57N cells compared with ICR-B169 parental. The curves show the enrichment score on the y-axis and the rank list metric on the x-axis. Alongside is a heat map representation of expression of significantly differentially expressed genes in the signature in all three trametinib-resistant clones compared with parental. T1, MEK2I115N, pink; T3, MEK1I141S, purple; T6, MEK1K57N, red.
Figure 5. Reciprocity of drug sensitivities and gene expression signatures between trametinib and dasatinib in DIPG cells. A, Dose–response curves for ulixertinib tested against ICR-B169 parental cells (gray) and resistant clones T1 (MEK2I115N, pink), T3 (MEK1I141S, purple), and T6 (MEK1K57N, red). B, Dose-response curves for dasatinib tested against ICR-B169 parental cells (gray) and resistant clones. Concentration of compound is plotted on a log scale (x-axis) against cell viability (y-axis). Means plus standard errors are plotted from at least n = 3 experiments. *, P < 0.05; **, P < 0.01; ***, P < 0.001, AUC t test. C, Box plot of dasatinib GI50 values (log scale, y-axis) for primary patient-derived cultures separated by trametinib sensitivity status. D, Box plot of trametinib GI50 values (log scale, y-axis) for primary patient-derived cultures separated by dasatinib sensitivity status. **, P < 0.001, t test. E, GSEA enrichment plots for the signature VERHAAK_GLIOBLASTOMA_PRONEURAL in primary patient-derived cultures separated by trametinib (top) or dasatinib (bottom) sensitivity status. The curves show the enrichment score on the y-axis and the rank list metric on the x-axis. Alongside are heat map representations of expression of significantly differentially expressed genes in the signature in all trametinib- or dasatinib-resistant versus sensitive cell cultures. F, GSEA enrichment plots for the signature HALLMARK_EPITHELIAL_ MESENCHYMAL_TRANSITION in primary patient-derived cultures separated by trametinib (top) or dasatinib (bottom) sensitivity status. The curves show the enrichment score on the y-axis and the rank list metric on the x-axis. Alongside are heat map representations of expression of significantly differentially expressed genes in the signature in all trametinib- or dasatinib-resistant versus sensitive cell cultures. G, GSEA enrichment plots for the signature HUANG_DASATINIB_RESISTANCE_UP in primary patient-derived cultures separated by trametinib (top) or dasatinib (bottom) sensitivity status. The curves show the enrichment score on the y-axis and the rank list metric on the x-axis. Alongside are heat map representations of expression of significantly differentially expressed genes in the signature in all trametinib- or dasatinib-resistant versus sensitive cell cultures.
Figure 5.
Reciprocity of drug sensitivities and gene expression signatures between trametinib and dasatinib in DIPG cells. A, Dose–response curves for ulixertinib tested against ICR-B169 parental cells (gray) and resistant clones T1 (MEK2I115N, pink), T3 (MEK1I141S, purple), and T6 (MEK1K57N, red). B, Dose-response curves for dasatinib tested against ICR-B169 parental cells (gray) and resistant clones. Concentration of compound is plotted on a log scale (x-axis) against cell viability (y-axis). Means plus standard errors are plotted from at least n = 3 experiments. *, P < 0.05; **, P < 0.01; ***, P < 0.001, AUC t test. C, Box plot of dasatinib GI50 values (log scale, y-axis) for primary patient-derived cultures separated by trametinib sensitivity status. D, Box plot of trametinib GI50 values (log scale, y-axis) for primary patient-derived cultures separated by dasatinib sensitivity status. **, P < 0.001, t test. E, GSEA enrichment plots for the signature VERHAAK_GLIOBLASTOMA_PRONEURAL in primary patient-derived cultures separated by trametinib (top) or dasatinib (bottom) sensitivity status. The curves show the enrichment score on the y-axis and the rank list metric on the x-axis. Alongside are heat map representations of expression of significantly differentially expressed genes in the signature in all trametinib- or dasatinib-resistant versus sensitive cell cultures. F, GSEA enrichment plots for the signature HALLMARK_EPITHELIAL_ MESENCHYMAL_TRANSITION in primary patient-derived cultures separated by trametinib (top) or dasatinib (bottom) sensitivity status. The curves show the enrichment score on the y-axis and the rank list metric on the x-axis. Alongside are heat map representations of expression of significantly differentially expressed genes in the signature in all trametinib- or dasatinib-resistant versus sensitive cell cultures. G, GSEA enrichment plots for the signature HUANG_DASATINIB_RESISTANCE_UP in primary patient-derived cultures separated by trametinib (top) or dasatinib (bottom) sensitivity status. The curves show the enrichment score on the y-axis and the rank list metric on the x-axis. Alongside are heat map representations of expression of significantly differentially expressed genes in the signature in all trametinib- or dasatinib-resistant versus sensitive cell cultures.
Figure 6. Synergy of combined dasatinib and trametinib in BRAFG469V-driven DIPG cells. A, Cell viability matrices for ICR-B169 parental (gray) and trametinib-resistant clones T1 (MEK2I115N, pink), (T3 MEK1I141S, purple), and T6 (MEK1K57N, red), treated with distinct combinations of dasatinib (y-axes) and trametinib (x-axes) ranging from 0 to 10 μmol/L. A heat map is overlaid to the proportions of viable cells remaining, colored according to the key provided from 1.0 (black, all cells) to 0 (red, no viable cells). B, Excess above BLISS matrices for ICR-B169 parental and trametinib-resistant clones treated with distinct combinations of dasatinib (y-axes) and trametinib (x-axes) ranging from 0 to 10 μmol/L. A heat map is overlaid to the excess score, colored according to the key provided from 0.4 (red, enhanced effects) to 0 (green, no difference). C, BLISS synergy maps for ICR-B169 parental and trametinib-resistant clones treated with distinct combinations of dasatinib (y-axes) and trametinib (x-axes) ranging from 0 to 10 μmol/L. The heat map represents the δ score colored according to the key provided from 30 (red, high degree of synergy) to −30 (green, antagonism).
Figure 6.
Synergy of combined dasatinib and trametinib in BRAFG469V-driven DIPG cells. A, Cell viability matrices for ICR-B169 parental (gray) and trametinib-resistant clones T1 (MEK2I115N, pink), (T3 MEK1I141S, purple), and T6 (MEK1K57N, red), treated with distinct combinations of dasatinib (y-axes) and trametinib (x-axes) ranging from 0 to 10 μmol/L. A heat map is overlaid to the proportions of viable cells remaining, colored according to the key provided from 1.0 (black, all cells) to 0 (red, no viable cells). B, Excess above BLISS matrices for ICR-B169 parental and trametinib-resistant clones treated with distinct combinations of dasatinib (y-axes) and trametinib (x-axes) ranging from 0 to 10 μmol/L. A heat map is overlaid to the excess score, colored according to the key provided from 0.4 (red, enhanced effects) to 0 (green, no difference). C, BLISS synergy maps for ICR-B169 parental and trametinib-resistant clones treated with distinct combinations of dasatinib (y-axes) and trametinib (x-axes) ranging from 0 to 10 μmol/L. The heat map represents the δ score colored according to the key provided from 30 (red, high degree of synergy) to −30 (green, antagonism).
Figure 7. Efficacy of combined dasatinib and trametinib on ex vivo brain slice preparations. A, Coronal slices of normal mouse brain, counterstained with Hoechst 33342 (aqua), are implanted in the pontine region with ICR-B169 parental cells, stained with human nuclear antigen (orange), and treated for 4 days with 1 μmol/L dasatinib, 0.1234 μmol/L trametinib, or both compared with vehicle control. Scale bars, 2 mm. B, Bar plot of quantification of tumor cell infiltration across the brain parenchymal tissue as measured by the calculated area invaded compared with vehicle control. Plotted is the mean of at least six independent slices; error bars represent the SD. *, P < 0.05; **, P < 0.01; ***, P < 0.001; ****, P < 0.0001; ns, not significant, FDR-corrected t test.
Figure 7.
Efficacy of combined dasatinib and trametinib on ex vivo brain slice preparations. A, Coronal slices of normal mouse brain, counterstained with Hoechst 33342 (aqua), are implanted in the pontine region with ICR-B169 parental cells, stained with human nuclear antigen (orange), and treated for 4 days with 1 μmol/L dasatinib, 0.1234 μmol/L trametinib, or both compared with vehicle control. Scale bars, 2 mm. B, Bar plot of quantification of tumor cell infiltration across the brain parenchymal tissue as measured by the calculated area invaded compared with vehicle control. Plotted is the mean of at least six independent slices; error bars represent the SD. *, P < 0.05; **, P < 0.01; ***, P < 0.001; ****, P < 0.0001; ns, not significant, FDR-corrected t test.

Comment in

  • Cancer Discov. 12:587.
  • Cancer Discov. 12:587.

References

    1. Avruch J, Khokhlatchev A, Kyriakis JM, Luo Z, Tzivion G, Vavvas Det al. . Ras activation of the Raf kinase: tyrosine kinase recruitment of the MAP kinase cascade. Recent Prog Horm Res 2001;56:127–55. - PubMed
    1. Zaman A, Wu W, Bivona TG. Targeting oncogenic BRAF: past, present, and future. Cancers 2019;11:1197. - PMC - PubMed
    1. Yao Z, Torres NM, Tao A, Gao Y, Luo L, Li Qet al. . BRAF mutants evade ERK-dependent feedback by different mechanisms that determine their sensitivity to pharmacologic inhibition. Cancer Cell 2015;28:370–83. - PMC - PubMed
    1. Yao Z, Yaeger R, Rodrik-Outmezguine VS, Tao A, Torres NM, Chang MTet al. . Tumours with class 3 BRAF mutants are sensitive to the inhibition of activated RAS. Nature 2017;548:234–8. - PMC - PubMed
    1. Truong AY, Nicolaides TP. Targeted therapy for MAPK alterations in pediatric gliomas. Brain Disord Ther 2015;Suppl 2:005. - PMC - PubMed

Publication types

MeSH terms

Substances