Review
. 2022 Jun 16;59(6):2102334.
doi: 10.1183/13993003.02334-2021. Print 2022 Jun.

The physiological basis of pulmonary arterial hypertension

Affiliations
Review

The physiological basis of pulmonary arterial hypertension

Robert Naeije et al. Eur Respir J. .

Abstract

Pulmonary arterial hypertension (PAH) is a rare dyspnoea-fatigue syndrome caused by a progressive increase in pulmonary vascular resistance and eventual right ventricular (RV) failure. In spite of extensive pulmonary vascular remodelling, lung function in PAH is generally well preserved, with hyperventilation and increased physiological dead space, but minimal changes in lung mechanics and only mild to moderate hypoxaemia and hypocapnia. Hypoxaemia is mainly caused by a low mixed venous oxygen tension from a decreased cardiac output. Hypocapnia is mainly caused by an increased chemosensitivity. Exercise limitation in PAH is cardiovascular rather than ventilatory or muscular. The extent of pulmonary vascular disease in PAH is defined by multipoint pulmonary vascular pressure-flow relationships with a correction for haematocrit. Pulsatile pulmonary vascular pressure-flow relationships in PAH allow for the assessment of RV hydraulic load. This analysis is possible either in the frequency domain or in the time domain. The RV in PAH adapts to increased afterload by an increased contractility to preserve its coupling to the pulmonary circulation. When this homeometric mechanism is exhausted, the RV dilates to preserve flow output by an additional heterometric mechanism. Right heart failure is then diagnosed by imaging of increased right heart dimensions and clinical systemic congestion signs and symptoms. The coupling of the RV to the pulmonary circulation is assessed by the ratio of end-systolic to arterial elastances, but these measurements are difficult. Simplified estimates of RV-pulmonary artery coupling can be obtained by magnetic resonance or echocardiographic imaging of ejection fraction.


Conflict of interest statement

Conflicts of interest: R. Naeije reports relationships including consultancies, speaker fees and membership of advisory boards with AOP Orphan Pharmaceuticals, Johnson & Johnson, Lung Biotechnology Corporation and United Therapeutics. Conflicts of interest: M.J. Richter has received funding from the German Research Foundation (DFG, 413584448) and from the Collaborative Research Center (SFB) 1213 – Pulmonary Hypertension and Cor Pulmonale (grant number SFB1213/1, project B08; German Research Foundation, Bonn, Germany). Conflicts of interest: L.J. Rubin reports consultancies with Actelion, SoniVie, Gossamer Bio and Bellerophon.

Figures

FIGURE 1
FIGURE 1
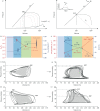
Progressive remodelling of the pulmonary circulation (upper row) and of the right heart (lower row) with, in-between, typical measurements of pulmonary ventilation and gas exchange, steady-flow and pulsatile-flow haemodynamics and right ventricular (RV) function in pulmonary arterial hypertension (PAH). Vascular remodelling was defined by microscopic views from normal (left) to medial hypertrophy, thickening of the three layers of vascular wall and plexiform lesions (upper right). Cardiac remodelling was defined by two-dimensional four-chamber echocardiographic views of right atrial and ventricular dilatation and septal shift ventricular dilatation, respectively. Arrows indicate hypothetical disease progression with increasingly dilating RV and right atrial dimensions. In between are measurements in typical patients with severe idiopathic PAH (IPAH): a) quasi-normal distribution of alveolar ventilation (VA) and perfusion (Q′) as a function of V′/Q′ relationships, arterial partial pressure of oxygen (PaO2) and physiological dead space (dead space volume (VD)/tidal volume (VT)), but with increased V'A; b) increased ventilation (VE) as a function of carbon dioxide output (VCO2) during exercise; c) Poon-adjusted mean pulmonary artery pressure (PAP) as a function of cardiac output (Q′) increased by either exercise or dobutamine showing a decreased slope and increased extrapolated pressure intercept (n=7 patients); d) PAP decay curve after single arterial occlusion showing increased inflection point; e) RV pressure curve with increased pulse pressure, late systolic peaking and increased augmentation index; f) Doppler RV outflow tract flow with shortened acceleration time and mid-systolic deceleration; g) pulmonary artery impedance spectrum, or pressure/flow and phase as a function of frequency, showing an upward shift with increased 0 Hz and high-frequency impedances and low-frequency negative phase angle, with increased characteristic impedance (Zc) in either frequency- or time-domain; h) RV pressure–volume loops with increased end-systolic elastance (Ees) in the presence of increased arterial elastance (Ea), but decreased Ees/Ea and increased dimensions as compared to control measurements. PAPP: pulmonary arterial pulse pressure; sPAP: systolic pulmonary arterial pressure; Pi: inflection of the upstroke pressure. Histological views and echocardiographic images are courtesies from Andrew Peacock (Regional Heart and Lung Centre, Glasgow, UK) and Michele D'Alto (Monaldi Hospital, Naples, Italy). Panel c) is reproduced from [34], with permission.
FIGURE 2
FIGURE 2
a) Distribution of arterial blood gases in 243 patients with idiopathic pulmonary arterial hypertension (IPAH). Most values are decreased, with 51% of PaO2 <70 mmHg, and 45% of PaCO2 <33 mmHg taken as lower limits of normal (shaded columns). b) Alveolar ventilation (VA)/perfusion (Q′) distributions in a patient with IPAH before and after a normalisation procedure correcting for increased VA and decreased Q′, and in a middle-aged control (from left to right). In the IPAH patient, VA/Q′ distributions are shifted to higher VA/Q′, but VA and Q′ modes remain matched. Both the IPAH patient and the healthy control have a small amount of perfusion to low VA/Q′. The IPAH patient has also a small amount of shunt (VA/Q′=0) which was increased with correction for high VA and low Q′. c) Ventilation (VE) as a function of carbon dioxide (CO2) output adjusted for interindividual variability in 12 PAH patients and in 10 controls. VE was increased at rest and more so at exercise. d) Plotting VE/VCO2 as a function of arterial carbon dioxide tension (PaCO2) at the anaerobic threshold during exercise (AT) uncovers increased dead space ventilation (dead space volume (VD)/tidal volume (VT)) and chemosensitivity as causes of increased ventilation in PAH and COPD, or only increased chemosensitivity in heart failure patients. The arterial to end-tidal oxygen tension gradient increased >5 mmHg (the upper limit of normal) in PAH and in COPD. Reproduced from [16] and [25] with permissions.
FIGURE 3
FIGURE 3
Mean pulmonary artery pressure (mPAP) as a function of cardiac output increased by exercise in seven patients before and after 6 weeks of prostacyclin therapy, which was associated with an improvement in the 6-min walk distance by an average of 80 m. Prostacyclin did not affect resting pulmonary vascular resistance (PVR), but decreased exercise PVR and the slope of mPAP as a function of cardiac output (data from [36]).
FIGURE 4
FIGURE 4
Modelled mean pulmonary arterial pressure (mPAP)–cardiac output relationships during dynamic exercise with progressively increased distensibility coefficients α from 0 to 10% of vessel diameter per mmHg transmural pressure. Normal values for α are between 1%·mmHg−1 and 2%·mmHg−1. Pulmonary vascular distension markedly decreases mPAP at high levels of cardiac output. Reproduced from [40] with permission.
FIGURE 5
FIGURE 5
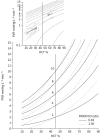
Pulmonary vascular resistance (PVR) as a function of haematocrit (HCT). Iso-PVR curves allow for a prediction of PVR “normalised” for HCT at 45% in anaemic or polycythaemic patients, at normal or increased pulmonary artery wedge pressures (PAWP) versus cardiac output (CO) relationships. Measured PVR in anaemic or polycythaemic patients at increased or decreased HCT by blood transfusion or haemodilution are shown by arrows in the upper window, with mean responses (thick arrows) showing conformance to predicted changes. Reproduced from [44] with permission.
FIGURE 6
FIGURE 6
Model predictions of percentage of pulmonary vascular obstruction by linearised adjustments of mean pulmonary artery pressure (mPAP) as a function of cardiac output. mPAP 25 mmHg or 20 mmHg at a cardiac output of 5 L·min−1 correspond to 50% and 25% obstruction, respectively. Reproduced and modified from [45] with permission.
FIGURE 7
FIGURE 7
a) Pulmonary vascular impedance spectrum expressed as pulmonary artery pressure–flow ratio (“modulus”) as a function of frequency. For discussion of the relevant points, see indications on figure and comments in the text. b) Pulmonary artery pressure (PAP) curve in severe pulmonary hypertension showing an increased augmentation index, or gradient between systolic PAP (sPAP) and inflection of the upstroke pressure (Pi) divided by PA pulse pressure (PAPP). c) Doppler pulmonary artery flow waves in a normal subject (left panel) and in patients with severe PH (right and lower panels). Pulmonary hypertension was associated with a decreased acceleration time (AT) corrected for ejection time (ET) and mid-systolic deceleration of flow (notching) or late systolic deceleration of flow. TN: time to notching, NET: time from notching to end-ejection. d) Hyperbolic relationship between pulmonary artery compliance (PAC) and pulmonary vascular resistance (PVR) in patients with either a high or a normal pulmonary artery wedge pressure (PAWP). A high PAWP shifts the relationship to the left with decreased RC-time. Reproduced from [53], [64] and [77] with permissions.
FIGURE 8
FIGURE 8
a) Multiple- and single-beat methods for calculating right ventricular (RV)–arterial coupling. In both methods, arterial elastance (Ea) is calculated from the ratio of end-systolic pressure (ESP) to stroke volume (SV). End-systolic elastance (Ees) as an approximation of maximum elastance is estimated by the ratio of ESP to end-systolic volume (ESV). In the multiple-beat method, Ees is defined by a tangent to a family of loops determined at decreasing venous return. In the single-beat method, a maximum pressure (Pmax) is estimated from the nonlinear extrapolation of the early systolic and diastolic portions of the RV pressure curve, and Ees defined by a straight line drawn from Pmax tangent to RV pressure to relative change in volume relationship. Diastolic stiffness (β) is calculated by fitting the nonlinear exponential, p=α (e−1), to pressure and volume measured at the beginning and end of diastole. b) Evolution from normal to progressively more severe pulmonary arterial hypertension (PAH) (T1 to T3) of RV Ees/Ea, ejection fraction (EF) end-diastolic elastance (Eed) and RV end-diastolic volume (EDV) corrected for body surface area (BSA). The RV dilates with EDV above limits of normal when Ees/Ea and EF approximate 0.8 and 0.35, respectively. Increased Eed mirrors decreased Ees/Ea. c) RV pressure–volume loops from patients i) without pulmonary hypertension to iv) severe pulmonary hypertension, showing progressive change in shape with shift to late systolic peaking of pressure and “notching”, while ESP becomes higher than pressure at the onset of ejection (BSP). Reproduced from [86], [96] and [99] with permission.

References

    1. Simonneau G, Montani D, Celermajer DS, et al. . Hemodynamic definitions and updated clinical classification of pulmonary hypertension. Eur Respir J 2019; 53: 1801913. doi:10.1183/13993003.01913-2018 - DOI - PMC - PubMed
    1. Galiè N, Channick RN, Frantz RP, et al. . Risk stratification and medical therapy of pulmonary arterial hypertension. Eur Respir J 2019; 53: 1801889. doi:10.1183/13993003.01889-2018 - DOI - PMC - PubMed
    1. Heath D, Edwards JE. The pathology of pulmonary vascular disease: a description of six grades of structural changes in the pulmonary arteries, with special reference to congenital cardiac septal defects. Circulation 1958; 18: 533–547. doi:10.1161/01.CIR.18.4.533 - DOI - PubMed
    1. Wagenvoort CA, Wagenvoort N. Primary pulmonary hypertension: a pathologic study of the lung vessels in 156 clinically diagnosed cases. Circulation 1970; 42: 1163–1184. doi:10.1161/01.CIR.42.6.1163 - DOI
    1. Palevsky HI, Schloo BL, Pietra GG, et al. . Primary pulmonary hypertension. Vascular structure, morphometry, and responsiveness to vasodilator agents. Circulation 1989; 80: 1207–1221. doi:10.1161/01.CIR.80.5.1207 - DOI - PubMed

Publication types