. 2021 Nov 4;12(1):6407.
doi: 10.1038/s41467-021-26600-5.

Genome-wide profiling in colorectal cancer identifies PHF19 and TBC1D16 as oncogenic super enhancers

Affiliations

Genome-wide profiling in colorectal cancer identifies PHF19 and TBC1D16 as oncogenic super enhancers

Qing-Lan Li et al. Nat Commun. .

Abstract

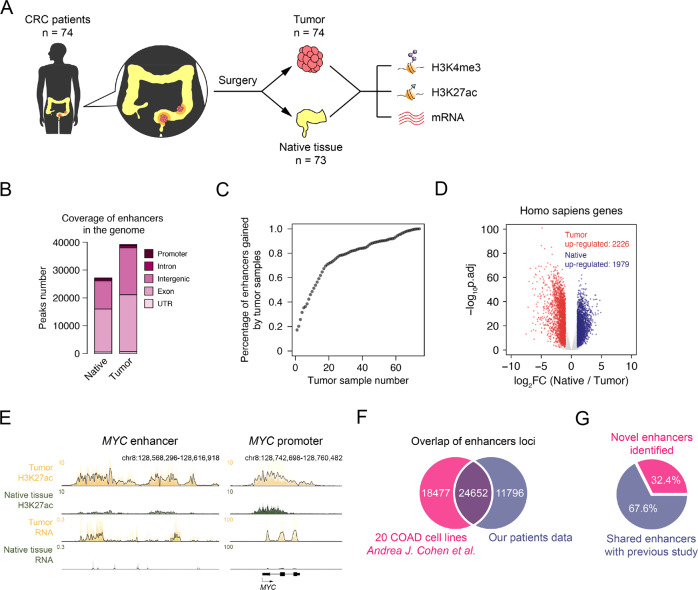
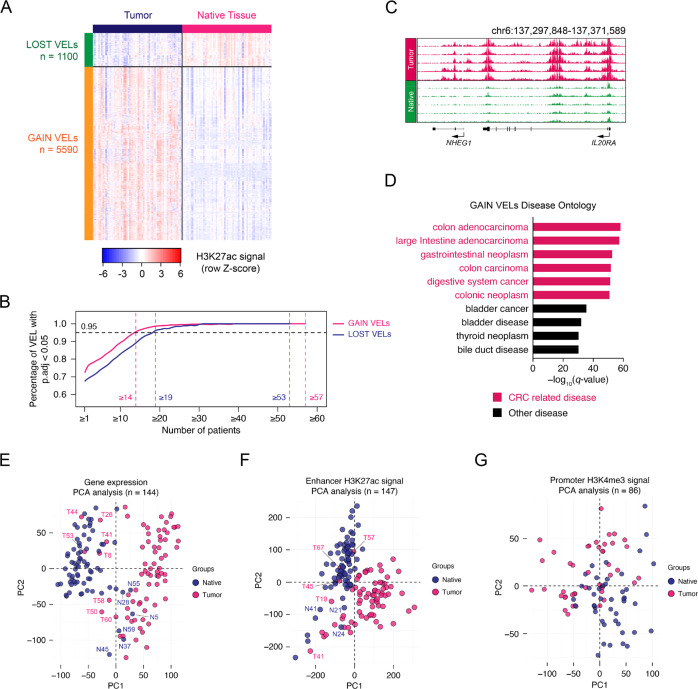
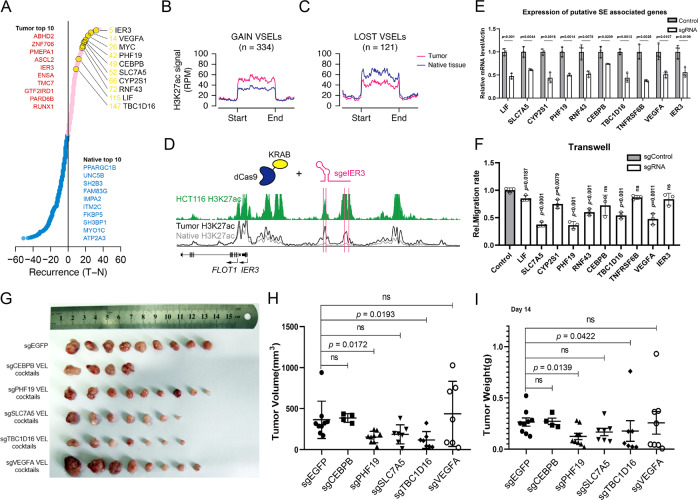
Colorectal cancer is one of the most common cancers in the world. Although genomic mutations and single nucleotide polymorphisms have been extensively studied, the epigenomic status in colorectal cancer patient tissues remains elusive. Here, together with genomic and transcriptomic analysis, we use ChIP-Seq to profile active enhancers at the genome wide level in colorectal cancer paired patient tissues (tumor and adjacent tissues from the same patients). In total, we sequence 73 pairs of colorectal cancer tissues and generate 147 H3K27ac ChIP-Seq, 144 RNA-Seq, 147 whole genome sequencing and 86 H3K4me3 ChIP-Seq samples. Our analysis identifies 5590 gain and 1100 lost variant enhancer loci in colorectal cancer, and 334 gain and 121 lost variant super enhancer loci. Multiple key transcription factors in colorectal cancer are predicted with motif analysis and core regulatory circuitry analysis. Further experiments verify the function of the super enhancers governing PHF19 and TBC1D16 in regulating colorectal cancer tumorigenesis, and KLF3 is identified as an oncogenic transcription factor in colorectal cancer. Taken together, our work provides an important epigenomic resource and functional factors for epigenetic studies in colorectal cancer.


Conflict of interest statement

The authors declare no competing interests.

Figures

Fig. 1
Fig. 1. The annotation of active enhancers in CRC patient tissues.
A Experimental workflow for studying the enhancer landscapes of tumor and native tissues from CRC patients. B Genomic distribution of enhancer elements in tumor and native tissues from CRC patients. C Saturation analysis showing the percentage of newly gained enhancers comparing with total significant enhancers along with an increasing number of the tumor samples. D Fold change (FC) and p.adj of human gene expression comparing tumor and native tissues. Red dots represent tumor up-regulated genes, blue dots for native tissue up-regulated genes, and grey dots for genes not changed. E Normalized ChIP-seq and RNA-seq Meta tracks showing H3K27ac and mRNA signal on MYC promoter and enhancer loci. F Overlap of enhancer loci between our patient data and 20 COAD cell lines (GSE77737, Andrea J. Cohen et al.). G Percentage of novel enhancers in CRC identified in our study.
Fig. 2
Fig. 2. Identification of variant enhancer loci in CRC.
A Relative H3K27ac signals of lost and gain VELs in all tumor and native tissues. B The required recurrence for gain and lost VELs meeting statistical significance (p.adj <0.05). The two vertical dashed lines at left highlights the recurrence of gain and lost VELs when achieve the cut-off (0.95, black dashed line) of significant percentage, and the two lines at right highlights the highest recurrence in tumor or native tissue of gain and lost VELs, respectively. For gain VELs, when recurrence reach to 14, the percentage of significant VELs is 95.635%; for lost VELs, when recurrence reaches to 19, the percentage of significant VELs is 96.273. p.adj indicates the BH adjusted t-test p-value. A two-sided test was utilized here. C Representative H3K27ac tracks of gain VEL on IL20RA loci. D The human disease ontology in which gain VELs participated detected by GREAT software (version 3.0.0). The red bars represent CRC-related diseases and the black bars represent other diseases. EG PCA analyses to classify tumor and native tissues using gene expression (E), all significant enhancers (F), and promoters (G) information identified using our patient RNA-seq and ChIP-seq data.
Fig. 3
Fig. 3. The feature of enhancers in CMS subgroups.
A The patient identifier of members in four CMS subgroups. B The consensus molecular subtypes (CMS) classification of CRC samples using R package CMScaller. C Correlation of H3K27ac signal on the regions of gain VELs in all tumor samples of CMS1–4 subgroups. Correlations were calculated by the Spearman correlation coefficient. D The required recurrence for gain VELs in each CMS subgroup to meet statistical significance (p.adj <0.05) at different cut-offs. The dashed lines highlight the recurrence of gain VELs when achieve the cut-off (0.9, black dashed line) of a significant percentage. When recurrence reach to the cut-off, the significant percentage of CMS1 = 93.942%, CMS2 = 93.615%, CMS3 = 95.741% and CMS4 = 93.548%. p.adj indicates the BH adjusted t-test p-value. A two-sided test was utilized here. E The number of subgroup significant gain VELs in four CMS subgroups. F The average H3K27ac signal (RPM) on the regions of gain VELs in four CMS subgroups. G The number of subgroup-specific gain VELs in each CMS. The subgroup-specific gain VELs were identified when the mean RPM of one VEL in one CMS subgroup was 1.5 times higher than the other three. H Functional annotation of target genes associated with CMS2 specific gain VELs based on their significant overlap with gene sets annotated in Gene Ontology (Biological Process) and pathway database (Reactome). I Meta tracks of normalized H3K27ac on CEL and DPEP1 gene loci in four CMS subgroups.
Fig. 4
Fig. 4. Functions of tumor-specific super enhancers in CRC.
A The genes associated with top super-enhancers (SEs) ranked by recurrence. Red dots represent tumor-specific SE genes and blue dots represent native tissue-specific SE genes. Top 10 tumor and native tissue-specific genes were listed. BC The average H3K27ac signal (RPM) at the regions of gain VSELs (B) and lost VSELs (C) in tumor and native tissues. D Meta normalized H3K27ac tracks at IER3 gene loci. The green track on the top represents the H3K27ac signal in HCT116, and the black and grey lines at the bottom represent the average signal of tumor and native tissues, respectively. The pink lines indicate the target positions of dCas9-KRAB sgRNAs. E Bar plot showing the relative mRNA level of LIF, SLC7A5, CYP2S1, PHF19, RNF43, CEBPB, TBC1D16, TNFRSF6B, VEGFA, and IER3 in control and sgRNA groups (n = 3). A sgRNA control targeting EGFP was used as a control in the following experiments. *p < 0.05. F Transwell assays for HCT116 cell lines stably transfected with dCas9-KRAB sgRNAs of the enhancers mentioned in Fig. 5E (n = 3). GI Xenograft experiments in nude mice were performed with HCT116 stable cells expressing the indicated sgRNAs. The tumors were pictured (G), and their volume and weight were shown (H&I). n = 9 for all groups. Data are presented as mean values ± SEM. Statistical analysis was performed using a two-sided Student t test. p value was labelled on the corresponding items.
Fig. 5
Fig. 5. Prediction of functional transcription factors in CRC.
A DNA motifs enriched within nucleosome-free regions (NFRs) of tumor gain VELs determined by HOMER motif analysis. B Heatmap of transcription factors ranked by predicted core regulatory circuitry (CRC) total degrees (Tumor - Native tissue). Top 30 tumor and native-specific TFs were listed. C Scatter plot showing the total degree (Tumor-Native tissue) and expression FC (Tumor/Native tissue) of the specific TFs listed in Fig. 5B. Blue dots represent top 30 tumor specific TFs, and red dots represent the top 30 native-specific TFs. Circle size indicates the mean expression (FPKM) of TFs in its specific tissue. D, E Transwell assay for HCT116 cell line with KLF3 knockdown. KLF3 was measured with western blotting. p-value = 1.06E−4 (sgKLF3.1), and 1.55E−4 (sgKLF3.2). n = 3. Data are presented as mean values ± SEM. FH KLF3 stably knockdown HCT116 cells by sgRNA were injected into nude mice (10^6 cell pear mouse, n = 10). Tumors were pictured (F), and tumor growth curve (G) and weight (H) were shown as mean (± SEM). P-value in G for sgKLF3.1 and KLF3.2 are 0.0261 and 0.0296, in H for sgKLF3.1 and KLF3.2 are 0.0256 and 0.0355, respectively. Statistical analysis was performed using a two-sided Student t test. *p < 0.05, **p < 0.01.

References

    1. Shlyueva D, Stampfel G, Stark A. Transcriptional enhancers: from properties to genome-wide predictions. Nat. Rev. Genet. 2014;15:272–286. doi: 10.1038/nrg3682. - DOI - PubMed
    1. Calo E, Wysocka J. Modification of enhancer chromatin: what, how, and why? Mol. Cell. 2013;49:825–837. doi: 10.1016/j.molcel.2013.01.038. - DOI - PMC - PubMed
    1. Nizovtseva EV, Todolli S, Olson WK, Studitsky VM. Towards quantitative analysis of gene regulation by enhancers. Epigenomics. 2017;9:1219–1231. doi: 10.2217/epi-2017-0061. - DOI - PMC - PubMed
    1. Rickels R, Shilatifard A. Enhancer logic and mechanics in development and disease. Trends Cell Biol. 2018;28:608–630. doi: 10.1016/j.tcb.2018.04.003. - DOI - PubMed
    1. Medina-Rivera A, Santiago-Algarra D, Puthier D, Spicuglia S. Widespread enhancer activity from core promoters. Trends Biochem Sci. 2018;43:452–468. doi: 10.1016/j.tibs.2018.03.004. - DOI - PubMed

Publication types