. 2021 Nov 4;12(1):6409.
doi: 10.1038/s41467-021-26746-2.

Constitutive activation of the PI3K-Akt-mTORC1 pathway sustains the m.3243 A > G mtDNA mutation

Affiliations

Constitutive activation of the PI3K-Akt-mTORC1 pathway sustains the m.3243 A > G mtDNA mutation

Chih-Yao Chung et al. Nat Commun. .

Abstract

Mutations of the mitochondrial genome (mtDNA) cause a range of profoundly debilitating clinical conditions for which treatment options are very limited. Most mtDNA diseases show heteroplasmy - tissues express both wild-type and mutant mtDNA. While the level of heteroplasmy broadly correlates with disease severity, the relationships between specific mtDNA mutations, heteroplasmy, disease phenotype and severity are poorly understood. We have carried out extensive bioenergetic, metabolomic and RNAseq studies on heteroplasmic patient-derived cells carrying the most prevalent disease related mtDNA mutation, the m.3243 A > G. These studies reveal that the mutation promotes changes in metabolites which are associated with the upregulation of the PI3K-Akt-mTORC1 axis in patient-derived cells and tissues. Remarkably, pharmacological inhibition of PI3K, Akt, or mTORC1 reduced mtDNA mutant load and partially rescued cellular bioenergetic function. The PI3K-Akt-mTORC1 axis thus represents a potential therapeutic target that may benefit people suffering from the consequences of the m.3243 A > G mutation.


Conflict of interest statement

The authors declare no competing interests.

Figures
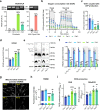
Fig. 1
Fig. 1. The m.3243 A > G mtDNA mutation causes mitochondrial dysfunction and oxidative stress.
a PCR-RFLP and ARMS-qPCR were used to quantify the mutation load for patient-derived fibroblasts (n = 3 independent biological samples) and A549 cybrid cells (n = 5 independent biological samples). bd Cell respiratory capacity was measured using the Seahorse XFe96 extracellular flux analyser in patient fibroblasts (n = 6 culture wells) showing a major decrease in oxygen consumption under all conditions (b, p < 0.0001). Oxygen consumption dependent on ATP production (c, p < 0.0001)—the response to oligomycin—and extracellular acidification rate (ECAR) are plotted (d, p < 0.0001). e, f The expression of respiratory chain proteins and supercomplex assembly in patient fibroblasts were assessed using blue native gel electrophoresis (BNGE, e) and quantified (f, p < 0.0001), showing a major decrease in the assembly of all supercomplexes from the patient-derived cells (n = 3 independent experiments). g, h The mitochondrial membrane potential of fibroblasts was measured using TMRM with confocal microscopy (g) and quantified (h, p < 0.0001), showing a significant decrease in potential in patient-derived cells (n = 5 independent experiments). Scale bar = 50 μm. i ROS production rates of control and patient fibroblasts were measured using the reporters, DHE (p < 0.0001) and MitoSOX (p < 0.0001). Rates of ROS production were significantly increased in patient-derived cells (n = 6 independent biological samples). Source data are provided as a Source Data file. All data were represented as mean ± SD and data were analysed by one-way ANOVA with Tukey’s multiple comparisons test (*p < 0.05, **p < 0.01, ***p < 0.001, ****p < 0.0001).
Fig. 2
Fig. 2. The m.3243 A > G mtDNA mutation switches cell metabolism to a more glycolytic phenotype, resulting in redox imbalance.
a, b The growth rates of patient fibroblasts were measured under a range of different nutrient conditions (normalised to the growth rate of each cell line in regular cell media), showing a decrease of growth rate compared to controls at glucose concentrations of 5 and 1 mM (a, p < 0.0001) but not at low glutamine (b) concentrations (n = 6 culture wells for all conditions, three independent experiments). c Glucose uptake in patient fibroblasts was measured using the fluorescent glucose analogue, 2-NBDG, showing a significantly increased rate of glucose uptake in the patient fibroblasts (n = 14 culture wells, p < 0.0001). d, e NADH:NAD+ ratio of fibroblasts was measured using the reporter, SoNar, under basal conditions (n = 48, 46, 83 and 46 cells for Ctrl 1, Ctrl 2, Pat 1 and Pat 2 respectively) and after addition of pyruvate (200 μM, 30 min; n = 42, 33, 83 and 50 cells for Ctrl 1, Ctrl 2, Pat 1 and Pat 2 respectively; d) and quantified (e, p < 0.0001). Scale bar = 100 μm. f Lactate production (normalised to glucose consumption) was measured in the media of fibroblasts using CuBiAn and showed a significant increase in lactate release in the media of patient-derived cells (n = 4 independent biological samples, p = 0.0008). Source data were provided as a Source Data file. All data were represented as mean ± SD and data were analysed by one/two-way ANOVA with Tukey’s multiple comparisons test (*p < 0.05, **p < 0.01, ***p < 0.001, ****p < 0.0001).
Fig. 3
Fig. 3. The m.3243 A > G mutation rewires glucose metabolism towards increased anabolic biosynthesis.
a The heatmap of metabolite concentrations obtained by GC–MS was generated by MetaboAnalyst 5.0 (n = 3 technical replicates), revealing significant differences in the concentrations of several metabolites between controls and patient fibroblasts (unpaired t-test; p values are shown). b Schematic of simplified glucose metabolism of the cells (Red arrows, upregulated pathways or reactions; three yellow circles of pyruvate and beyond, pyruvate is converted to OAA by pyruvate carboxylase; three or two grey circles of pyruvate and beyond, pyruvate is converted to acetyl-CoA by PDH. Tracing the distribution and abundance of 13C enrichment in the intermediates of glycolysis and the TCA cycle combined with Fig. 3a and Supplementary Fig. 3b revealed an increase in lipid synthesis and PC activity (n = 3 independent biological samples). G6P glucose-6-phosphate, αG3P glycerol-3-phosphate (p < 0.0001 in m + 0 and m + 3), 3PG 3-phosphoglyceric acid. Pyruvate, p = 0.0201 in m + 0 and p = 0.0082 in m + 3; Citrate, p = 0.0002 in m + 2 and p < 0.0001 in m + 3; Fumarate, p < 0.0001 in m + 0 and m + 3; Malate, p < 0.0001 in m + 0 and m + 3; Aspartate, p < 0.0001 in m + 0 and m + 3. Source data are provided as a Source Data file. All data, except Fig. 3a, are represented as mean ± SD and were analysed by one-way ANOVA with Tukey’s multiple comparisons test for fibroblasts (*p < 0.05, **p < 0.01, ***p < 0.001, ****p < 0.0001).
Fig. 4
Fig. 4. The PI3K-Akt-mTORC1 axis is upregulated in the m.3243 A > G mutant cells.
a Analysis of RNA-seq data from the patient fibroblasts by QIAGEN ingenuity pathway analysis (IPA) showed cell signalling pathways, which are enriched in cells carrying the m.3243 A > G mutation. These include striking and significant increases in the expression of pathways involving PI3K-Akt, mTOR, EIF2, and NRF2. It is notable also that PTEN expression, a negative regulator of PI3K-Akt-mTOR signalling was downregulated (p < 0.05). b, c Immunoblotting of p-Akt (S473)/Akt, p-S6 (S235/236)/S6 and p-AMPK (T172)/AMPK in patient fibroblasts grown in the presence of 10 or 1% FBS media (b), showing a major increase in p-Akt/Akt (p < 0.0001) and p-S6/S6 (p < 0.0001) in the presence of 1% FBS media in the mutant cells; in contrast, there is no difference in p-AMPK/AMPK (c; n = 3 independent experiments). d, e Immunofluorescence staining for p-Akt (S473)/Akt (n = 66 and 78 muscle fibres for Control and Patient, respectively; p < 0.0001) and p-S6 (S235/236)/S6 (n = 30 and 23 muscle fibres for Control and Patient, respectively; p < 0.0001) in patient muscle biopsies (d) confirmed the increased phosphorylation of Akt and S6 in the patient muscle biopsies (e). Scale bar = 100 μm. Source data are provided as a Source Data file. All data, except Fig. 4a, are represented as mean ± SD and were analysed by one-way ANOVA with Tukey’s multiple comparisons test for fibroblasts and by unpaired t-test for biopsies (*p < 0.05, **p < 0.01, ***p < 0.001, ****p < 0.0001).
Fig. 5
Fig. 5. Inhibitors of the PI3K-Akt-mTORC1 axis, LY294002 and Rapamycin, reduce mutation load, partially rescue mitochondrial function and reduce glucose dependence.
a, b Schematic depicting pharmacological inhibition of the PI3k-Akt-mTORC1 axis by LY290042 (LY), GDC0941 (GDC), MK2206 (MK) or Rapamycin (RP) (a; created with BioRender.com.). b Sustained treatment of cells over 6 or 12 weeks with LY (5 µM) GDC (1 µM), MK (1 µM) or RP (5 µM) caused a progressive decrease in relative mutant mtDNA load in A549 cybrid cells and fibroblasts of patient 1 and suppressed the progressive increase of mutant load with time in culture seen in patient 2 fibroblasts (n = 3 independent experiments; p < 0.0001 in all three cell lines). The concentrations here refer to all subsequent treatments. c, d The mitochondrial membrane potential (TMRM 25 nM) of patient 1 fibroblasts was significantly increased following treatment with LY, GDC, MK or RP for 12 weeks (n = 10 independent experiments; p < 0.0001). Scale bar = 50 μm. e The respiratory capacity of patient 1 fibroblasts treated with LY, GDC, MK or RP for 12 weeks showed a major increase in oxygen consumption under all conditions following the drug treatments cells (n = 14 of culture wells; p < 0.0001). f, g The NADH:NAD+ ratio of patient 1 fibroblasts treated with LY or RP for 12 weeks was measured under basal conditions (n = 243, 280 and 285 cells for Pat 1, RP and LY, respectively) and in the presence of pyruvate (200 μM, 30 min; n = 188, 272 and 342 cells for Pat 1, RP and LY, respectively; f) and quantified (g; p < 0.0001). The data showed a significant decrease compared to pretreatment levels (blue dash line, basal NADH:NAD+ ratio of controls; red dash line, NADH:NAD+ ratio of controls under pyruvate condition). Scale bar = 25 μm. h Acidification of the growth medium was significantly reduced following chronic drug treatments with RP and LY (n = 9 culture wells; p < 0.0001). Lactate production (n = 4 culture wells; p = 0.0070) was also significantly reduced. Blue dashed line, basal levels of controls. i Fibroblasts of patient 1 treated with LY or RP for 12 weeks were also cultured in media with a variety of glucose/galactose concentrations to further assess the glucose dependence, displayed a significant improvement of cell growth in all conditions from the drug-treated cells (n = 8 culture wells for the 25 and 10 mM glucose groups and n = 4 culture wells for the galactose + pyruvate group; p < 0.0001). j, k Respiratory chain proteins and supercomplex assembly of patient 1 fibroblasts treated with LY or RP (j) showed a major and significant increase in the assembly of almost all supercomplexes from the drug-treated cells (k, n = 3 independent experiments; p < 0.0001). l ROS production rates of patient 1 fibroblasts treated with LY or RP for 12 weeks were significantly reduced to the level that was lower than or no difference from controls (n = 6 wells for Ctrls and Pat 1; n = 3 wells for the RP and LY groups; p < 0.0001). Source data are provided as a Source Data file. All data represented as mean ± SD and were analysed by one/two-way ANOVA with Tukey’s multiple comparisons test (*p < 0.05, **p < 0.01, ***p < 0.001, ****p < 0.0001, vs patient/mutant control; #p < 0.05, ##p < 0.01, ###p < 0.001, ####p < 0.0001, vs WT control).
Fig. 6
Fig. 6. Reduction of the m.3243 A > G mutant load by inhibition of PI3K-Akt-mTORC1 requires neither selective cell death nor clonal expansion and is a cell-autonomous event.
a A flow chart describing the cell culture process used to assess cell growth/death over the 4- or 8-week drug pretreatments. Cells were pretreated with either vehicle, LY or RP for the time periods as specified in Fig. 6b (‘pretreatment’) and then seeded into 96-well plates for measuring cell growth/death with either vehicle, LY or RP (‘treatment’). Single-cell PCR for the m.3243 A > G mutant loads was performed at the end of pretreatments using TaqMan SNP genotyping. The chart was created with BioRender.com. b Cell growth (upper panel) and cell death (lower panel) over the 4- or 8-weeks drug pretreatments of A549 cybrid cells (left panel) and patient 1 fibroblasts (right panel) were measured using Incucyte (n = 6 culture wells; p < 0.0001). Although treatment with either LY or RP at 5 μM slowed cell proliferation in both patient 1 fibroblasts and cybrid cells, the cell death numbers were also lowered by the drug treatments. c, d A scatter plot showing the distribution of WT and mutant mtDNA measured in single A549 cybrid cells treated with LY or RP for 6 weeks showed a clear shift of mutant load distribution (c). d Mutant load distributions of single A549 cybrid cells (n > 850 cells) and patient 1 fibroblasts (n > 350 cells) treated with LY or RP for 6 and 12 weeks, respectively. Source data are provided as a Source Data file. All data represented as mean ± SD and were analysed by one/two-way ANOVA with Tukey’s multiple comparisons test (*p < 0.05, **p < 0.01, ***p < 0.001, ****p < 0.0001).
Fig. 7
Fig. 7. Inhibition of the PI3K-Akt-mTORC1 axis reduces the m.3243 A > G mutant load.
A scheme describing how the m.3243 A > G mutation alters cell metabolism, including mitochondrial dysfunction, altered glucose metabolism, redox imbalance and oxidative stress, which may lead to the constitutive activation of the PI3K-Akt-mTORC1 pathway. Pharmacological inhibition of this pathway reduces mutant load, partially rescues mitochondrial function and reduces glucose dependence in a cell-autonomous way. Although the underlying mechanisms for selecting against the mutant mtDNA need further investigations, these findings suggest that the activation of the PI3K-Akt-mTORC1 pathway drives a positive feedback cycle, which maintains/increases mutant mtDNA, augments the metabolic rewiring and thus exacerbates the perturbation of cell signalling. This positive feedback loop may shape the phenotype of the disease and determine disease progression. The scheme was created using BioRender.com.

References

    1. Gorman, G. S. et al. Prevalence of nuclear and mitochondrial DNA mutations related to adult mitochondrial disease. Ann. Neurol. 10.1002/ana.24362 (2015). - PMC - PubMed
    1. Russell OM, Gorman GS, Lightowlers RN, Turnbull DM. Mitochondrial diseases: hope for the future. Cell. 2020;181:168–188. doi: 10.1016/j.cell.2020.02.051. - DOI - PubMed
    1. Craven L, Alston CL, Taylor RW, Turnbull DM. Recent advances in mitochondrial disease. Annu. Rev. Genomics Hum. Genet. 2017;18:257–275. doi: 10.1146/annurev-genom-091416-035426. - DOI - PubMed
    1. Schon EA, DiMauro S, Hirano M. Human mitochondrial DNA: roles of inherited and somatic mutations. Nat. Rev. Genet. 2012;13:878–890. doi: 10.1038/nrg3275. - DOI - PMC - PubMed
    1. Szczepanowska J, Malinska D, Wieckowski MR, Duszynski J. Effect of mtDNA point mutations on cellular bioenergetics. Biochim. Biophys. Acta Bioenerg. 2012;1817:1740–1746. doi: 10.1016/j.bbabio.2012.02.028. - DOI - PubMed

Publication types

MeSH terms

Substances