. 2021 Nov 4;6(1):132.
doi: 10.1038/s41541-021-00396-3.

Distinct SARS-CoV-2 antibody reactivity patterns elicited by natural infection and mRNA vaccination

Collaborators, Affiliations

Distinct SARS-CoV-2 antibody reactivity patterns elicited by natural infection and mRNA vaccination

Rafael Assis et al. NPJ Vaccines. .

Abstract

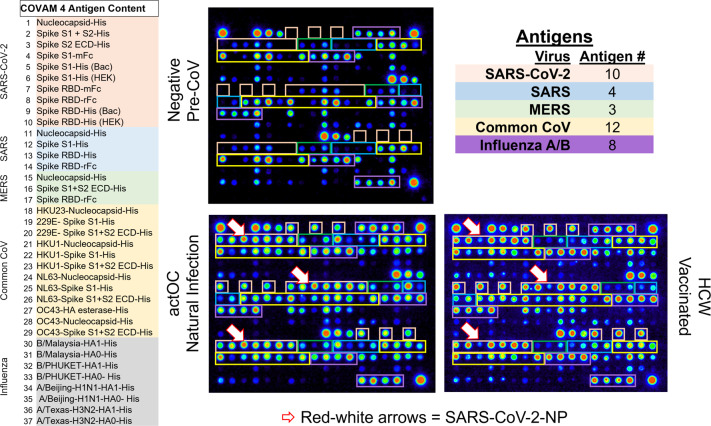
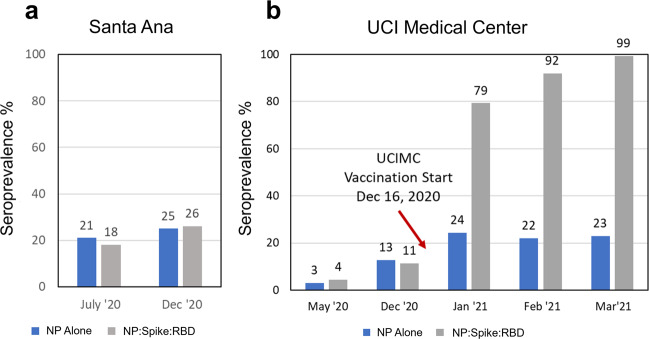
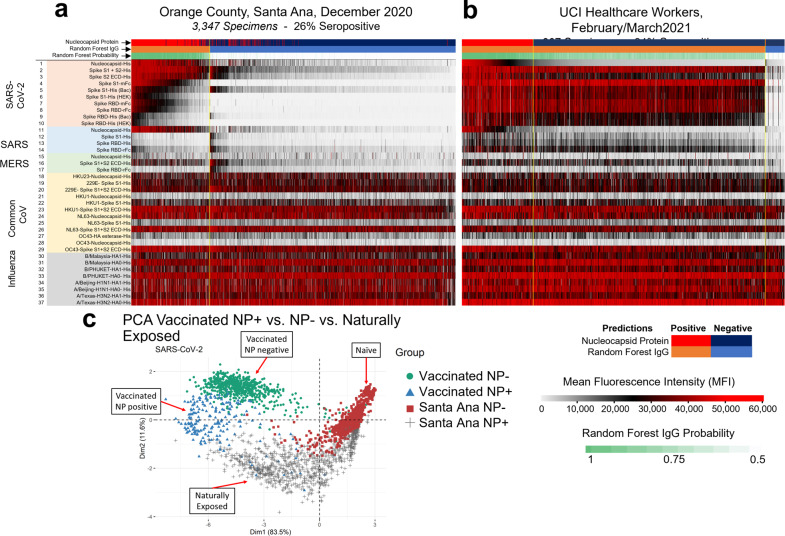
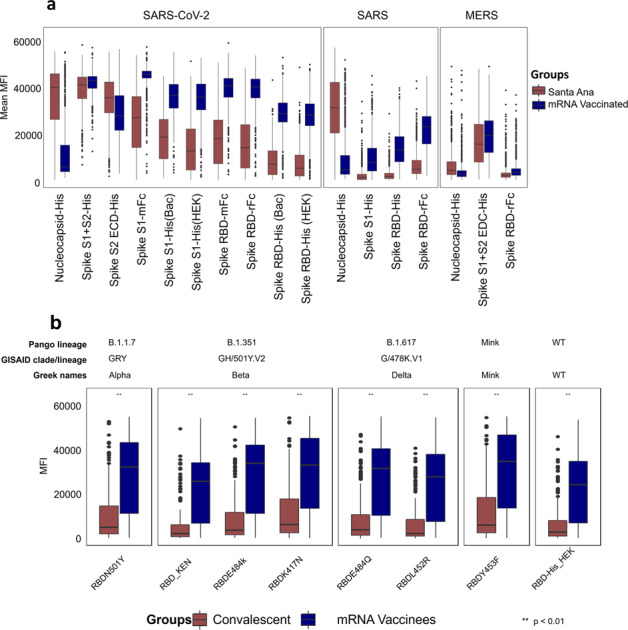
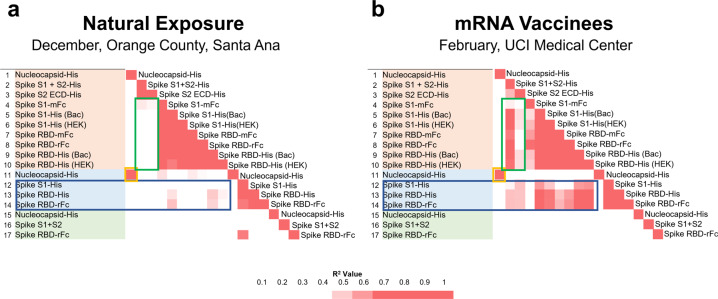
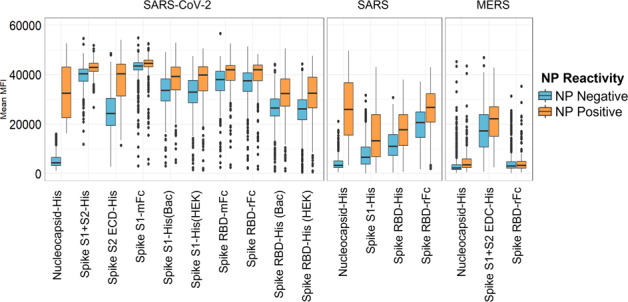
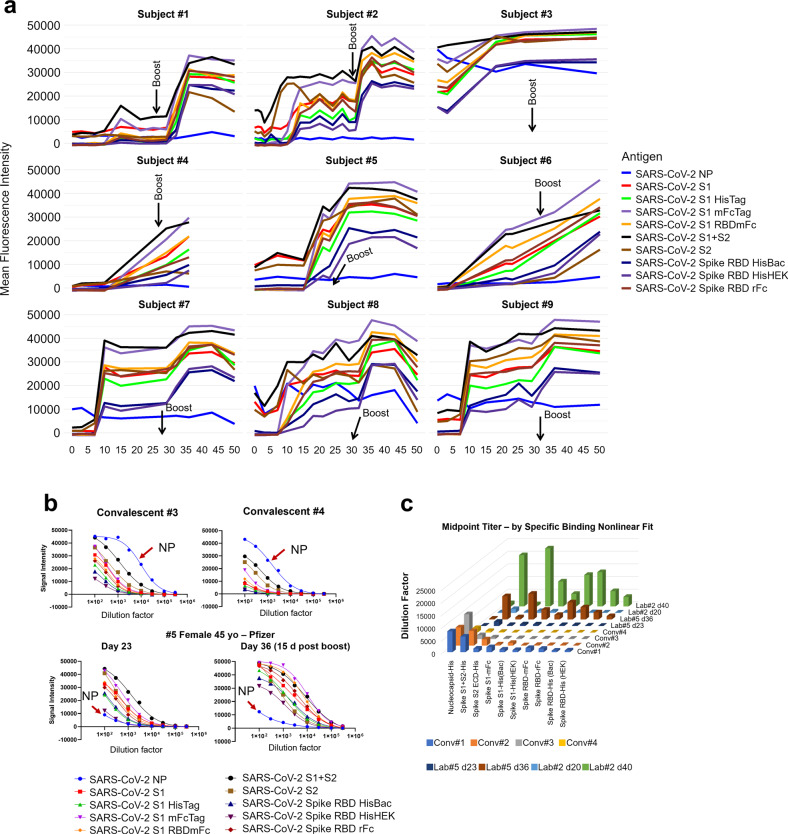
We analyzed data from two ongoing COVID-19 longitudinal serological surveys in Orange County, CA., between April 2020 and March 2021. A total of 8476 finger stick blood specimens were collected before and after a vaccination campaign. IgG levels were determined using a multiplex antigen microarray containing antigens from SARS-CoV-2, SARS, MERS, Common CoV, and Influenza. Twenty-six percent of specimens from unvaccinated Orange County residents in December 2020 were SARS-CoV-2 seropositive; out of 852 seropositive individuals 77 had symptoms and 9 sought medical care. The antibody response was predominantly against nucleocapsid (NP), full length, and S2 domain of spike. Anti-receptor binding domain (RBD) reactivity was low and not cross-reactive against SARS S1 or SARS RBD. A vaccination campaign at the University of California Irvine Medical Center (UCIMC) started on December, 2020 and 6724 healthcare workers were vaccinated within 3 weeks. Seroprevalence increased from 13% pre-vaccination to 79% post-vaccination in January, 93% in February, and 99% in March. mRNA vaccination induced higher antibody levels than natural exposure, especially against the RBD domain and cross-reactivity against SARS RBD and S1 was observed. Nucleocapsid protein antibodies can be used to distinguish vaccinees to classify pre-exposure to SARS-CoV-2 Previously infected individuals developed higher antibody titers to the vaccine than non pre-exposed individuals. Hospitalized patients in intensive care with severe disease reach significantly higher antibody levels than mild cases, but lower antibody levels compared to the vaccine. These results indicate that mRNA vaccination rapidly induces a much stronger and broader antibody response than SARS-CoV-2 infection.


Conflict of interest statement

The coronavirus antigen microarray is intellectual property of the Regents of the University of California that is licensed for commercialization to Nanommune Inc. (Irvine, CA), a private company for which Philip L. Felgner is the largest shareholder and several co-authors (de Assis, Jain, Nakajima, Jasinskas, Davies, and Khan) also own shares. Nanommune Inc. has a business partnership with Sino Biological Inc. (Beijing, China) which expressed and purified the antigens used in this study. The other authors have no competing interests.

Figures

Fig. 1
Fig. 1. Coronavirus antigen microarray—COVAM.
The content of the coronavirus antigen microarray is shown. There are 10 SARS-CoV-2 antigens, 3 SARS, 3 MERS, 12 Common COV, and 8 influenza antigens. Each antigen is printed in triplicate and organized as shown on the images with Orange boxes around the SARS-CoV-2 antigens, Blue SARS, Green MERS, Yellow Common CoV, and Purple for Influenza. Three different samples are shown, a negative Pre-CoV, natural infection (actOC), and a sample from an mRNA vaccinee (HCW). The Pre-CoV sample has negligible reactivities to SARS-CoV-2, SARS, and MERS, whereas natural infection and the vaccinees have significant antibodies against the novel CoV. The red-white arrows point to the nucleocapsid protein which detects antibodies in naturally exposed people but not in the vaccinees.
Fig. 2
Fig. 2. Coronavirus seroprevalence of Naturally exposed and Vaccinated populations.
a Finger stick blood specimens were collected from Orange County in July (2979 specimens) and Santa Ana in December (3347 specimens), and seroprevalence measured on the COVAM array. b Seroprevalence in cross-sections from the UCI Medical Center was measured by COVAM analysis in May and December before the start of the mRNA vaccination campaign on December 16, 2020 and monthly post vaccination time points in 2021. The gray bar is the COVAM seroprevalence prediction and the blue bar is the nucleocapsid protein seropositivity. The graph shows the increase in reactivity to Spike-RBD in relation to the nucleoprotein in the vaccination population reaching a seropositivity of 99% as opposed to 23% (for the NP). For the Santa Ana population, an increase in seroprevalence was observed, but no differential increase for Spike-RBD was observed.
Fig. 3
Fig. 3. Antibody reactivity of the Santa Ana and health care workers groups.
The heat maps show all of the IgG reactivity data from 3347 pre-vaccination specimens collected from Santa Ana in December 2020 (a), and 907 post-vaccination specimens collected from the UCIMC in February (b). The 37 antigens are in rows and the specimens are in 3347 columns for (a) and 907 columns for (b). The level of antibody measured in each specimen against each antigen is recorded as mean fluorescence intensity (MFI) according to the graduated scale from 0 to 60,000. Red is a high level, white a low level and black is in between. a Samples are classified as either SARS-CoV-2 seropositive clustered to the left (orange bar) or seronegative and clustered to the right (blue bar). Seropositive specimens recognize nucleoprotein and full-length spike. RBD segments are recognized less well. b Reactivity of specimens from 907 UCIMC HCW, 94% were vaccinated and seropositive. The heatmap shows that seropositive vaccinees in the HCW cohort can be classified into two groups, either seropositive for nucleoprotein or not, whereas the naturally exposed population (a) is uniformly seropositive for both nucleoprotein and full-length spike. c Principal component analysis of the protein microarray data in this study. The specimens fall into 4 distinct groups based on their reactivity against 10 SARS-CoV-2 antigens. Naturally exposed individual separate from unexposed naives, the naturally exposed separate from the vaccinees, and the vaccinees separate into 2 groups depending on whether they are seropositive for NP or not.
Fig. 4
Fig. 4. Natural exposure vs mRNA vaccination antibody reactivity.
Mean MFI signals for each of the novel coronavirus antigens in the natural exposure cohort from Santa Ana in December 2020 in brown and the February/March 2021 vaccination group (in blue) are plotted. The boxes represent the first quartile, median, and, third quartile and the whiskers extend 1.5 times the interquartile range (IQR). Wilcoxon test was performed for pairwise comparisons and p values lower than 0.01 were considered significant and represented as **. Panel a shows that antibody responses against Spike RBD variants are significantly elevated in mRNA vaccinated people compared to naturally exposed individuals. The b shows that antibody responses against RBD variants from the Coronavirus Pango Lineages B1.1.7, B.1.351, B.1.617, Minkvariant, and the Wild Type. In blue, are individuals that were immunized with a SARS-CoV-2 vaccine based on an adenovirus vector and in brown, convalescent individuals. As shown, mRNA vaccinees display a stronger reactivity to all variants when compared to the other two groups.
Fig. 5
Fig. 5. COVAM pairwise correlation matrices.
Correlation matrices with all pairwise comparisons between all antigens on the COVAM array were generated. The heatmaps represent a color scale of the r-squared of each pairwise comparison. On a is shown the correlation matrix for the Orange County group (actOC Natural exposure) and in b is shown the UCIMC vaccinated group. The mRNA vaccine induces cross reactive antibodies against SARS S1 and the RBDs (b, Blue Box) and natural exposure does not (a) Similarly, vaccine induced antibodies against full length spike cross-react with SARS-CoV-2 RBD (b, Green Box) and the natural exposure does not (a).
Fig. 6
Fig. 6. COVAM antibody reactivity of SARS-CoV-2 nucleoprotein seropositive vs seronegative specimens.
The boxes represent the first quartile, median and third quartile, and the whiskers extend 1.5 times the interquartile range (IQR). Unlike the natural exposure group that reacts uniformly to both nucleoprotein and full-length spike, vaccinees can be separated into two distinct groups, those who react to NP and those who do not. Natural exposure induces a dominant antibody response against the nucleocapsid protein (NP), but since NP is not in the vaccine, there is no vaccine induced response against it. In this way vaccinated people who had a prior natural exposure can be classified because they have antibodies to NP. Vaccinated people who were never previously exposed lack antibodies against NP. This data further supports the directive that people who are previously exposed will benefit by getting a boost against RBD.
Fig. 7
Fig. 7. Longitudinal analysis pre and post-mRNA vaccination.
a Longitudinal specimens taken at weekly intervals from 9 individuals pre- and post-mRNA vaccination. Individuals differ substantially in their response to the prime. Five individuals had low baseline NP reactivity that did not change post-vaccination. Four individuals had elevated NP reactivity at baseline which also did not change significantly post-vaccination; subject #3 was a recovered confirmed COVID case. In this small group, higher baseline NP predicts a higher response after the prime. These results support a directive to get the boost in order to achieve more uniform protection within a population of individuals. b Convalescent plasmas from 2 recovered COVID cases, and pre- and post-boost specimens from Subject #5 were titered and the titration curves are shown. The curves are generated by making 8 half log serial dilutions of the plasmas before probing 8 separate COVAM arrays. These curves highlight the observation that high titers against NP are present in convalescent plasma that are lacking in the vaccinees. (red arrow). c The midpoint titers of 10 SARS-CoV-2 antigens from 4 convalescent plasmas and plasmas from 2 vaccinees after the prime and after the boost are plotted Convalescent plasmas vary in their titers against NP and full-length spike. The vaccinees lack antibody against NP and have significantly higher titers after the boost against all of the spike antigens compared to convalescent plasma.

Similar articles

Cited by

References

    1. Polack FP, et al. Safety and efficacy of the BNT162b2 mRNA Covid-19 vaccine. N. Engl. J. Med. 2020;383:2603–2615. doi: 10.1056/NEJMoa2034577. - DOI - PMC - PubMed
    1. Baden LR, et al. Efficacy and safety of the mRNA-1273 SARS-CoV-2 vaccine. N. Engl. J. Med. 2021;384:403–416. doi: 10.1056/NEJMoa2035389. - DOI - PMC - PubMed
    1. Zhao J, et al. Antibody responses to SARS-CoV-2 in patients with novel coronavirus disease 2019. Clin. Infect. Dis. 2020;71:2027–2034. doi: 10.1093/cid/ciaa344. - DOI - PMC - PubMed
    1. Kellam P, Barclay W. The dynamics of humoral immune responses following SARS-CoV-2 infection and the potential for reinfection. J. Gen. Virol. 2020;101:791–797. doi: 10.1099/jgv.0.001439. - DOI - PMC - PubMed
    1. Khan, S. et al. Use of an influenza antigen microarray to measure the breadth of serum antibodies across virus subtypes. J. Vis. Exp.10.3791/59973 (2019). - PMC - PubMed