. 2021 Nov 4;12(1):6403.
doi: 10.1038/s41467-021-26723-9.

A Brainstem reticulotegmental neural ensemble drives acoustic startle reflexes

Affiliations

A Brainstem reticulotegmental neural ensemble drives acoustic startle reflexes

Weiwei Guo et al. Nat Commun. .

Abstract

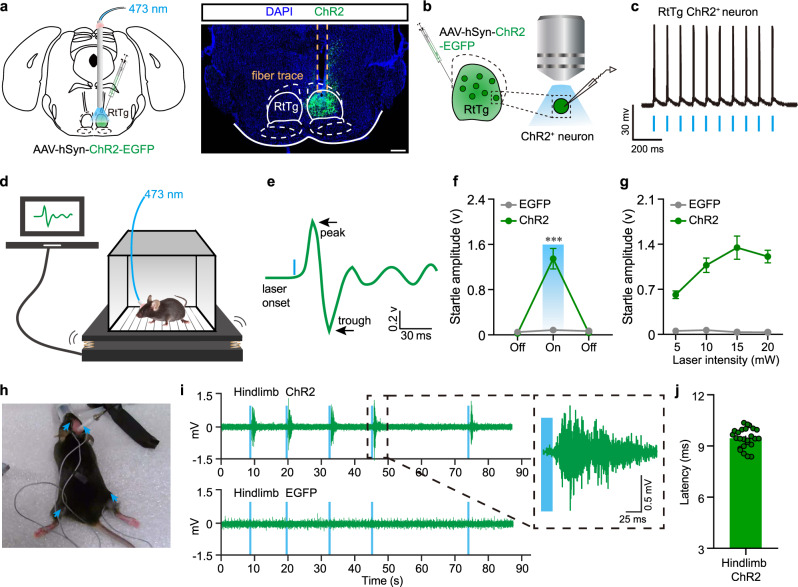
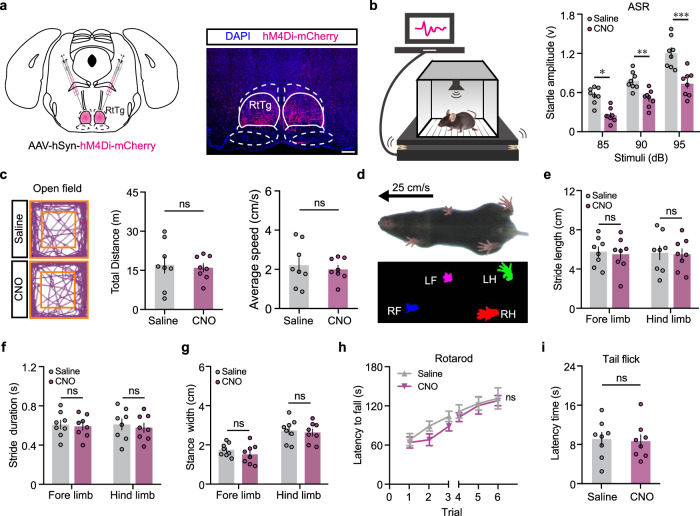
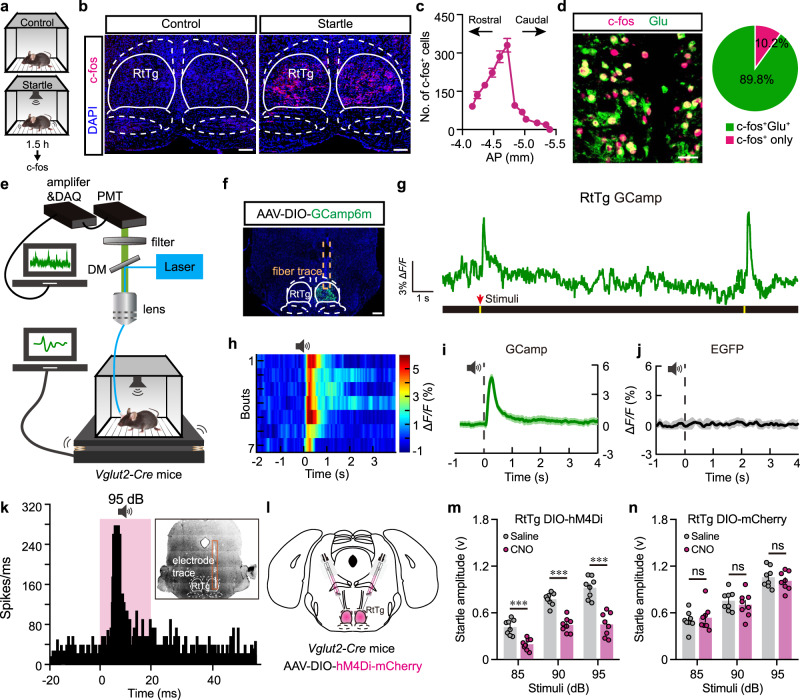
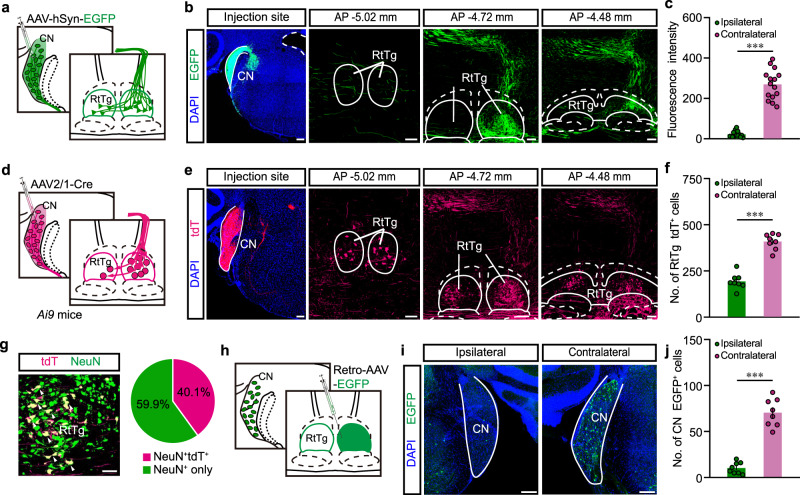
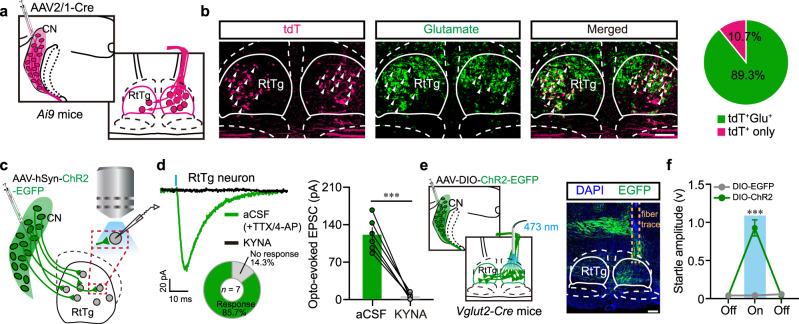
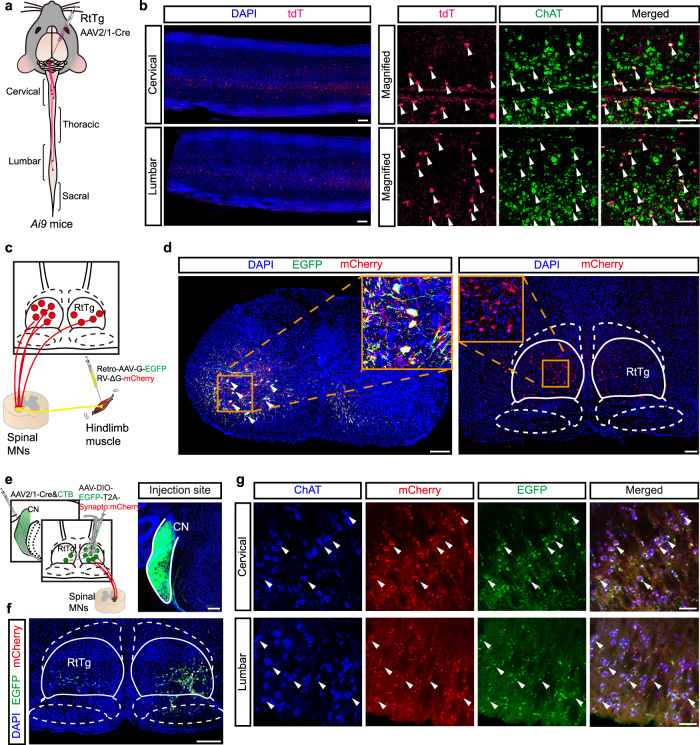
The reticulotegmental nucleus (RtTg) has long been recognized as a crucial component of brainstem reticular formation (RF). However, the function of RtTg and its related circuits remain elusive. Here, we report a role of the RtTg in startle reflex, a highly conserved innate defensive behaviour. Optogenetic activation of RtTg neurons evokes robust startle responses in mice. The glutamatergic neurons in the RtTg are significantly activated during acoustic startle reflexes (ASR). Chemogenetic inhibition of the RtTg glutamatergic neurons decreases the ASR amplitudes. Viral tracing reveals an ASR neural circuit that the cochlear nucleus carrying auditory information sends direct excitatory innervations to the RtTg glutamatergic neurons, which in turn project to spinal motor neurons. Together, our findings describe a functional role of RtTg and its related neural circuit in startle reflexes, and demonstrate how the RF connects auditory system with motor functions.


Conflict of interest statement

The authors declare no competing interests.

Figures

Fig. 1
Fig. 1. Optogenetic activation of RtTg leads to stereotypical startle behaviour.
a Left: schematic for optogenetic activation of the RtTg. Right: a representative image confirming ChR2-EGFP expression in the RtTg, and the optical fiber trace. Scale bar, 400 μm. b Schematic for the optogenetic activation and the simultaneous whole-cell patch-clamp recording of RtTg EGFP+ neurons in the RtTg brain slice of mice receiving an intra-RtTg injection of the AAV-hSyn-ChR2-EGFP. c Sample traces showing the photostimulation (blue bars, 1 ms)-evoked action potentials in RtTg EGFP+ neurons. d Schematic for the optogenetic activation of the RtTg and simultaneous detection of startle reflexes. e Startle amplitude was defined as the largest peak-to-peak response occurred within 200 ms after the onset of the laser stimulus. f Startle amplitudes evoked by opto-stimulation (blue bars) of the RtTg neurons expressing ChR2 or EGFP (n = 15 mice per group, two-sided unpaired t-tests, P = 5.78 × 10−6). g Startle amplitudes at different laser intensities in the ChR2 and EGFP group (n = 15 mice per group). h Representative image showing the experimental setup for EMG recording during optogenetic activation of RtTg neurons. Blue arrows indicate positions for electrode insertion. i Example of the entire and locally amplified EMG traces showing activities of mouse hindlimb muscles during optogenetic activation (blue bar) of RtTg neurons. j Quantification of latency for hindlimb muscle EMG activities after optogenetic activation of the RtTg (n = 5 mice, 25 bouts in total). Error bar represent mean ± s.e.m. ***P < 0.001.
Fig. 2
Fig. 2. Behavioural consequences of RtTg inactivation.
a Left: schematic for chemogenetic inactivation of RtTg neurons. Right: a representative image confirming hM4Di-mCherry expression. Scale bar, 300 μm. b Left: schematic for the ASR paradigm. Right: quantitative graph showing the effect of RtTg inactivation on ASR amplitudes (n = 8 per group; t = 2.417, P = 0.02 (85 dB); t = 3.429, P = 0.0014 (90 dB); t = 5.976, P = 4.3 × 10−7 (95 dB)). c Left: representative movement tracks of hM4Di-infected mice after i.p. injection of saline or CNO. Quantification of total distances (middle, n = 8 per group; P = 0.7637) and average speed (right, n = 8 per group; P = 0.6411) during open field test. d Representative images showing a mouse walking on treadmill and paw prints detected from a video settled under the treadmill. eg Digi Gait analysis for hM4Di infected mice after i.p. injection of saline or CNO (n = 8 per group; for e: t = 0.2945, P = 0.7705 (fore limb); t = 0.1914, P = 0.8496 (hindlimb); for f: t = 0.2689, P = 0.7899 (fore limb); t = 0.4781, P = 0.6363 (hindlimb); for g: t = 0.9117, P = 0.3697 (fore limb); t = 0.4126, P = 0.6831 (hindlimb)). h Latency to fall on accelerating rotarod of hM4Di-infected mice after i.p. injection of saline or CNO (n = 8 per group; F = 0.2, P = 0.9346). i Tail-flick latency of hM4Di-infected mice after i.p. injection of saline or CNO (n = 8 per group, P = 0.8269). Error bar represent mean ± s.e.m. Significance was assessed using two-sided unpaired t-tests in c,i, and two-way ANOVA combining with FDR corrections in b, eh. * P < 0.05; ** P < 0.01; *** P < 0.001; ns, not significant.
Fig. 3
Fig. 3. RtTg glutamatergic neurons mediates ASR.
a Schematic of ASR c-fos experiment. b Representative images showing control and 95 dB acoustic stimuli-induced c-fos expression in the RtTg. Scale bar, 200 μm. c Quantification of the c-fos+ cell number in consecutive RtTg sections (n = 6 mice). AP, distance anterior or posterior to Bregma. d Left: a representative image showing RtTg c-fos+ cells co-labelled with glutamate. Scale bar, 50 μm. Right: pie chart indicating the percentage of c-fos+ neurons co-labelled with or without glutamate. e Schematic of fiber photometry setup. f A representative image confirming GCamp6m expression in the RtTg. Scale bar, 400 μm. g, h Representative traces (g) and heat map (h) of calcium signal changes of RtTg glutamatergic neurons aligned to the acoustic stimuli onset. i, j Quantifications of calcium (i, n = 35 bouts from 5 mice) and EGFP (j, n = 25 bouts from 5 mice) signal changes of RtTg glutamatergic neurons aligned to the acoustic stimuli onset. The thick line indicates the mean and the area shaded in lighter color indicates s.e.m. k The average peristimulus time histogram showing RtTg neuronal activities evoked by acoustic stimulus. l Schematic for chemogenetic inhibition of glutamatergic neurons in the RtTg of Vglut2-Cre mice. m, n ASR amplitudes of Vglut2-Cre mice receiving bilateral injection of AAV-DIO-hM4Di-mCherry (m) or control AAV-DIO-mCherry (n) into the RtTg, followed by i.p. administration of CNO or saline (n = 8 per group; for m: t = 4.026, P = 0.0002 (85 dB); t = 6.049, P = 3.38 × 10−7 (90 dB); t = 8.626, P = 7.63 × 10−11 (95 dB); for n: t = 0.4851, P = 0.6301 (85 dB); t = 0.7525, P = 0.4559 (90 dB); t = 0.6869, P = 0.4959 (95 dB)). All data are presented as the mean ± s.e.m. Significance was assessed using two-way ANOVA combining with FDR corrections. *** P < 0.001; ns, not significant.
Fig. 4
Fig. 4. Identification of a CN-RtTg direct projection.
a Schematic for the anterograde tracing from CN to RtTg. b Representative images showing CN injection site and EGFP+ presynaptic terminals in RtTg. Scale bar, 200 μm. c Quantitative fluorescence intensity of CN EGFP+ presynaptic terminals in the ipsilateral and contralateral RtTg (n = 15; P = 8.87 × 10−9). d Schematic for the anterograde transsynaptic tracing from CN to RtTg. e Representative images showing CN injection site and the tdT+ cells in RtTg. Scale bar, 200 μm. f Quantification of tdT+ cell numbers in the ipsilateral and contralateral RtTg (n = 8; P = 3.8 × 10−7). g Left: a representative image showing tdT+ RtTg neurons co-labelled with NeuN (white arrowheads). Scale bar, 50 μm. Right: pie chart indicating the percentage of NeuN+ neurons co-labelled with or without tdT. h Schematic for the retrograde tracing from RtTg to CN. i Representative images showing EGFP+ neurons in ipsilateral and contralateral CN. Scale bar, 200 μm. j Quantification of EGFP+ cells number in the ipsilateral and contralateral CN (n = 8; P = 5.09 × 10−6). Error bar represents mean ± s.e.m. Significance was assessed using two-sided paired t-tests in c, f, j. ***P < 0.001.
Fig. 5
Fig. 5. The CN sends monosynaptic glutamatergic projections to RtTg glutamatergic neurons.
a Schematic for the anterograde tracing from CN to RtTg. b Left: representative images showing RtTg tdT+ neurons co-labelled with glutamate (white arrowheads). Scale bar, 300 μm. Right: pie chart indicating the percentage of RtTg tdT+ neurons co-labelled with or without glutamate. c Schematic for the optogenetic activation of CN neuronal terminals and the simultaneous whole-cell patch clamp recording of RtTg neurons. d Sample traces (left) and quantitative analysis (right) for EPSCs of RtTg neurons evoked by photostimulation (blue bar, 1 ms) before and after bath application of KYNA. TTX and 4-AP were added into aCSF (n = 6 cells from 4 mice; P = 0.0003). The doughnut chart shows the percentage of RtTg neurons responsive or not responsive to the photostimulation. e Left: schematic for the optogenetic activation of CN glutamatergic neuron terminals in the RtTg. Right: a representative image showing EGFP+ terminals in the RtTg. Scale bar, 300 μm. f Startle amplitudes evoked by photostimulation of ChR2+ terminals or EGFP+ terminals in the RtTg of Vglut2-Cre mice (n = 15 stimuli from 5 mice per group; P = 7.76 × 10−7). Error bar represents mean ± s.e.m. Significance was assessed using two-sided paired t-tests in d, and two-sided unpaired t-tests in f. *** P < 0.001; ns, not significant.
Fig. 6
Fig. 6. Viral tracing of the CN-RtTg-MNs circuit.
a Schematic for the AAV2/1-Cre-based anterograde transsynaptic tracing from the RtTg to multiple spinal cord segments. b Representative images showing the tdT+ neuron labelling in transverse sections of spinal cervical and lumbar segments, and the co-labelling of tdT with ChAT (white arrowheads). Scale bar, 100 μm. c Schematic for rabies virus-based retrograde monosynaptic tracing from hindlimb muscles to the RtTg. d Representative images showing EGFP+mCherry+ spinal starter MNs (left) and mCherry+ neurons in the RtTg (right). Scale bar, 200 μm. e Left: schematic for the multilevel anterograde tracing from the CN to the spinal cord by injecting AAV2/1-Cre (mixed with CTB to visualize injection site) into the CN, followed by the injection of AAV-DIO-EGFP-T2A-Synaptophysin:mCherry into the contralateral RtTg. Right: a representative image showing CN injection site. Scale bar, 200 μm. f A representative image showing Cre-dependent expression of EGFP in RtTg neuron cytosol. Scale bar, 300 μm. g Representative images showing co-existence (white arrowheads) of the mCherry+ presynaptic puncta of RtTg neurons and the spinal cervical segment ChAT+ MNs. Scale bar, 200 μm (Cervical, Lumbar) and 5  μm (Merged).

Similar articles

Cited by

References

    1. Mangold, S. A. & M Das, J. Neuroanatomy, Reticular Formation. StatPearls. (2020). - PubMed
    1. French JD. The reticular formation; the nature of the reticular activating system. J. Neurosurg. 1958;15:97–115. doi: 10.3171/jns.1958.15.1.0097. - DOI - PubMed
    1. Krone L, et al. Top-down control of arousal and sleep: fundamentals and clinical implications. Sleep. Med Rev. 2017;31:17–24. doi: 10.1016/j.smrv.2015.12.005. - DOI - PubMed
    1. Garcia-Rill E. Disorders of the reticular activating system. Med Hypotheses. 1997;49:379–387. doi: 10.1016/S0306-9877(97)90083-9. - DOI - PubMed
    1. Jang SH, Chang CH, Jung YJ, Kim JH, Kwon YH. Relationship between impaired consciousness and injury of ascending reticular activating system in patients with intracerebral hemorrhage. Stroke. 2019;50:2234–2237. doi: 10.1161/STROKEAHA.118.023710. - DOI - PubMed

Publication types