. 2021 Nov 3;8(11):211067.
doi: 10.1098/rsos.211067. eCollection 2021 Nov.

Immunofluorescence-guided segmentation of three-dimensional features in micro-computed tomography datasets of human lung tissue

Affiliations

Immunofluorescence-guided segmentation of three-dimensional features in micro-computed tomography datasets of human lung tissue

Matthew J Lawson et al. R Soc Open Sci. .

Abstract

Micro-computed tomography (µCT) provides non-destructive three-dimensional (3D) imaging of soft tissue microstructures. Specific features in µCT images can be identified using correlated two-dimensional (2D) histology images allowing manual segmentation. However, this is very time-consuming and requires specialist knowledge of the tissue and imaging modalities involved. Using a custom-designed µCT system optimized for imaging unstained formalin-fixed paraffin-embedded soft tissues, we imaged human lung tissue at isotropic voxel sizes less than 10 µm. Tissue sections were stained with haematoxylin and eosin or cytokeratin 18 in columnar airway epithelial cells using immunofluorescence (IF), as an exemplar of this workflow. Novel utilization of tissue autofluorescence allowed automatic alignment of 2D microscopy images to the 3D µCT data using scripted co-registration and automated image warping algorithms. Warped IF images, which were accurately aligned with the µCT datasets, allowed 3D segmentation of immunoreactive tissue microstructures in the human lung. Blood vessels were segmented semi-automatically using the co-registered µCT datasets. Correlating 2D IF and 3D µCT data enables accurate identification, localization and segmentation of features in fixed soft lung tissue. Our novel correlative imaging workflow provides faster and more automated 3D segmentation of µCT datasets. This is applicable to the huge range of formalin-fixed paraffin-embedded tissues held in biobanks and archives.

Keywords: SIFT; blood vessel networks; correlative imaging; histology; registration; warping.


Figures

Figure 1.
Figure 1.
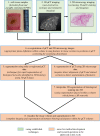
Summary of the proposed correlative imaging workflow highlighting the research question addressed in this work. Steps highlighted in green have been previously published. The proposed steps highlighted in orange were identified as areas for the development of greater automation. 1: Soft tissue sample preparation via FFPE. 2: Imaging of lung tissue at a high resolution in 3D using µCT. 3: Sectioning of tissue and employing traditional 2D histological imaging techniques to identify specific features not visible in µCT imaging. 4: The first step to address by co-registering the data from steps 2 and 3. 5: Segmentation of 3D networks using the µCT volume while avoiding manual segmentation. 6: Localization of specific features identified by 2D histology within µCT without manual segmentation. 7: Building non-isotropic segmentation of section staining into 3D isotropic data. 8: Visualizing the results of the previous steps together in 3D.
Figure 2.
Figure 2.
Reconstructed µCT data in 2D and 3D of FFPE human lung tissue sample. (a) Reconstructed µCT slice in the xy-plane of the µCT volume. Examples of key features of the lung tissue are labelled: airways (blue *), blood vessels (red *), alveoli (purple *), pleural surface (pink *), masked air bubble artefacts (yellow *). (b) 3D volume rendering of the lung tissue volume in the xy-plane. (c) 3D volume rendering as in (b), in the orthogonal yz-plane. (ac) Voxel size of µCT scan, 8.5 µm; scale bars, 1 mm; tissue from patient 1.
Figure 3.
Figure 3.
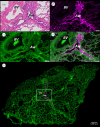
Bright-field histological (H&E) and IF staining of human lung tissue sections. (a) H&E staining of human lung tissue. (b) Ck18 IF staining of the airway epithelium captured at 650 nm, on a neighbouring section approximately 4 µm apart. (c) Tissue autofluorescence captured at 480 nm, focused on the same area of tissue as in (b). (d) Panels (b) and (c) combined showing the IF channel overlaid on the autofluorescence channel. (e) Wide-field microscopy image of whole tissue section comprising the regions of interest shown in (bd) within the white box. (ae) Images were captured using a 10× objective on an Olympus VS110 slide scanning microscope (Olympus, JP). Airways (Aw) and blood vessels (BV) are labelled. (ad) Scale bar, 200 µm; (e) scale bar, 1 mm; tissue from patient 1.
Figure 4.
Figure 4.
Segmentation of the lung blood vessel network using ‘active contour segmentation’. (a) The three orthogonal CT planes as they appear after initiating the ‘active contour segmentation’ from a single seed point in ITK-SNAP. (bd) 3D rendering of the blood vessel network as more seed points are added in order to ‘grow’ the network. Yellow = 1 seed point, orange = 10 seed points, red = 40 seed points; voxel size of µCT scan, 8.5 µm; scale bar, 1 mm; tissue from patient 1.
Figure 5.
Figure 5.
Assessment of fluorescence and µCT image co-registration. Images illustrating feature match of tissue and airspaces of the original and warped autofluorescence section with the matching plane from the µCT dataset. (a) Original autofluorescence section (green) overlaid on corresponding µCT plane (grey). (b) Warped fluorescence section overlaid on corresponding µCT plane. Inaccurate (tissue–air) overlap shown in red, accurate overlap in cyan (airspace–airspace) or blue (tissue–tissue). (c) Original autofluorescence section (as in a). (d) Original autofluorescence section with manually defined warping. (e) Original autofluorescence section output from using the ‘automated warping script’. (ai–ei) Corresponding magnified images of areas in the regions of interest highlighted in (ac). (f) Bar-chart showing the percentage of pixels with accurate (cyan and blue combined) and inaccurate overlap (red) in (ac); for the automatically warped fluorescence images the mean ± s.d. is shown (n = 22 pairs of images). Voxel size of µCT scan, 8.5 µm; scale bars, 1 mm; tissue from patient 1.
Figure 6.
Figure 6.
Identification of the Ck18 positive staining in µCT data. Ck18 positive staining of the epithelium (blue) identified on six IF stained tissue sections which have been co-registered and segmented on the µCT slices down through the lung volume. The staining location within the tissue was taken directly from the IF images, like those displayed in figure 2. Ck18 positive areas are not present in the blood vessels (red *). These panels follow the airway over a depth of approximately 400 µm. Air bubbles artefacts (yellow *); voxel size of µCT scan, 8.5 µm; scale bars, 500 µm; tissue from patient 1.
Figure 7.
Figure 7.
Volume rendering of the 3D µCT data containing the segmentation results of the blood vessels and Ck18 staining. The µCT data (as shown in figure 2) were made semi-transparent and cropped into the physically sectioned volume in order to visualize the internal networks of Ck18 and blood vessels. In red, the complete blood vessel network from figure 3 is shown. The interpolated Ck18 staining is shown in blue, which has been generated from the combined results of IF imaging and co-registration shown in figures 4–6.
Figure 8.
Figure 8.
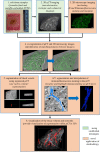
The main steps of the workflow presented in this report for automating registration and segmentation of biologically relevant features and cell types in 3D data provided by µCT. Steps highlighted in green used previously published techniques. Steps highlighted in orange were developed in this report for greater automation; these involved novel techniques or using existing techniques on new types of data. 1: Soft tissue sample preparation via FFPE. 2: Imaging of lung tissue at a high resolution (approx. 10 µm) with sufficient contrast to visualize the tissue in 3D. 3: Section tissue and perform IF staining to identify specific features not visible in µCT. 4: Automated co-registration of the specified 2D data from IF with the µCT. 5: Identify and extract the blood vessel networks from the co-registered µCT using ‘active contour segmentation’. 6: Localize specific immunoreactivity, provided by IF, within the µCT and use these data for automated segmentation. 7: Digital interpolation used to ‘fill the gaps’ to produce 3D segmentation. 8: Bring the µCT, blood vessels and registered IF segmentation together in order to localize specific networks and features within the 3D tissue volume.

References

    1. Elliott JC, Dover S. 1982. X-ray microtomography. J. Microsc. 126, 211-213. - PubMed
    1. Katsamenis OL, et al. 2019. X-ray micro-computed tomography for non-destructive 3D X-ray histology. Am. J. Pathol. 189, 1608-1620. (10.1016/j.ajpath.2019.05.004) - DOI - PMC - PubMed
    1. de Bournonville S, Vangrunderbeeck S, Kerckhofs G. 2019. Contrast-enhanced MicroCT for virtual 3D anatomical pathology of biological tissues: a literature review. Contrast Media Mol. Imaging 2019, 8617406. (10.1155/2019/8617406) - DOI - PMC - PubMed
    1. Metscher B. 2020. A simple nuclear contrast staining method for MicroCT-based 3D histology using lead(II) acetate. BioRxiv, 2020.2009.2018.303024. (10.1101/2020.09.18.303024) - DOI
    1. Robinson SK, Ramsden JJ, Warner J, Lackie PM, Roose T. 2019. Correlative 3D imaging and microfluidic modelling of human pulmonary lymphatics using immunohistochemistry and high-resolution μCT. Sci. Rep. 9, 6415. (10.1038/s41598-019-42794-7) - DOI - PMC - PubMed

LinkOut - more resources