

Fascin-1 and its role as a serological marker in prostate cancer: a prospective case-control study
- PMID: 34737886
- PMCID: PMC8558850
- DOI: 10.2144/fsoa-2021-0051
Fascin-1 and its role as a serological marker in prostate cancer: a prospective case-control study
Abstract
Aim: This study aims to investigate any modification of serological FSCN1 in prostate cancer patients compared with patients without neoplasia.
Material & methods: Clinical data and blood specimens from patients with and without prostate cancer were obtained. A quantitative sandwich ELISA method was used to determine serological values of FSCN1.
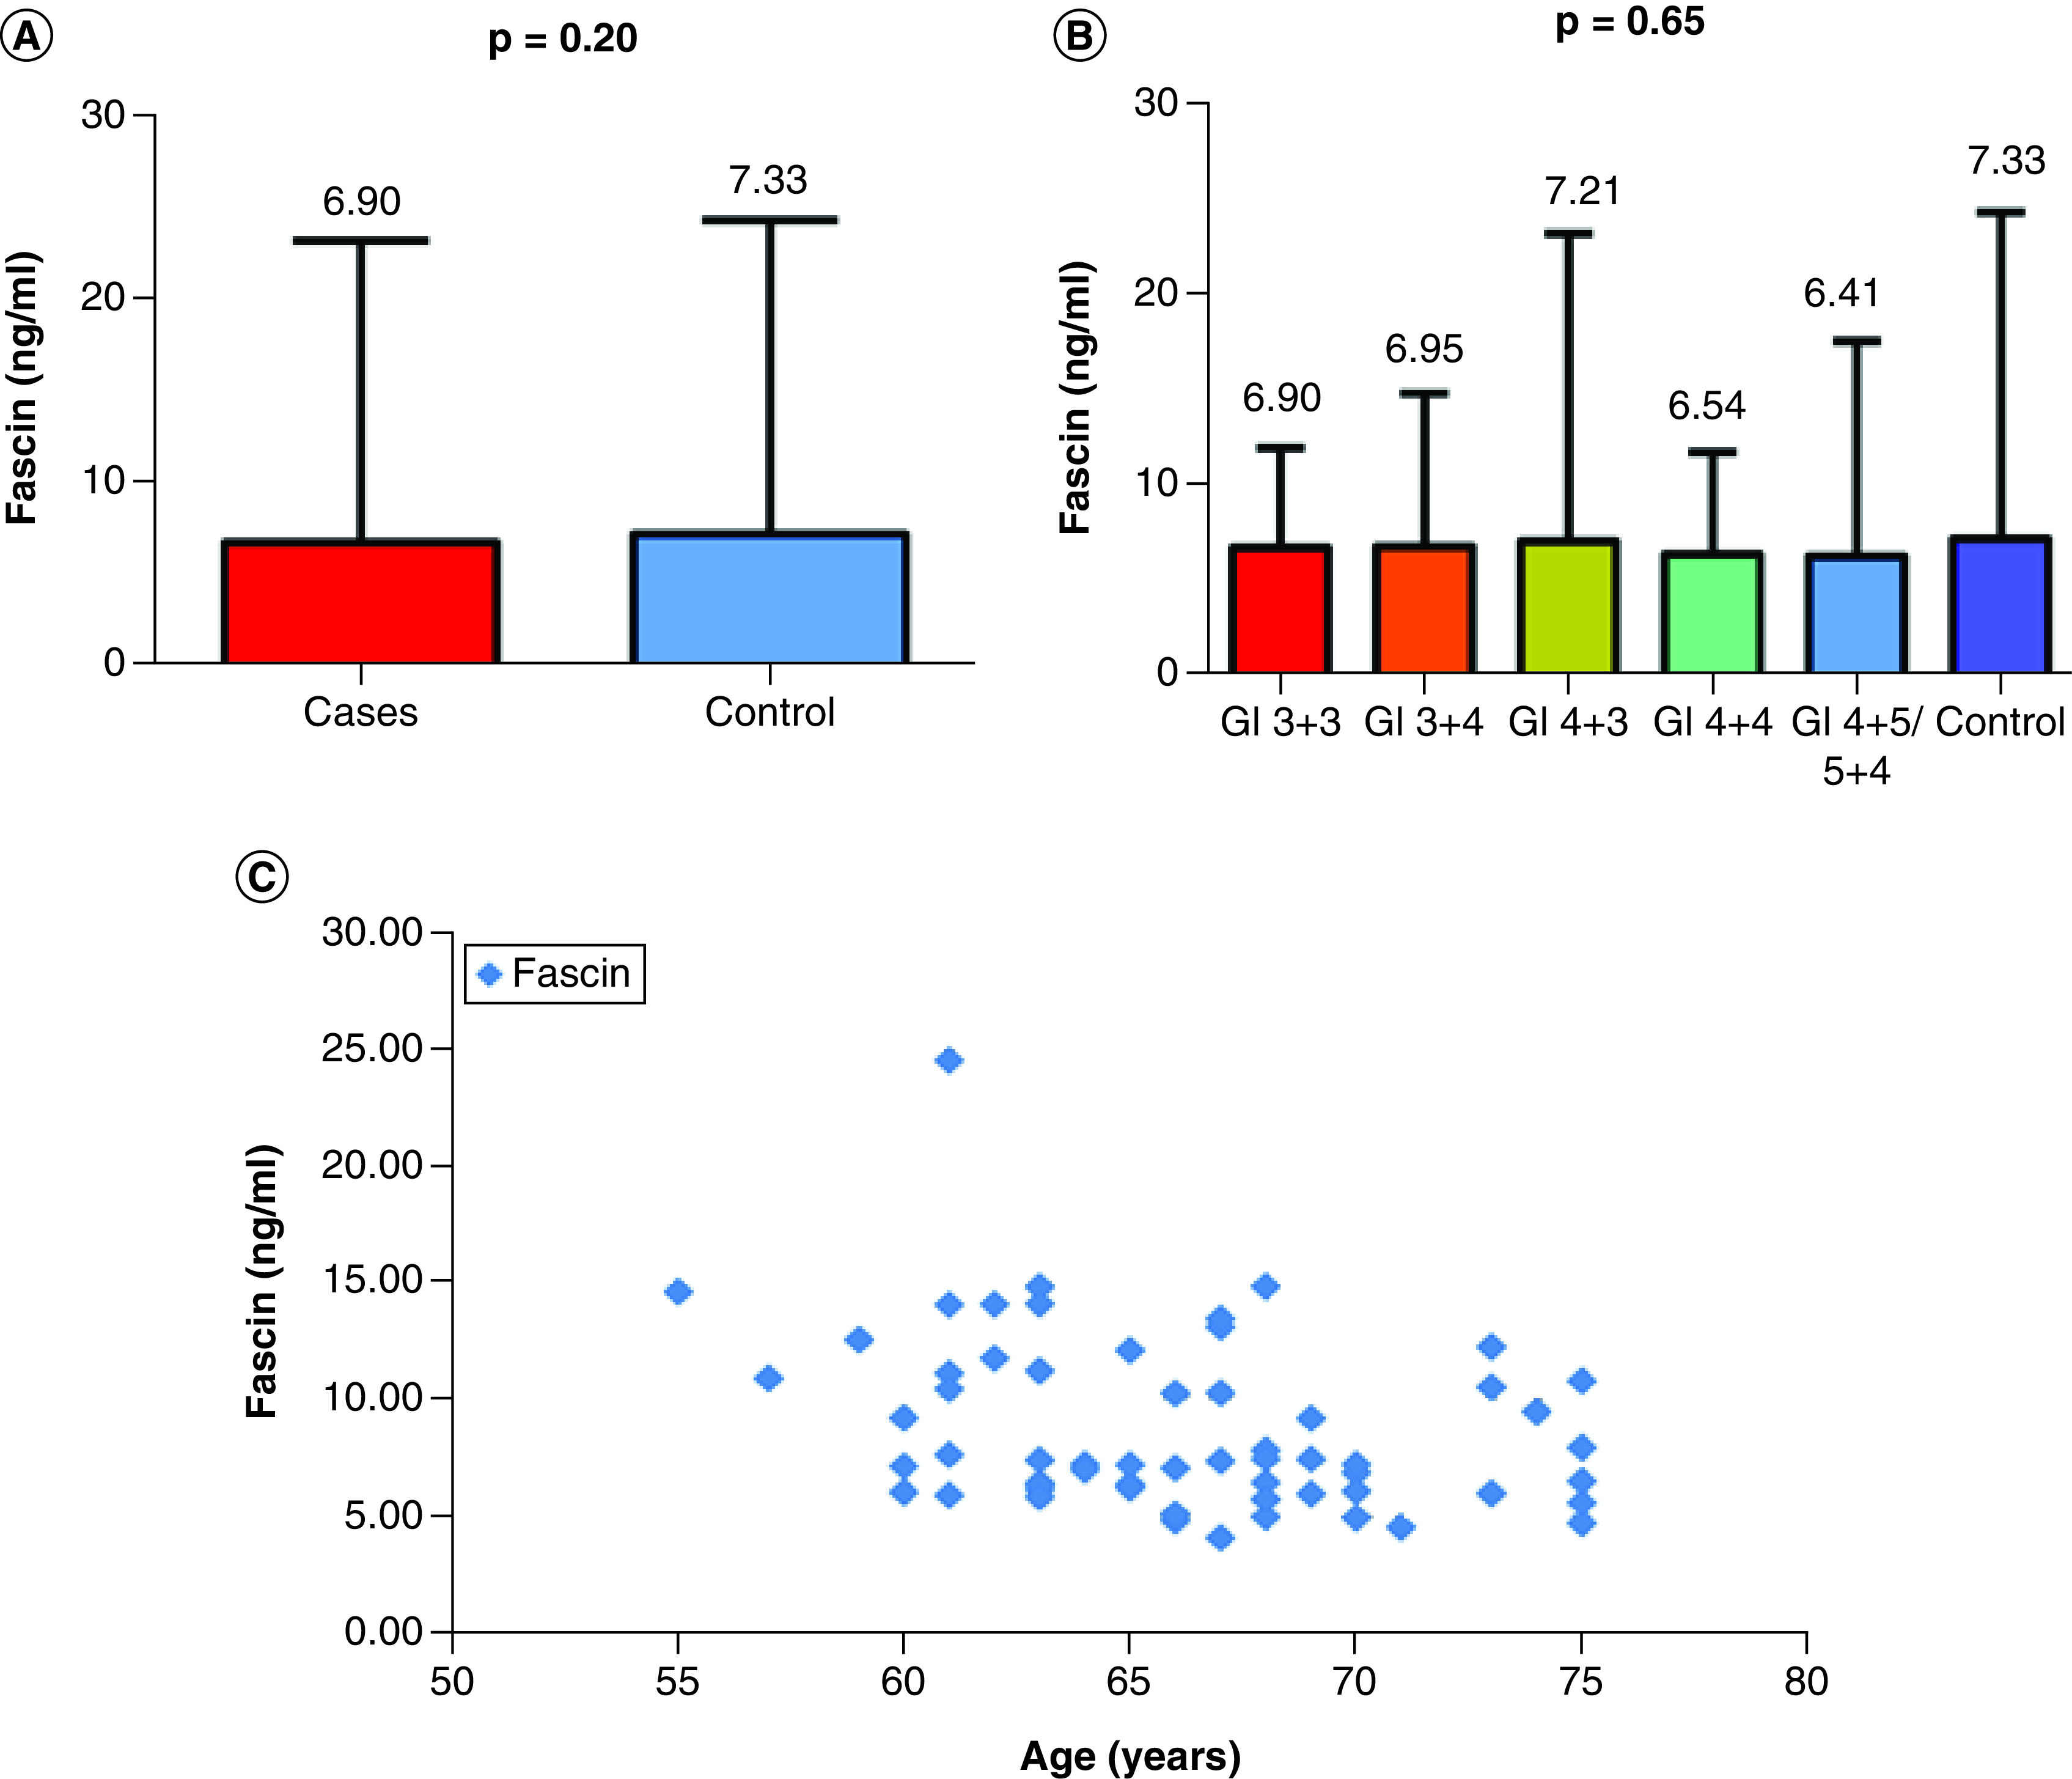
Results: Although serum values of FSCN1 were dissimilar in the two cohorts of patients (6.90 vs 7.33 ng/ml), the difference was not statistically significant (p = 0.20). Serum values of FSCN1 stratified for Gleason score groups were not significantly distinguishable (p = 0.65). A negative correlation (rho = -0.331; p = 0.009) was reported between FSCN1 and age.
Conclusion: Further studies are required to evaluate a possible diagnostic role of FSCN1 in prostate cancer.
Keywords: Fascin-1; biomarker; fascin actin-bundling protein 1; prostate cancer; serum.
© 2021 The Authors.
Conflict of interest statement
Financial & competing interests disclosure This report was supported by George Emil Palade University of Medicine, Pharmacy, Science and Technology of Targu Mures, Romania, with funds from an internal competition. ‘Fascin an eventual new biomarker in prostate cancer’, is specified with a reference number (9/17800 of 22 December 2015). C Buonerba is a member of the Future Science OA Editorial Board. They were not involved in any editorial decisions related to the publication of this article, and all author details were blinded to the article’s peer reviewers as per the journal’s double-blind peer review policy. The authors have no other relevant affiliations or financial involvement with any organization or entity with a financial interest in or financial conflict with the subject matter or materials discussed in the manuscript apart from those disclosed. No writing assistance was utilized in the production of this manuscript.
Figures

References
-
- Bray F, Ferlay J, Soerjomataram I, Siegel RL, Torre LA, Jemal A. Global cancer statistics 2018: GLOBOCAN estimates of incidence and mortality worldwide for 36 cancers in 185 countries. CA Cancer J. Clin. 68(6), 394–424 (2018). - PubMed
-
- Siegel RL, Miller KD, Fuchs HE, Jemal A. Cancer statistics, 2021. CA Cancer J. Clin. 71(1), 7–33 (2021). - PubMed
-
- Welch HG, Albertsen PC. Reconsidering prostate cancer mortality-the future of PSA screening. N. Engl. J. Med. 382(16), 1557–1563 (2020). - PubMed
LinkOut - more resources
Full Text Sources
Research Materials
Miscellaneous