. 2021 Sep:2:978-993.
doi: 10.1038/s43018-021-00237-1. Epub 2021 Aug 2.

Autophagy Inhibition by Targeting PIKfyve Potentiates Response to Immune Checkpoint Blockade in Prostate Cancer

Affiliations

Autophagy Inhibition by Targeting PIKfyve Potentiates Response to Immune Checkpoint Blockade in Prostate Cancer

Yuanyuan Qiao et al. Nat Cancer. 2021 Sep.

Abstract

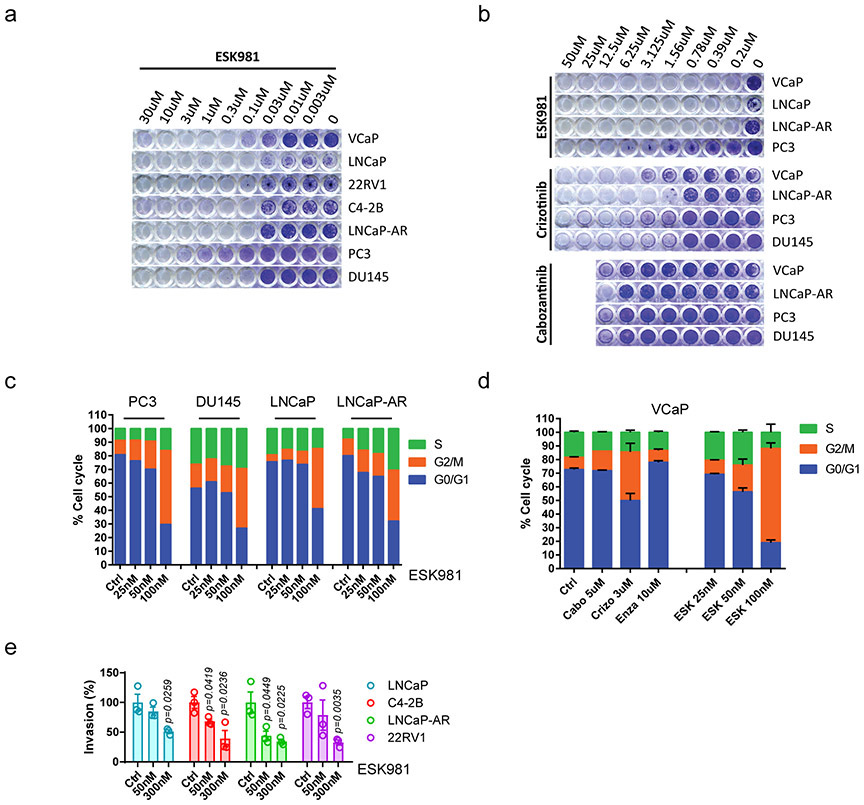
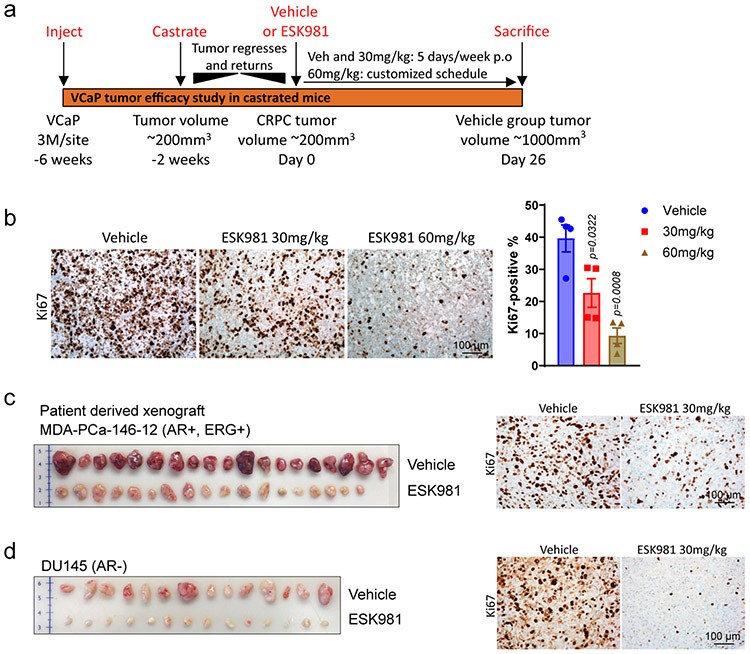
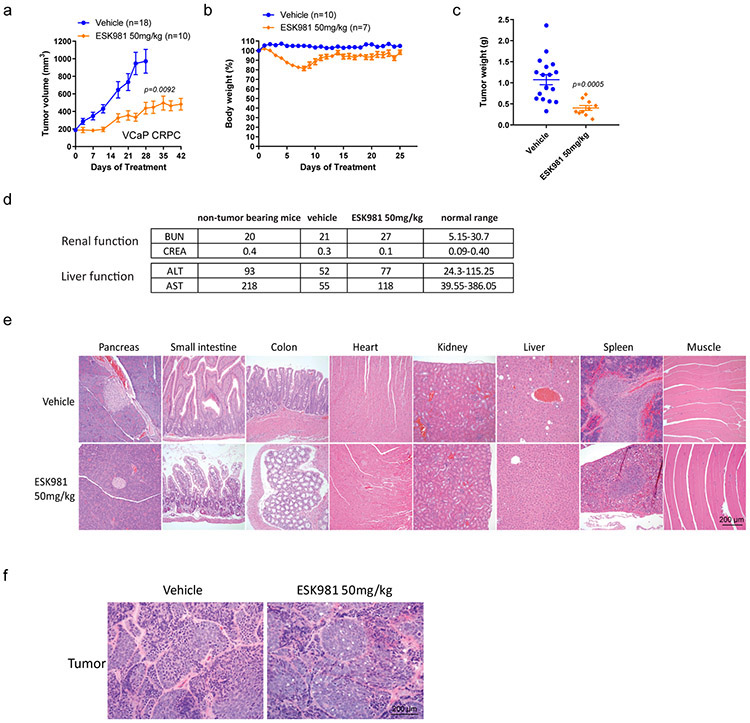
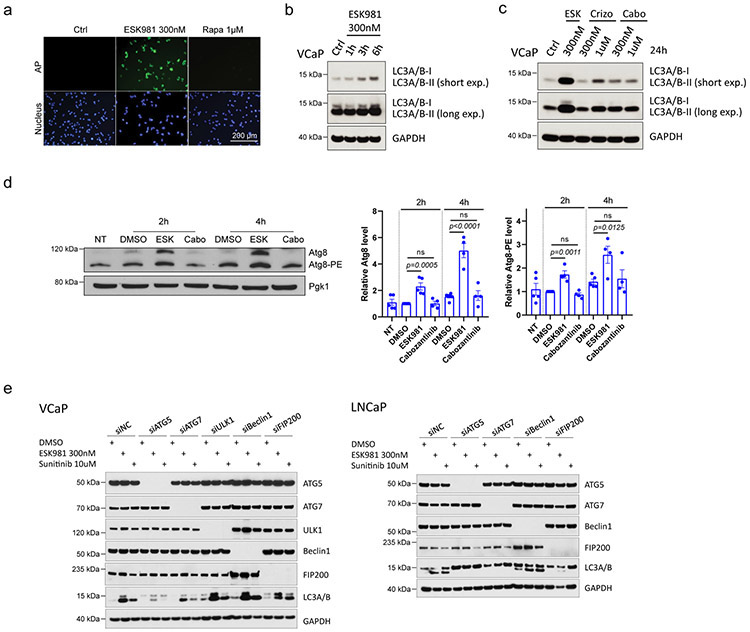
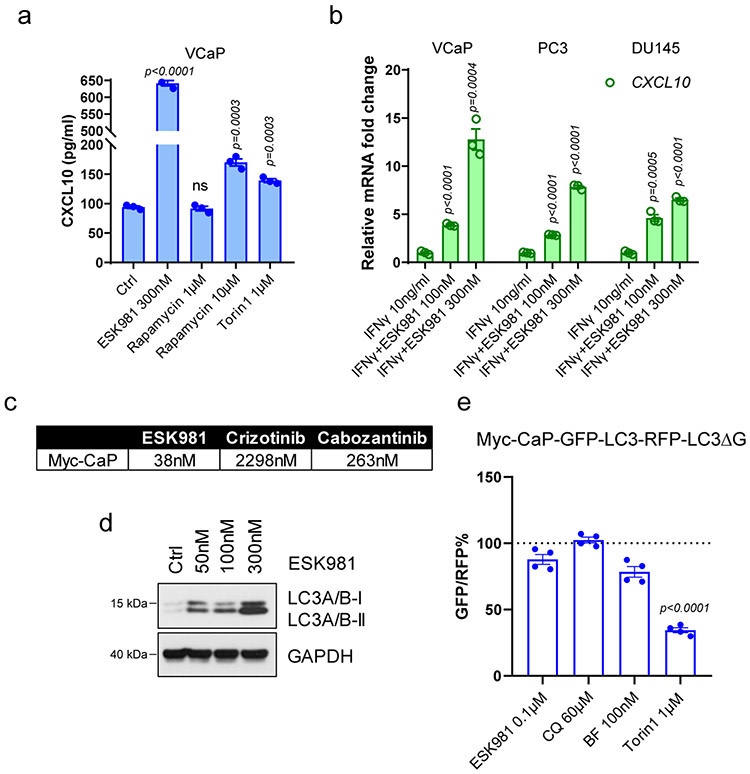
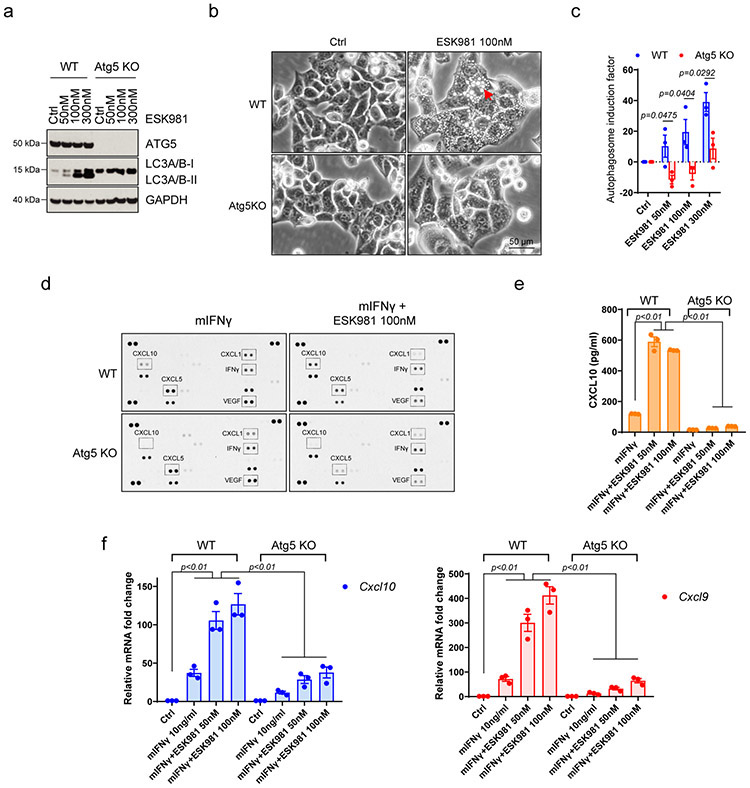
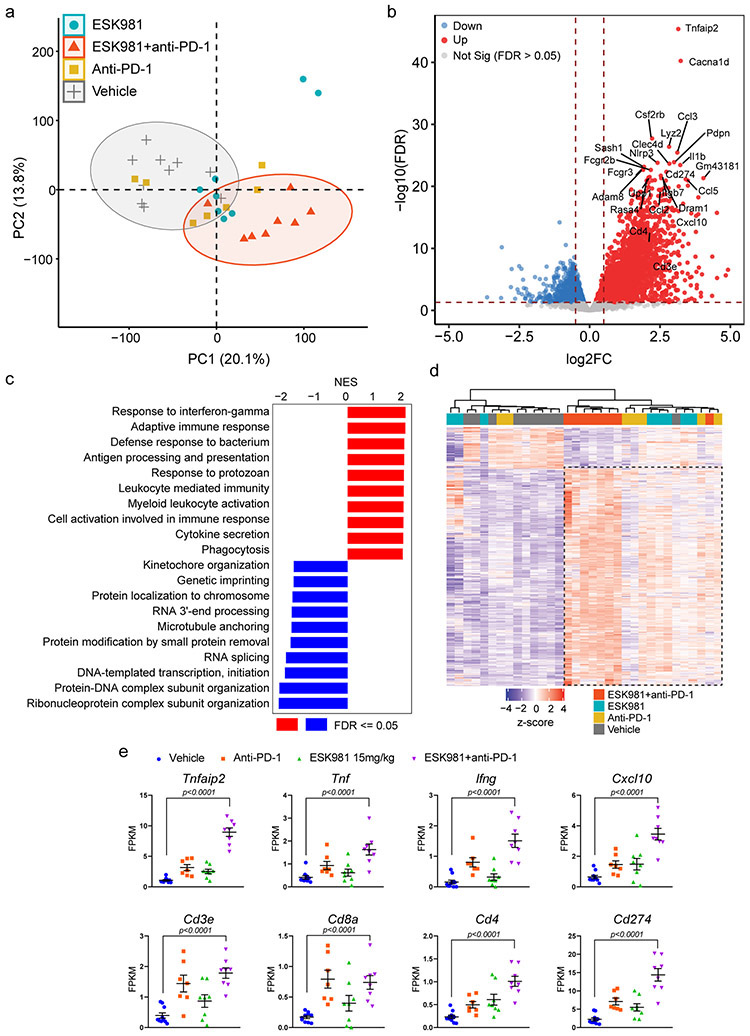
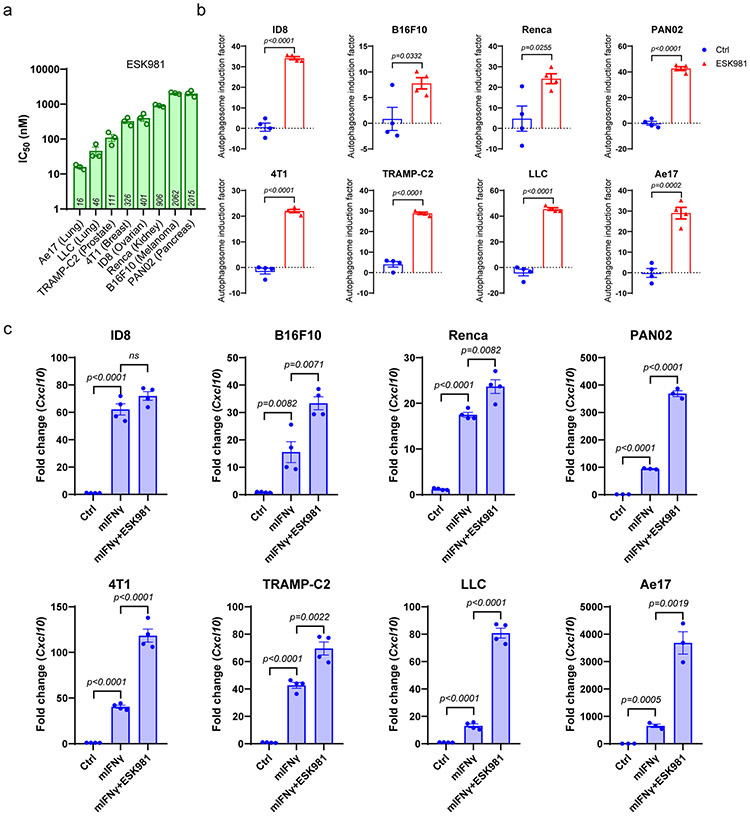
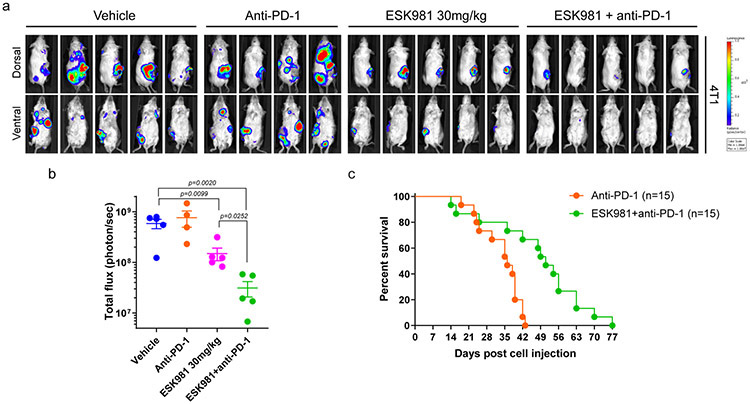
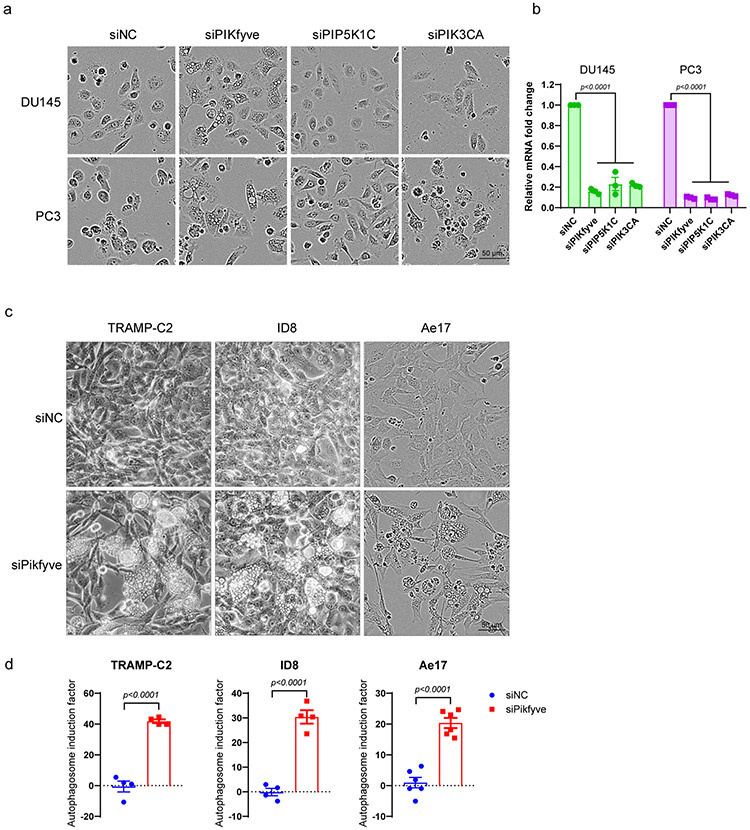
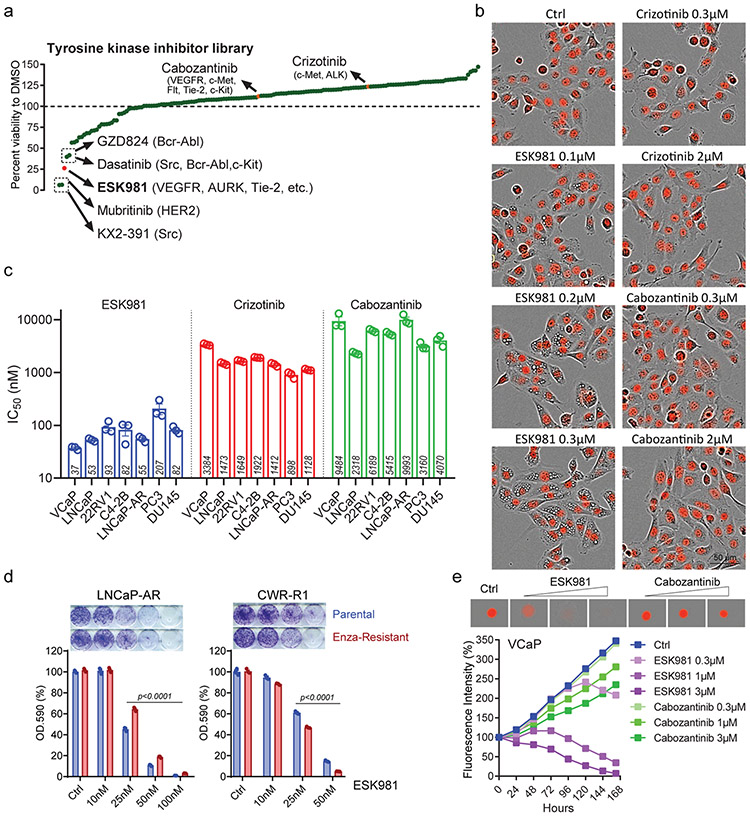
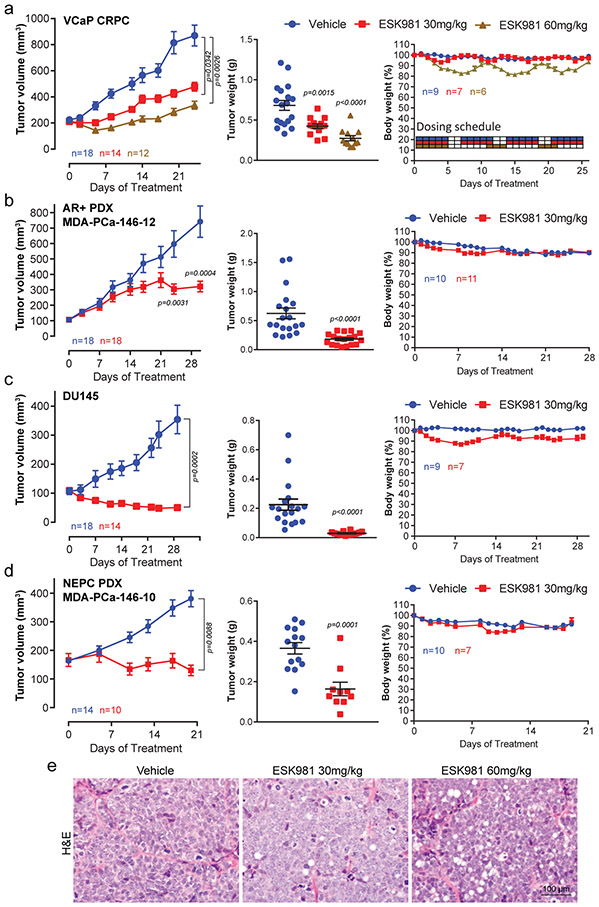
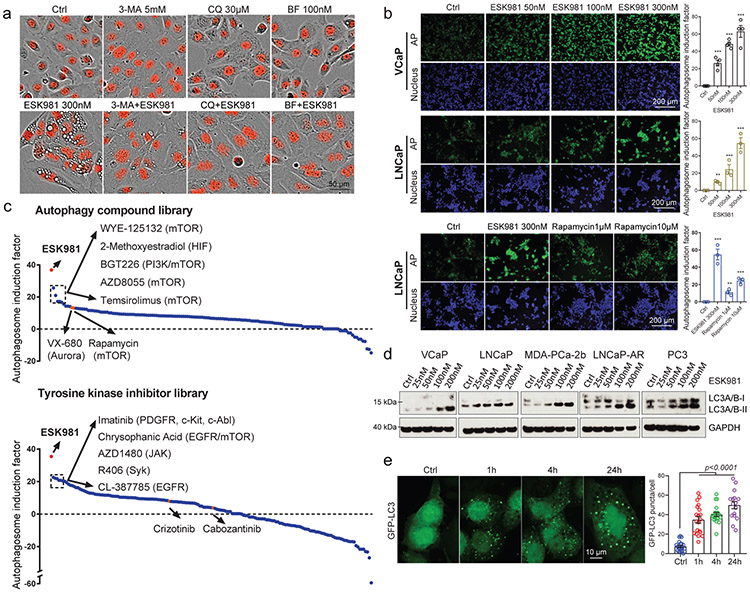
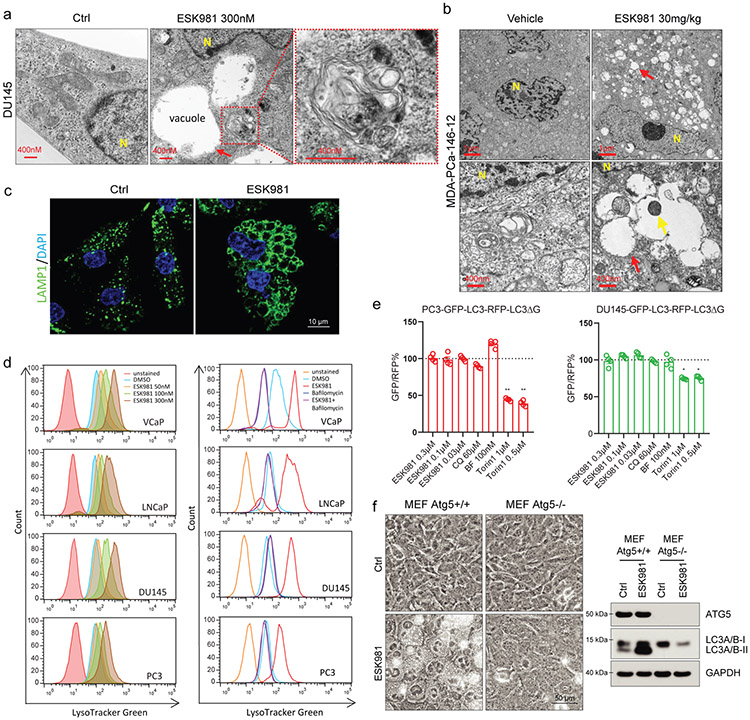
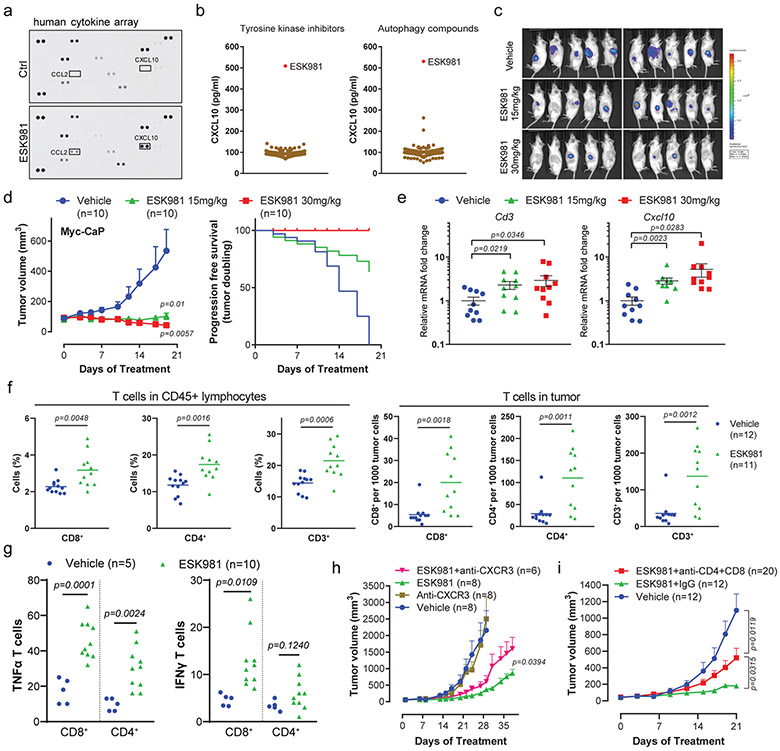
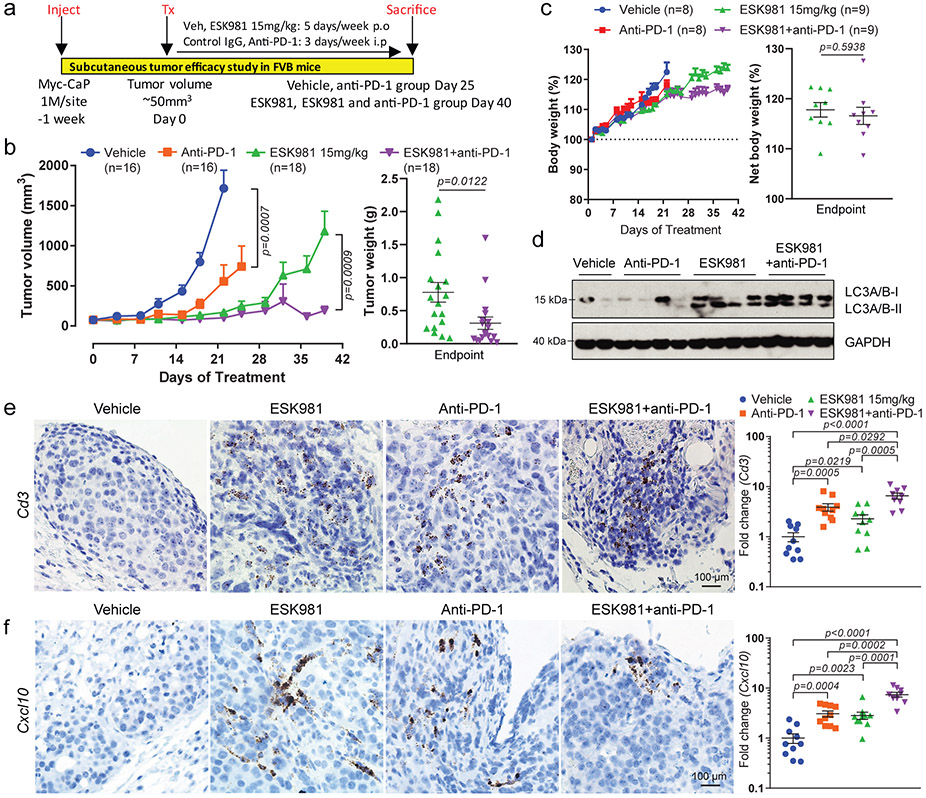
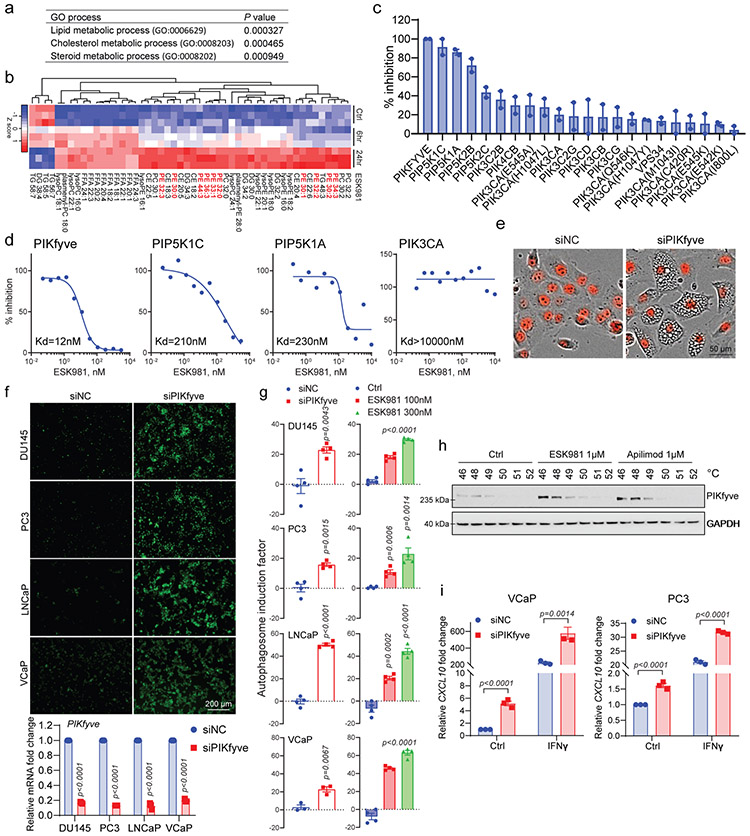
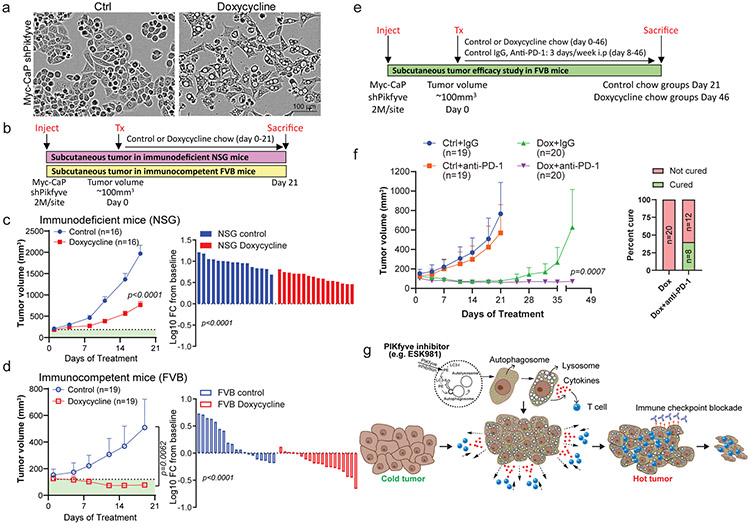
Multi-tyrosine kinase inhibitors (MTKIs) have thus far had limited success in the treatment of castration-resistant prostate cancer (CRPC). Here, we report a phase I-cleared orally bioavailable MTKI, ESK981, with a novel autophagy inhibitory property that decreased tumor growth in diverse preclinical models of CRPC. The anti-tumor activity of ESK981 was maximized in immunocompetent tumor environments where it upregulated CXCL10 expression through the interferon gamma pathway and promoted functional T cell infiltration, which resulted in enhanced therapeutic response to immune checkpoint blockade. Mechanistically, we identify the lipid kinase PIKfyve as the direct target of ESK981. PIKfyve-knockdown recapitulated ESK981's anti-tumor activity and enhanced the therapeutic benefit of immune checkpoint blockade. Our study reveals that targeting PIKfyve via ESK981 turns tumors from cold into hot through inhibition of autophagy, which may prime the tumor immune microenvironment in advanced prostate cancer patients and be an effective treatment strategy alone or in combination with immunotherapies.


Figures

Extended Data Fig. 1.
Extended Data Fig. 1.. ESK981 blocks cell growth, induces cell cycle arrest, and decreases cellular invasion.
(a-b) Representative crystal violet staining for a long-term survival assay of a panel of prostate cell lines at various concentrations of ESK981, crizotinib, or cabozantinib. (c) Cell cycle analysis was measured after 72 hours of increasing concentrations of ESK981 treatment in indicated prostate cancer cell lines. Ctrl, control. (d) Cell cycle analysis of VCaP cells that were treated with the indicated compounds for 72 hours. Cabo, cabozantinib; Crizo, crizotinib; Enza, enzalutamide; ESK, ESK981. (e) Matrigel invasion assay of various prostate cancer cell lines that were treated with the indicated concentrations of ESK981. The percentage invasion was quantified with a fluorescent plate reader. Data were analyzed by two-tailed unpaired t test from three independent experiments and presented as mean ± SEM. P-value indicated.
Extended Data Fig. 2.
Extended Data Fig. 2.. ESK981 inhibits the growth of diverse preclinical models of prostate cancer in vivo.
(a) Schematic illustration of the VCaP CRPC mouse xenograft experimental design. To generate castration-resistant VCaP, parental VCaP cells were injected subcutaneously into both flanks of intact male mice. When average VCaP tumors reached 200 mm3, mice were surgically castrated and VCaP tumors regressed due to loss of androgen. Castration-resistant VCaP tumors developed as VCaP tumors grew back to the size of pre-castration. Castration-resistant VCaP tumors were then randomized into three groups and treated with vehicle, 30 mg/kg, or 60 mg/kg ESK981 p.o., oral gavage. (b) Representative IHC images for proliferation marker Ki67 are shown after treatment with the indicated drugs for five days in VCaP tumors (left). Quantification of positive Ki67 percentage is shown on the right (right). Data were analyzed by two-tailed unpaired t test and presented as mean ± SEM. N=4 tumors per group. P-value indicated. (c) Representative individual tumors from vehicle and ESK981 groups in AR+ and ERG+ prostate PDX MDA-PCa-146-12 (left). Representative IHC showing Ki67 staining for vehicle and 30 mg/kg ESK981 groups of MDA-PCa-146-12 tumors (right) from three independent experiments. (d) Representative individual tumors from vehicle and ESK981 groups of DU145 tumors (left). Representative IHC showing Ki67 staining for the vehicle and 30 mg/kg ESK981 groups of DU145 tumors (right) from three independent experiments.
Extended Data Fig. 3.
Extended Data Fig. 3.. Renal function, liver function, and histopathological evaluation of ESK981-treated xenografts.
(a) Castration-resistant VCaP tumors were established according to Extended Data Fig. 2a. Tumor-bearing mice were divided into vehicle and ESK981 50 mg/kg groups, and tumor volumes were monitored twice per week for six weeks. Data were analyzed by two-tailed unpaired t test and presented as mean ± SEM at day 25. N=number of tumors and P-value indicated. (b) The percent body weights of VCaP tumor-bearing mice were monitored daily throughout this study. Data were presented as mean ± SEM. N=number of mice. (c) The weight of VCaP tumors from vehicle (n=18 tumors) and ESK981 50 mg/kg (n=10 tumors) were measured at the end of this study. Data were analyzed by two-tailed unpaired t test and presented as mean ± SEM. P-value indicated. (d) Blood chemistry was evaluated for renal and liver functions in non-tumor-bearing and VCaP tumor-bearing mice in vehicle and 50 mg/kg ESK981 treatment groups. (e) Representative histological sections showing H&E staining for various organs taken from vehicle- or ESK981-treated mice from three independent experiments. (f) Representative histological sections showing H&E staining for tumors taken from vehicle- or ESK981-treated mice from three independent experiments.
Extended Data Fig. 4.
Extended Data Fig. 4.. ESK981 robustly induces autophagosome levels and is dependent on ATG5 for its effects.
(a) DU145 cells with the indicated drug treatment for 24 hours. Autophagosome induction activity was visualized by CYTO-ID® assay from three independent experiments. Rapa, rapamycin. (b) VCaP cells were treated with 300 nM ESK981 for the indicated time points, and LC3 protein levels were assessed by western blot from three independent experiments. (c) VCaP cells were treated with ESK981 (ESK), crizotinib (Crizo), and cabozantinib (Cabo) at the indicated concentrations. Protein levels of LC3 were examined after 24 hours of treatment from three independent experiments. (d) Protein levels of Atg8 in yeast prd5Δ cells after ESK981 (ESK) or cabozantinib (Cabo) treatment under nitrogen deprivation conditions. NT, no treatment. Data were analyzed by two-tailed unpaired t test from four independent experiments and presented as mean ± SEM. P value indicated. (e) Protein levels of indicated protein post various siRNA knockdown in VCaP and LNCaP cells with or without 300 nM ESK981 or 1 μM sunitinib treatment for 24 hours from three independent experiments.
Extended Data Fig. 5.
Extended Data Fig. 5.. ESK981 upregulates CXCL10 expression in human prostate cancer cells and inhibits autophagy in murine Myc-CaP prostate cancer cells.
(a) CXCL10 protein levels measured by ELISA in conditioned media from VCaP cells treated with ESK981 or various autophagy inducers for 24 hours. Data were analyzed by two-tailed unpaired t test from three independent experiments and presented as mean ± SEM. P-value indicated. (b) CXCL10 mRNA levels measured by quantitative PCR (qPCR) in VCaP, PC3, and DU145 cells with the indicated treatment for 24 hours. IFNγ, interferon gamma. Data were analyzed by two-tailed unpaired t test from three independent experiments and presented as mean ± SEM. P-value indicated. (c) IC50 of ESK981, crizotinib, and cabozantinib determined in Myc-CaP cells. (d) Protein levels of LC3 after 50 nM, 100 nM, and 300 nM ESK981 treatment for 24 hours in Myc-CaP cells from three independent experiments. (e) Ratio of GFP/RFP signal in Myc-CaP GFP-LC3-RFP-LC3ΔG stable expressing cells with the indicated treatment for 24 hours. Data were analyzed by two-tailed unpaired t test from four independent experiments and presented as mean ± SEM. P-value indicated.
Extended Data Fig. 6.
Extended Data Fig. 6.. Atg5 deletion blocks ESK981-induced vacuolization and CXCL10-mediated immune response.
(a) Myc-CaP wild-type (WT) and Atg5 knockout (Atg5 KO) cells were treated with increasing concentrations of ESK981 for 24 hours. Atg5 and LC3 levels were assessed by western blot from three independent experiments. GAPDH served as a loading control. (b) Representative morphology of vacuolization in Myc-CaP wild-type (WT) and Atg5 knockout (Atg5 KO) cells after treatment with control or 100 nM ESK981 for 24 hours from three independent experiments. (c) Autophagosome content of Myc-CaP WT and Atg5 KO cells were measured by CYTO-ID® assay after being treated with increasing concentrations of ESK981 for 24 hours. Data were analyzed by two-tailed unpaired t test from three independent experiments and presented as mean ± SEM. P-value indicated. (d) Mouse cytokine array using Myc-CaP WT and Atg5 KO cell supernatant after treatment with 10 ng/ml mouse interferon gamma (mIFNγ) or mIFNγ + 100 nM ESK981 for 24 hours. Differential expression candidate dots are highlighted by boxes. (e) Mouse CXCL10 protein levels were measured by ELISA in Myc-CaP WT and Atg5 KO conditioned medium with the indicated treatment for 24 hours. Data were analyzed by two-tailed unpaired t test from three independent experiments and presented as mean ± SEM. P-value indicated. (f) mRNA levels of Cxcl10 and Cxcl9 were measured by qPCR in Myc-CaP WT and Atg5 KO cells with 50 nM or 100 nM ESK981 and 10 ng/ml mIFNγ treatment for 24 hours. Data were analyzed by two-tailed unpaired t test from three independent experiments and presented as mean ± SEM. P-value indicated.
Extended Data Fig. 7.
Extended Data Fig. 7.. Transcriptomic analysis of Myc-CaP tumors treated with ESK981 in combination with anti-PD-1 immunotherapy in FVB mice.
(a) Principal Component Analysis (PCA) of individual Myc-CaP tumors from indicated treatment groups based on variance-stabilizing transformation (vst) of read-count data. The vehicle and ESK981+anti-PD-1 combination groups form a relatively distinct cluster based on the first two principal components. (b) Volcano plot of differential gene expression analysis for groups treated with ESK981+anti-PD-1 versus vehicle. The horizontal dashed line corresponds to the FDR = 0.05. The vertical dashed lines correspond to log2FC >= 1 (up-regulation) or log2FC <= −1 (down-regulation). (c) Mouse Gene Set Enrichment Analysis (GSEA) with biological process gene ontology for groups treated with ESK981+anti-PD-1 versus vehicle. Top 10 gene sets are ordered by normalized enrichment score (NES). The top enriched categories are relevant to immune responses and inflammation. (d) Heatmap representation of top differentially expressed genes in groups treated with ESK981+anti-PD-1 versus vehicle (FDR <= 0.01, up or down-regulated by at least 2-fold). (e) Fragments per kilobase of exon model per million reads mapped (FPKM) of indicated targets from individual Myc-CaP tumors treated with vehicle (n=10 tumors), ESK981 (n=8 tumors), anti-PD-1 (n=7 tumors), or ESK981+anti-PD-1 (n=8 tumors). Data were analyzed by two-tailed unpaired t test and presented as mean ± SEM. P-value indicated.
Extended Data Fig. 8.
Extended Data Fig. 8.. ESK981 induces autophagosome formation and upregulates Cxcl10 expression in various murine cancer cell lines.
(a) IC50 from cell viability assays of ESK981 in murine cancer cells of lung (Ae17, LLC), melanoma (B16F10), ovarian (ID8), pancreas (PAN02), renal (Renca), prostate (TRAMP-C2), and breast (4T1) lineages. Data were plotted as mean ± SEM from three independent experiments. (b) Autophagosome content measured by CYTO-ID in indicated cell lines treated with control (Ctrl) or 300 nM ESK981 for 24 hours. Data were analyzed by two-tailed unpaired t test from four independent experiments and presented as mean ± SEM. P-value indicated. (c) mRNA level of Cxcl10 in indicated cell lines treated with 10 ng/ml mIFNγ or mIFNγ plus 300 nM ESK981 for 24 hours. Data were analyzed by two-tailed unpaired t test from three (PAN02, Ae17) or four (ID8, B16F10, Renca, 4T1, TRAMP-C2, LLC) independent experiments and presented as mean ± SEM. P-value indicated.
Extended Data Fig. 9.
Extended Data Fig. 9.. ESK981 sensitizes the murine breast cancer 4T1 model to anti-PD-1 immunotherapy.
(a) Bioluminescent signaling images showing dorsal and ventral views of individual 4T1 tumor-bearing mice from indicated treatment groups. (b) Bioluminescent quantification of total tumor burden from individual mice treated with vehicle (n=5 mice), anti-PD-1 (n=4 mice), ESK981 15 mg/kg (n=5 mice), ESK981+anti-PD-1 (n=5 mice). Data were analyzed by two-tailed unpaired t test and presented as mean ± SEM. P-value indicated. (c) Overall survival of 4T1-bearing mice treated with either anti-PD-1 (n=15 mice) or ESK981 and anti-PD-1 combination (n=15 mice).
Extended Data Fig. 10.
Extended Data Fig. 10.. PIKfyve mediates a cellular vacuolization morphology in human prostate cancer cells and murine cancer cells, and Pikfyve loss induces accumulation of autophagosomes in various murine cancer cells.
(a) Morphology of DU145 and PC3 cells after siNC, siPIKFYVE, siPIP5K1C, or siPIK3CA transfection from three independent experiments. (b) mRNA levels of PIKFYVE, PIP5K1C, and PIK3CA were measured by qPCR after siRNA knockdown of indicated targets in DU145 and PC3 cells. Data were analyzed by two-tailed unpaired t test and presented as mean ± SEM from three independent experiments. P-value indicated. (c) Morphological changes of TRAMP-C2, ID8, and Ae17 cells after siNC or siPikfyve transfection from three independent experiments. (d) Autophagosome induction activity measured with CYTO-ID® assay in TRAMP-C2, ID8, and Ae17 cells after siRNA knockdown of Pikfyve. Data were analyzed by two-tailed unpaired t test and presented as mean ± SEM from four (TRAMP-C2 and ID8) and six (Ae17) independent experiments. P-value indicated.
Fig. 1.
Fig. 1.. ESK981 inhibits the growth of prostate cancer cells in vitro and is associated with a vacuolization morphology.
(a) The percentage viabilities of DU145 cells treated with ESK981 or 167 other tyrosine kinase inhibitors (all at 300 nM) when compared to a DMSO vehicle control in a long term survival assay. The top five most inhibitory compounds, as well as cabozantinib and crizotinib (highlighted in orange), and their respective targets are indicated. ESK981 is highlighted in red. (b) Morphological differences of nuclear-restricted RFP-expressing DU145 cells treated with increasing concentrations of ESK981, crizotinib, or cabozantinib for 24 hours. Fluorescence and phase contrast images were taken by IncuCyte ZOOM from three independent experiments, with representative images shown. (c) A long-term survival assay was used to calculate the half-maximum inhibitory concentration (IC50) after two weeks of incubation with the serial dilutions of indicated drugs. IC50 of ESK981, crizotinib, and cabozantinib in a panel of prostate cancer cell lines are plotted as mean ± SEM from three independent experiments. (d) ESK981 was effective against enzalutamide (Enza)-resistant cell lines. LNCaP-AR and CWR-R1 enzalutamide-resistant cells were maintained in 5 μM and 20 μM enzalutamide medium, respectively, in vitro. Long-term survival (two weeks) was assayed by absorbance of crystal violet at OD.590. Data were analyzed by two-tailed unpaired t test from three independent experiments and presented as mean ± SEM. P-value indicated. (e) VCaP-RFP cells were cultured for three days in ultralow attachment plates to form 3D tumor spheroids prior to the indicated drug treatments. Increasing concentrations of ESK981 and cabozantinib were added over the indicated time period. Fluorescence intensity of 3D spheroids was measured by IncuCyte ZOOM.
Fig. 2.
Fig. 2.. ESK981 inhibits the growth of diverse preclinical models of prostate cancer in vivo.
(a) Castration-resistant VCaP tumors (VCaP CRPC) were established subcutaneously in castrated male SCID mice, and treated with vehicle, 30 mg/kg, or 60 mg/kg ESK981. Average tumor volumes were monitored twice per week, n=number of tumors (left). Individual VCaP CRPC tumor weights were measured at study endpoint, n=number of tumors (middle). Percent body weight changes and dosing schedule of VCaP CRPC model, n=number of mice (right). Data were analyzed by two-tailed unpaired t test and presented as mean ± SEM. N and P-value indicated. (b) Androgen receptor (AR)+ and ERG+ prostate patient-derived xenograft (PDX) MDA-PCa-146-12 were established subcutaneously in non-castrated SCID mice and treated with vehicle or 30 mg/kg ESK981. Average tumor volumes were monitored twice per week, n=number of tumors (left). Tumor weights from individual tumors at study endpoint, n=number of tumors (middle). Percent body weight changes of MDA-PCa-146-12 tumor-bearing mice, n=number of mice (right). Data were analyzed by two-tailed unpaired t test and presented as mean ± SEM. N and P-value indicated. (c) DU145 tumors were established subcutaneously in non-castrated SCID mice and treated with vehicle or 30 mg/kg ESK981. Average tumor volumes were monitored twice per week, n=number of tumors (left). Individual tumor weights were measured at study endpoint, n=number of tumors (middle). Percent body weight changes of DU145 tumor-bearing mice, n=number of mice (right). Data were analyzed by two-tailed unpaired t test and presented as mean ± SEM. N and P-value indicated. (d) Neuroendocrine (NEPC) prostate PDX MDA-PCa-146-10 were established in non-castrated SCID mice and treated with vehicle or 30 mg/kg ESK981. Tumor volumes were monitored twice per week, n=number of tumors (left). Individual tumor weights were measured at study endpoint, n=number of tumors (middle). Percent body weight changes of MDA-PCa-146-10 tumor-bearing mice, n=number of mice (right). Data were analyzed by two-tailed unpaired t test and presented as mean ± SEM. N and P-value indicated. (e) Representative H&E images from three independent experiments showing a dose-dependent induction of a vacuolization morphology from VCaP CRPC tumors treated with vehicle, 30 mg/kg, or 60 mg/kg ESK981 for five days.
Fig. 3.
Fig. 3.. ESK981 induces accumulation of autophagosomes in prostate cancer cells.
(a) Representative morphologies of DU145-RFP cells from three independent experiments treated with either ESK981, autophagy inhibitors (3-methyladenine [3-MA], chloroquine [CQ], bafilomycin A1 [BF]), or a combination of ESK981 and one additional autophagy inhibitor for six hours. Red indicates nuclei. (b) VCaP and LNCaP cells were treated with increasing concentrations of ESK981 for 24 hours. Autophagosome induction activity was measured with CYTO-ID®, and the quantification of autophagosomes are shown on the right. Rapamycin served as a positive control for autophagy induction. Data were analyzed by two-tailed unpaired t test from three (LNCaP) and four (VCaP) independent experiments and presented as mean ± SEM. **p<0.01; ***p<0.001. (c) Autophagosome induction activity of ESK981 (in red), measured with CYTO-ID®, when compared to an autophagy-related compound library consisting of 154 compounds (top) or a tyrosine kinase inhibitor library consisting of 167 compounds (bottom). DU145 cells were treated with ESK981 or the other compounds (all at 300 nM) for 24 hours. The top five compounds and their respective targets are indicated. VX-680 and rapamycin are highlighted in orange in autophagy-related compound library. Crizotinib and cabozantinib are highlighted in orange in tyrosine kinase inhibitor library. Targets of highlighted compounds are indicated in parentheses. (d) The indicated prostate cancer cell lines were treated with increasing concentrations of ESK981 for 24 hours. LC3 levels were assessed by western blot, with GAPDH serving as a loading control. (e) Representative images of GFP-LC3 puncta in DU145 cells with 300 nM ESK981 treatment for various times. Quantifications of GFP-LC3 puncta from Ctrl (n=20 analyzed cells), 1h (n=20 analyzed cells), 4h (n=20 analyzed cells), and 24h (n=16 analyzed cells) are shown on the right. Data were analyzed by two-tailed unpaired t test and presented as mean ± SEM. P-value indicated.
Fig. 4.
Fig. 4.. ESK981 induces accumulation of lysosomes through inhibition of autophagic flux in prostate cancer cells.
(a) Representative TEM micrographs of DU145 cells after 300 nM ESK981 treatment for 24 hours from three independent experiments. Micrograph of ESK981-treated cell shows mostly clear vacuoles adjacent to an autophagic vacuole, which is magnified in the red dashed box. Red arrow indicates a mostly clear vacuole. N, nucleus. (b) Representative micrographs of MDA-PCa-146-12 PDX tumors taken by TEM after five days of treatment from three independent experiments. Red arrows indicate vacuoles in ESK981 group, and yellow arrows indicate cellular materials inside the vacuole. N, nucleus. (c) Representative immunofluorescence staining of LAMP1 in DU145 cells treated with control or 300 nM ESK981 for 24 hours from three independent experiments. (d) Lysosomal activity was quantified by FACS after staining with LysoTracker Green. VCaP, LNCaP, PC3, and DU145 cells were treated with increasing concentrations of ESK981 for 24 hours (left). VCaP, LNCaP, PC3, and DU145 cells were treated with DMSO, ESK981 (300 nM), bafilomycin A1 (100 nM), or ESK981-bafilomycin A1 combination for 24 hours (right). (e) Ratio of GFP/RFP signal in PC3 and DU145 GFP-LC3-RFP-LC3ΔG stable expressing cells with the indicated treatment for 24 hours. Data were analyzed by two-tailed unpaired t test from four independent experiments and presented as mean ± SEM. *p<0.05; **p<0.01. (f) Paired MEF cells with either Atg5 wild type (Atg5+/+) or Atg5 knockout (Atg5−/−) were treated with 300 nM ESK981 for 24 hours. Representative morphologies are shown in phase contrast microscopy (left) from three independent experiments. ATG5 and LC3 protein levels were examined by western blot (right).
Fig. 5.
Fig. 5.. ESK981 activates an anti-tumor immune response in immune-competent murine prostate cancer models.
(a) Human cytokine array using VCaP conditioned medium after 300 nM ESK981 treatment for 24 hours. CXCL10 and CCL2 are highlighted on the dot plots. (b) CXCL10 ELISA using conditioned medium from VCaP cells treated with either ESK981 or two compound libraries (tyrosine kinase inhibitors and autophagy-related compounds), all at 300 nM for 24 hours. N=3 replicate wells per compound. (c) Myc-CaP tumors were established in FVB mice and treated with vehicle or the indicated dose of ESK981. Bioluminescent imaging was performed on individual tumors at day 19. N=10 tumors per group. (d) Average Myc-CaP tumor volumes from indicated treatment groups (left). Progression-free survival (tumor doubling) was calculated from individual tumors (right). Data were analyzed by two-tailed unpaired t test and presented as mean ± SEM. N=10 tumors per group, and P-values are indicated. (e) Cd3 and Cxcl10 mRNA levels of individual Myc-CaP tumors treated with vehicle, 15 mg/kg, or 30 mg/kg ESK981. Data were analyzed by two-tailed unpaired t test and presented as mean ± SEM. N=10 tumors per group, and P-values are indicated. (f) Flow cytometry quantification of CD8+, CD4+, and CD3+ T cells in CD45+ lymphocytes (left) and infiltrating Myc-CaP tumors (right) treated with vehicle or 15 mg/kg ESK981. Data were analyzed by two-tailed unpaired t test and presented as mean and individual data points. N=number of tumors, and P-values are indicated. (g) Flow cytometry quantification of TNFα or IFNγ-expressing CD8+ and CD4+ T cells infiltrating Myc-CaP tumors treated with vehicle or 15 mg/kg ESK981. Data were analyzed by two-tailed unpaired t test and presented as individual data points. N=number of tumors, and P-values are indicated. (h) Average Myc-CaP tumor volumes from indicated treatment groups in FVB mice. Data are presented as mean ± SEM and p-values were analyzed by two-tailed unpaired t test at endpoint for ESK981 and ESK981+anti-CXCR3 groups. N=number of tumors, and P-value is indicated. (i) Average Myc-CaP tumor volumes from indicated treatment groups in FVB mice. Data were analyzed by two-tailed unpaired t test and presented as mean ± SEM. N=number of tumors, and P-values are indicated.
Fig. 6.
Fig. 6.. ESK981 potentiates the effect of anti-PD-1 immunotherapy in immune-competent murine prostate cancer models.
(a) Illustration of Myc-CaP experimental design in immune-competent FVB mice. p.o, oral gavage. i.p, intraperitoneal. (b) Average Myc-CaP tumor volumes from indicated treatment (left). Myc-CaP tumor weights were measured at endpoint from ESK981 and ESK981 plus anti-PD-1 (right). Data were analyzed by two-tailed unpaired t test and presented as mean ± SEM. N=number of tumors, and P-values are indicated. (c) Percent body weight changes of Myc-CaP tumor-bearing mice receiving indicated treatment (left); data were presented as mean ± SEM. Net body weight changes were calculated by exclusion of tumor weight from total body weight in ESK981 and ESK981+anti-PD-1 treated mice at day 40 (right); data were analyzed by two-tailed unpaired t test and presented as mean ± SEM. N=number of mice, and P-value is indicated. (d) Protein levels of LC3 from representative individual tumors measured by western blot after five days of the indicated treatment in Myc-CaP tumors. N=2 for vehicle; n=4 for anti-PD-1; n=4 for ESK981; n=4 for ESK981+anti-PD-1 with three independent experiments. (e) Representative Cd3 RNA ISH from the indicated Myc-CaP tumors with three independent experiments (left). For a complementary method of assessing Cd3 levels, Cd3 mRNA levels were quantified by qPCR in individual tumors treated with vehicle (n=10 tumors), ESK981 15 mg/kg (n=10 tumors), anti-PD-1 (n=10 tumors), ESK981 and anti-PD-1 (n=9 tumors) (right). Data from vehicle and ESK981 15 mg/kg tumors were included for different comparison purposes in Fig. 5e. Data were analyzed by two-tailed unpaired t test and presented as mean ± SEM. P-value indicated. (f) Representative Cxcl10 RNA ISH from the indicated Myc-CaP tumors with three independent experiments (left). For a complementary method of assessing Cxcl10 levels, Cxcl10 mRNA levels were quantified by qPCR in individual tumors treated with vehicle (n=10 tumors), ESK981 15 mg/kg (n=10 tumors), anti-PD-1 (n=10 tumors), ESK981 and anti-PD-1 (n=9 tumors), after three weeks of the indicated treatments in Myc-CaP tumors (right). Data from vehicle and ESK981 15 mg/kg tumors were included for different comparison purposes in Fig. 5e. Data were analyzed by two-tailed unpaired t test and presented as mean ± SEM. P-value indicated.
Fig. 7.
Fig. 7.. Identification of lipid kinase PIKfyve as the target of ESK981-induced effects on autophagy and CXCL10 levels.
(a) Gene ontology analysis for top elevated genes after 300 nM ESK981 in VCaP cells for 6 and 24 hour treatments. The top three processes are listed. (b) Heatmap representation of untargeted lipidomics analysis after 300 nM ESK981 treatment for 6 and 24 hours in VCaP cells. N=3 technical replicates per group. The PE class is highlighted in red. (c) Percent inhibition of 1 μM ESK981 against a panel of 22 lipid kinases. Data are presented as mean with individual data points. (d) Representative dissociation constant (Kd) curve of ESK981 against lipid kinases PIKfyve, PIP5K1C, PIP5K1A, and PIK3CA. (e) Representative morphology of DU145-RFP cells with control siRNA or PIKFYVE siRNA with three independent experiments. (f) Fluorescent images showing autophagosome levels measured with CYTO-ID® assay in DU145, PC3, LNCaP, and VCaP after siRNA knockdown of PIKFYVE (top). PIKFYVE mRNA levels were quantified by qPCR in indicated cells after siNC or siPIKFYVE knockdown (bottom). Data were analyzed by two-tailed unpaired t test from three independent experiments and presented as mean ± SEM. P-value indicated. (g) Quantification of autophagosome induction activity measured with CYTO-ID® assay in DU145, PC3, LNCaP, and VCaP after siRNA knockdown of PIKFYVE or treatment with ESK981. Data were analyzed by two-tailed unpaired t test from three independent experiments for VCaP siRNA and four independent experiments for the remaining conditions. Data are presented as mean ± SEM. P-values indicated. (h) Cellular thermal shift assay (CESTA) of VCaP cells treated with control, 1 μM ESK981, or 1 μM apilimod for 2 hours with three independent experiments. (i) CXCL10 mRNA levels in VCaP or PC3 cells after siRNA knockdown of a non-targeting control (siNC) or PIKFYVE (siPIKFYVE) with the indicated treatment for 24 hours. Data were analyzed by two-tailed unpaired t test from three independent experiments and presented as mean ± SEM. P-value indicated.
Fig. 8.
Fig. 8.. Genetic inhibition of Pikfyve potentiates the therapeutic benefit of anti-PD-1 immunotherapy in immune-competent murine models.
(a) Representative images of doxycycline inducible shPikfyve Myc-CaP cells with or without 1 μg/ml doxycycline treatment for 72 hours from three independent experiments. (b) Schematic illustration of shPikfyve Myc-CaP experimental design in immunodeficient mice (NSG) and immunocompetent mice (FVB). (c) Average tumor volume of shPikfyve Myc-CaP with or without doxycycline chow in NSG mice (left). Percent changes in shPikfyve Myc-CaP tumor volume represented by waterfall plot in NSG mice (right). Data were analyzed by two-tailed unpaired t test and presented as mean ± SEM. N=number of tumors and P-value is indicated. (d) Average tumor volume of shPikfyve Myc-CaP with or without doxycycline chow in FVB mice (left). Percent changes in shPikfyve Myc-CaP tumor volume represented by waterfall plot in FVB mice (right). Data were analyzed by two-tailed unpaired t test and presented as mean ± SEM. N=number of tumors and P-value is indicated. (e) Schematic illustration of shPikfyve Myc-CaP experimental design in immunocompetent mice. i.p, intraperitoneal. (f) Average tumor volume of shPikfyve Myc-CaP with control chow or doxycycline chow and/or mouse control IgG or anti-PD-1 antibody for 6 weeks (left). Data from control chow or doxycycline chow groups were included in Fig. 8d for different comparison purposes. Percentage cure rate defined as ratio of complete tumor regression on groups of doxycycline chow and/or mouse anti-PD-1 antibody (right). Data were analyzed by Mann-Whitney test and presented as mean ± SEM. N=number of tumors and P-value is indicated. (g) Model of ESK981’s mechanism of action and its anti-tumor activity, described in the main text.

References

    1. Ferraldeschi R, Welti J, Luo J, Attard G & de Bono JS Targeting the androgen receptor pathway in castration-resistant prostate cancer: progresses and prospects. Oncogene 34, 1745–1757 (2015). - PMC - PubMed
    1. Scher HI, et al. Increased survival with enzalutamide in prostate cancer after chemotherapy. N. Engl. J. Med 367, 1187–1197 (2012). - PubMed
    1. de Bono JS, et al. Abiraterone and increased survival in metastatic prostate cancer. N. Engl. J. Med 364, 1995–2005 (2011). - PMC - PubMed
    1. Qiao Y, et al. Mechanistic support for combined MET and AR blockade in castration-resistant prostate cancer. Neoplasia 18, 1–9 (2016). - PMC - PubMed
    1. Ahronian LG & Corcoran RB Strategies for monitoring and combating resistance to combination kinase inhibitors for cancer therapy. Genome Med. 9, 1–12 (2017). - PMC - PubMed

METHODS REFERENCES

    1. Chen CD, et al. Molecular determinants of resistance to antiandrogen therapy. Nat. Med 10, 33–39 (2004). - PubMed
    1. Wang L, et al. VSTM2A overexpression is a sensitive and specific biomarker for mucinous tubular and spindle cell carcinoma (MTSCC) of the kidney. Am. J. Surg. Pathol 42, 1571–1584 (2018). - PMC - PubMed
    1. Bernard A, et al. Rph1/KDM4 mediates nutrient-limitation signaling that leads to the transcriptional induction of autophagy. Curr. Biol 25, 546–555 (2015). - PMC - PubMed
    1. Martinez Molina D, et al. Monitoring drug target engagement in cells and tissues using the cellular thermal shift assay. Science 341, 84–87 (2013). - PubMed
    1. Jafari R, et al. The cellular thermal shift assay for evaluating drug target interactions in cells. Nat. Protoc 9, 2100–2122 (2014). - PubMed

Publication types

Substances