. 2021 Oct;2(10):1071-1085.
doi: 10.1038/s43018-021-00247-z. Epub 2021 Sep 30.

Low neoantigen expression and poor T-cell priming underlie early immune escape in colorectal cancer

Affiliations

Low neoantigen expression and poor T-cell priming underlie early immune escape in colorectal cancer

Peter M K Westcott et al. Nat Cancer. 2021 Oct.

Abstract

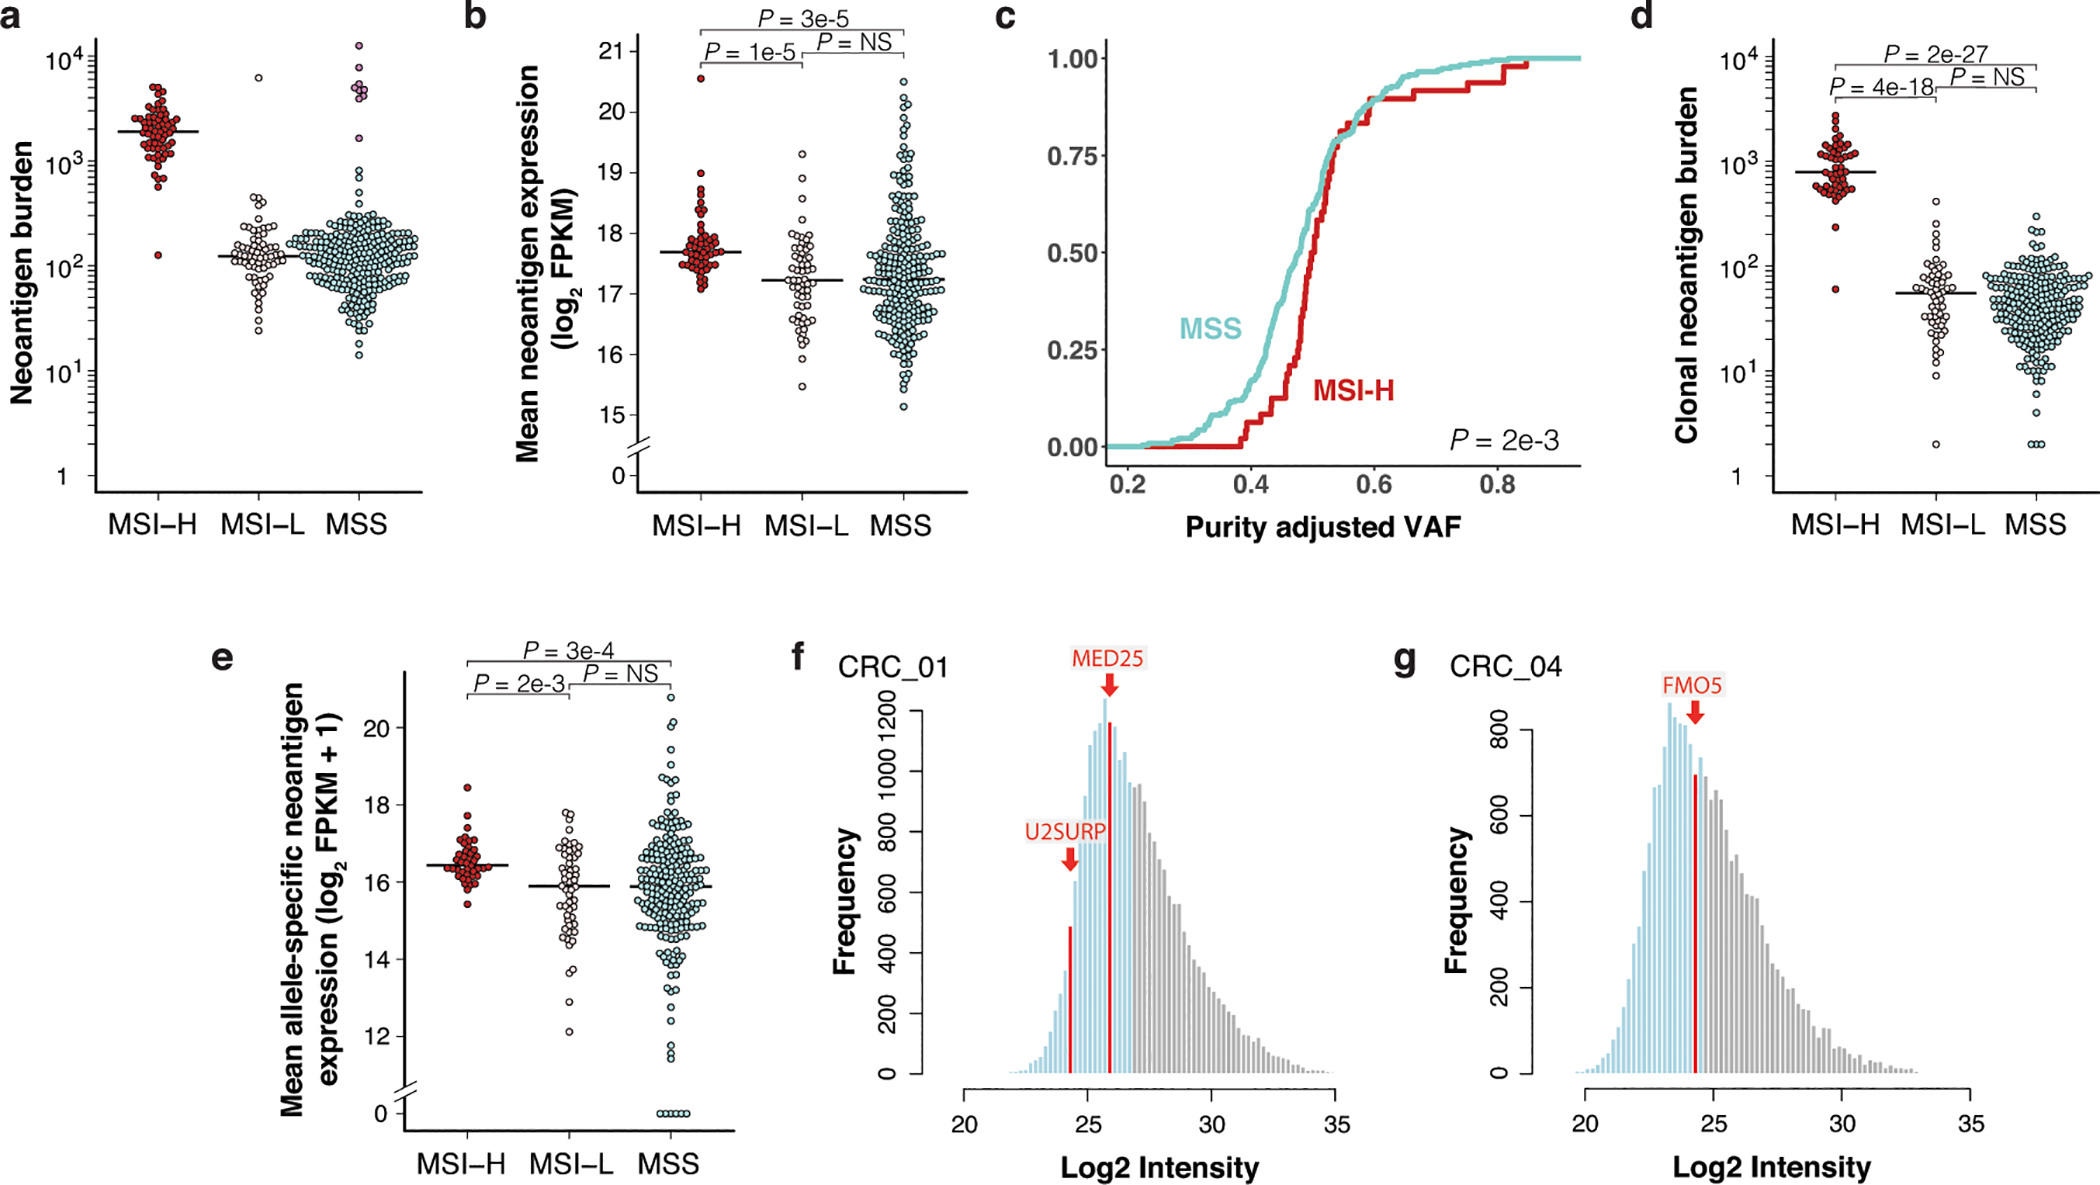
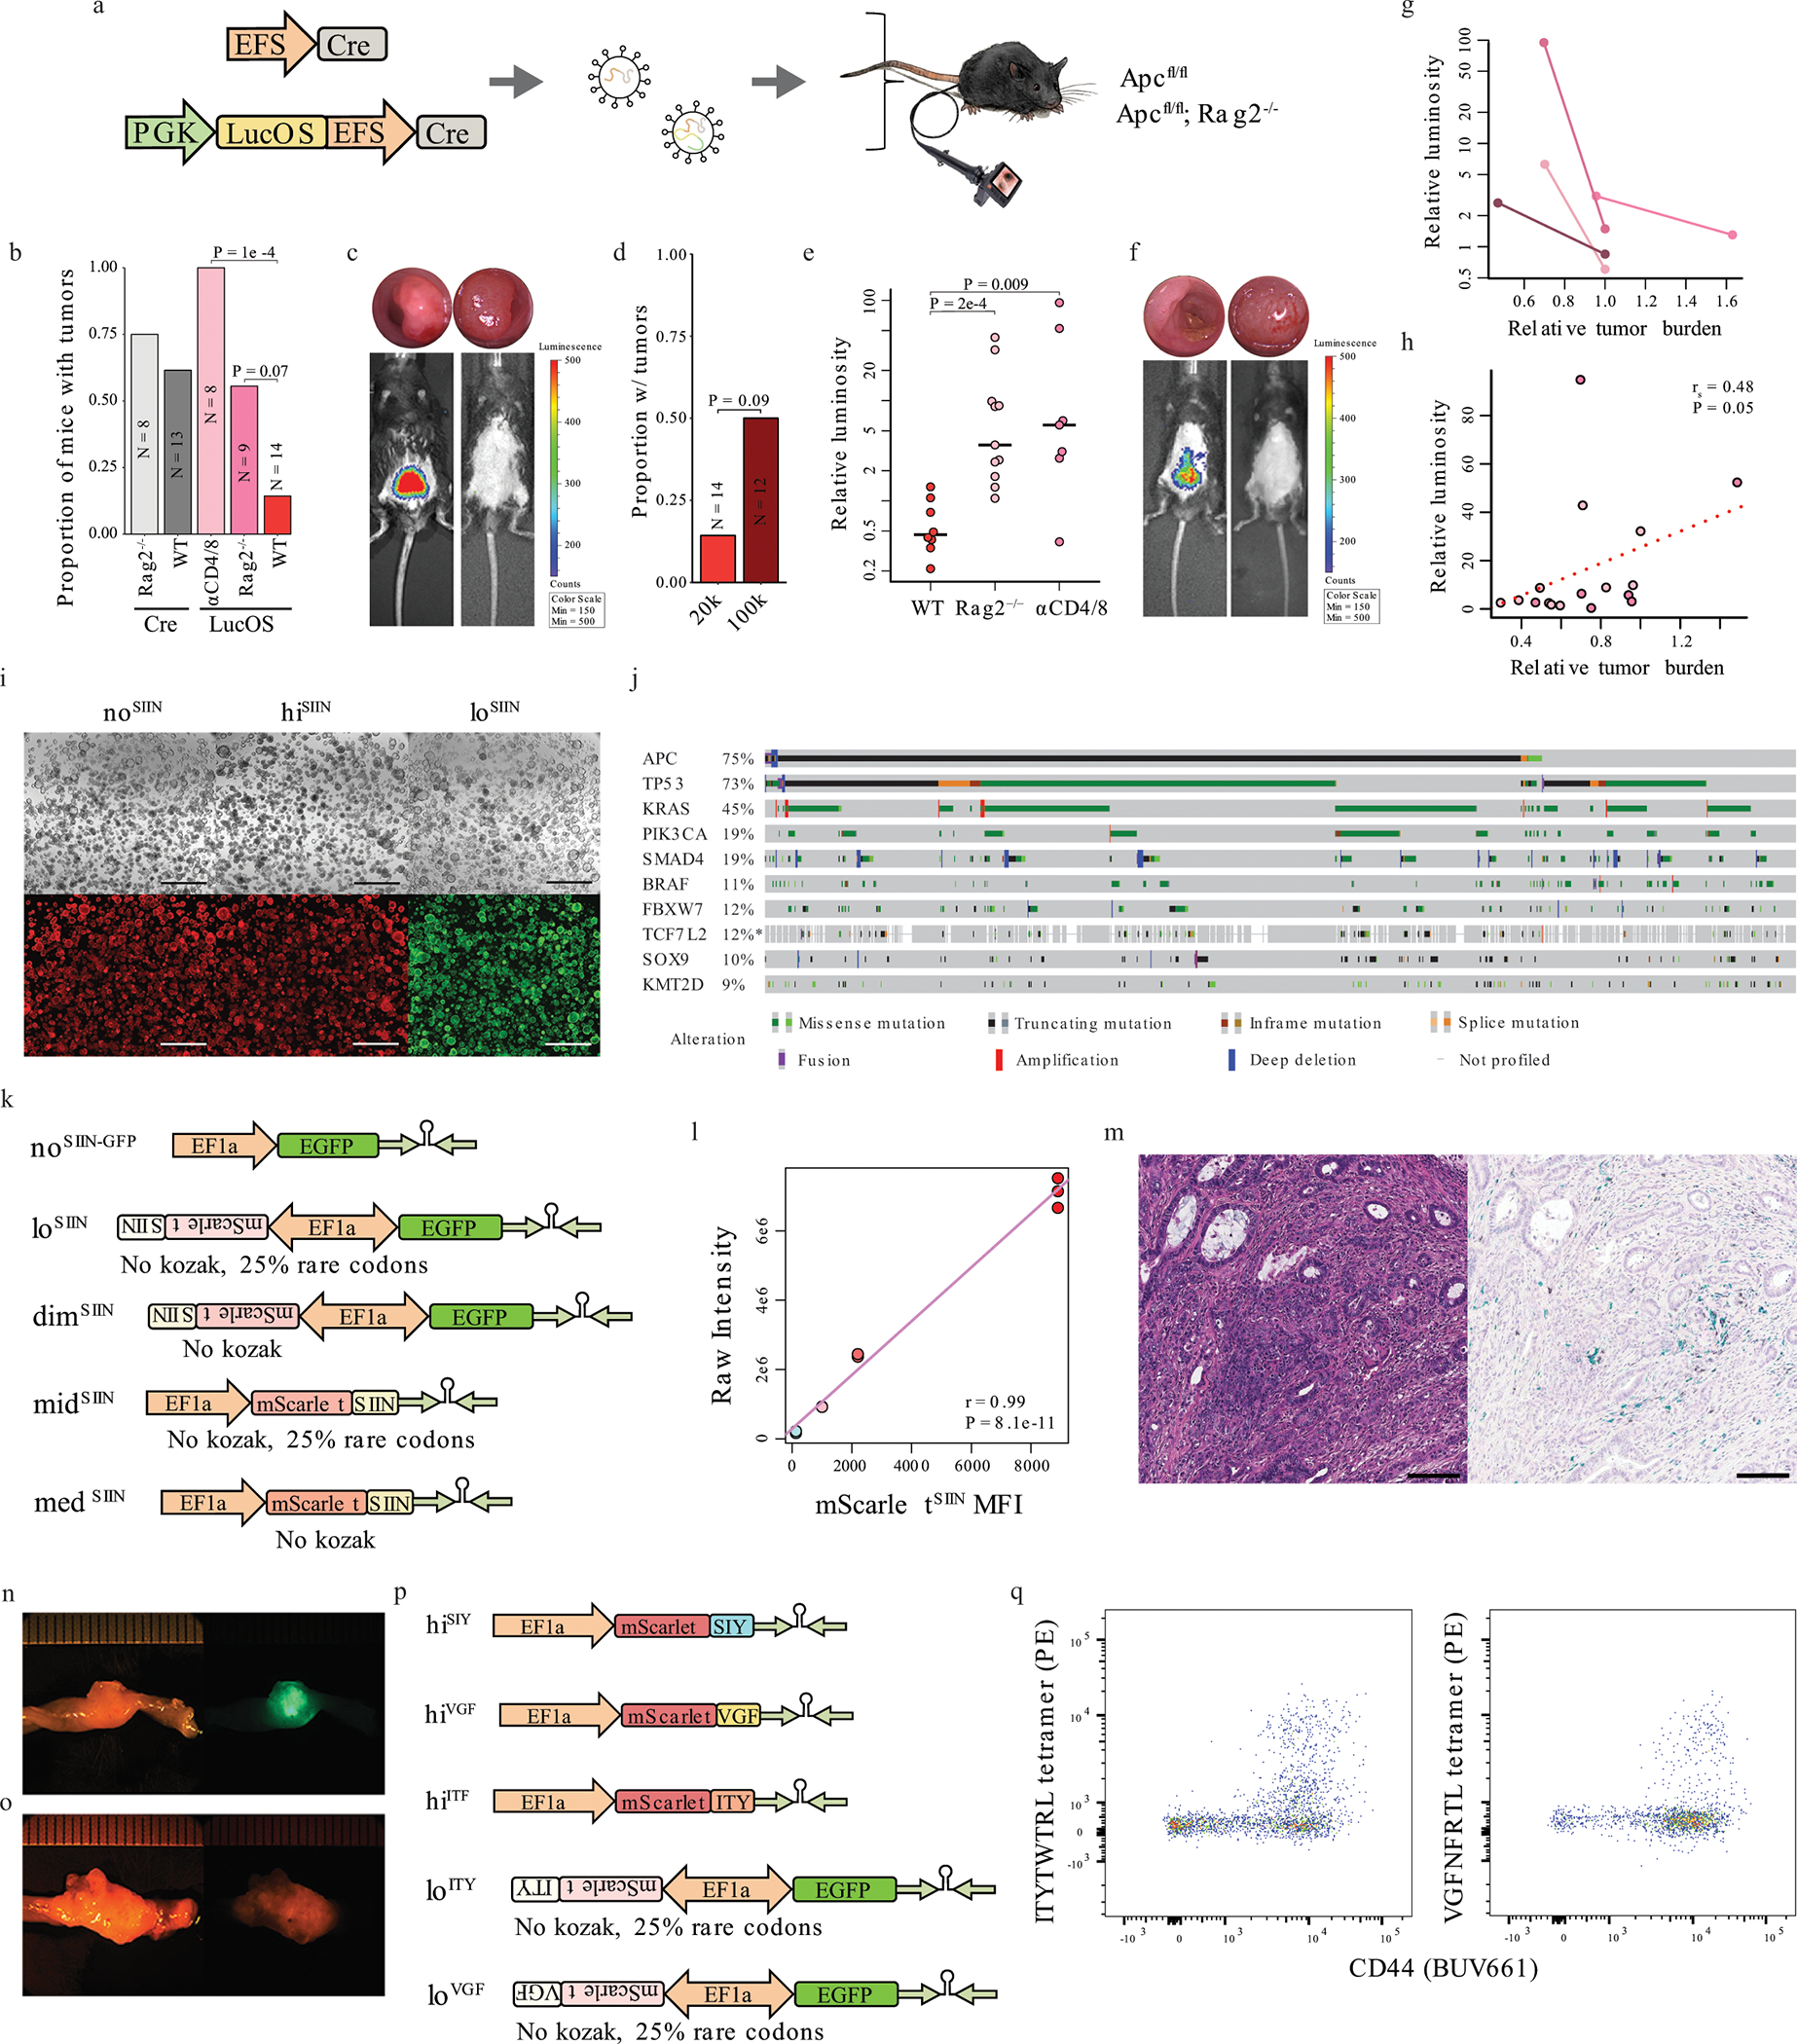
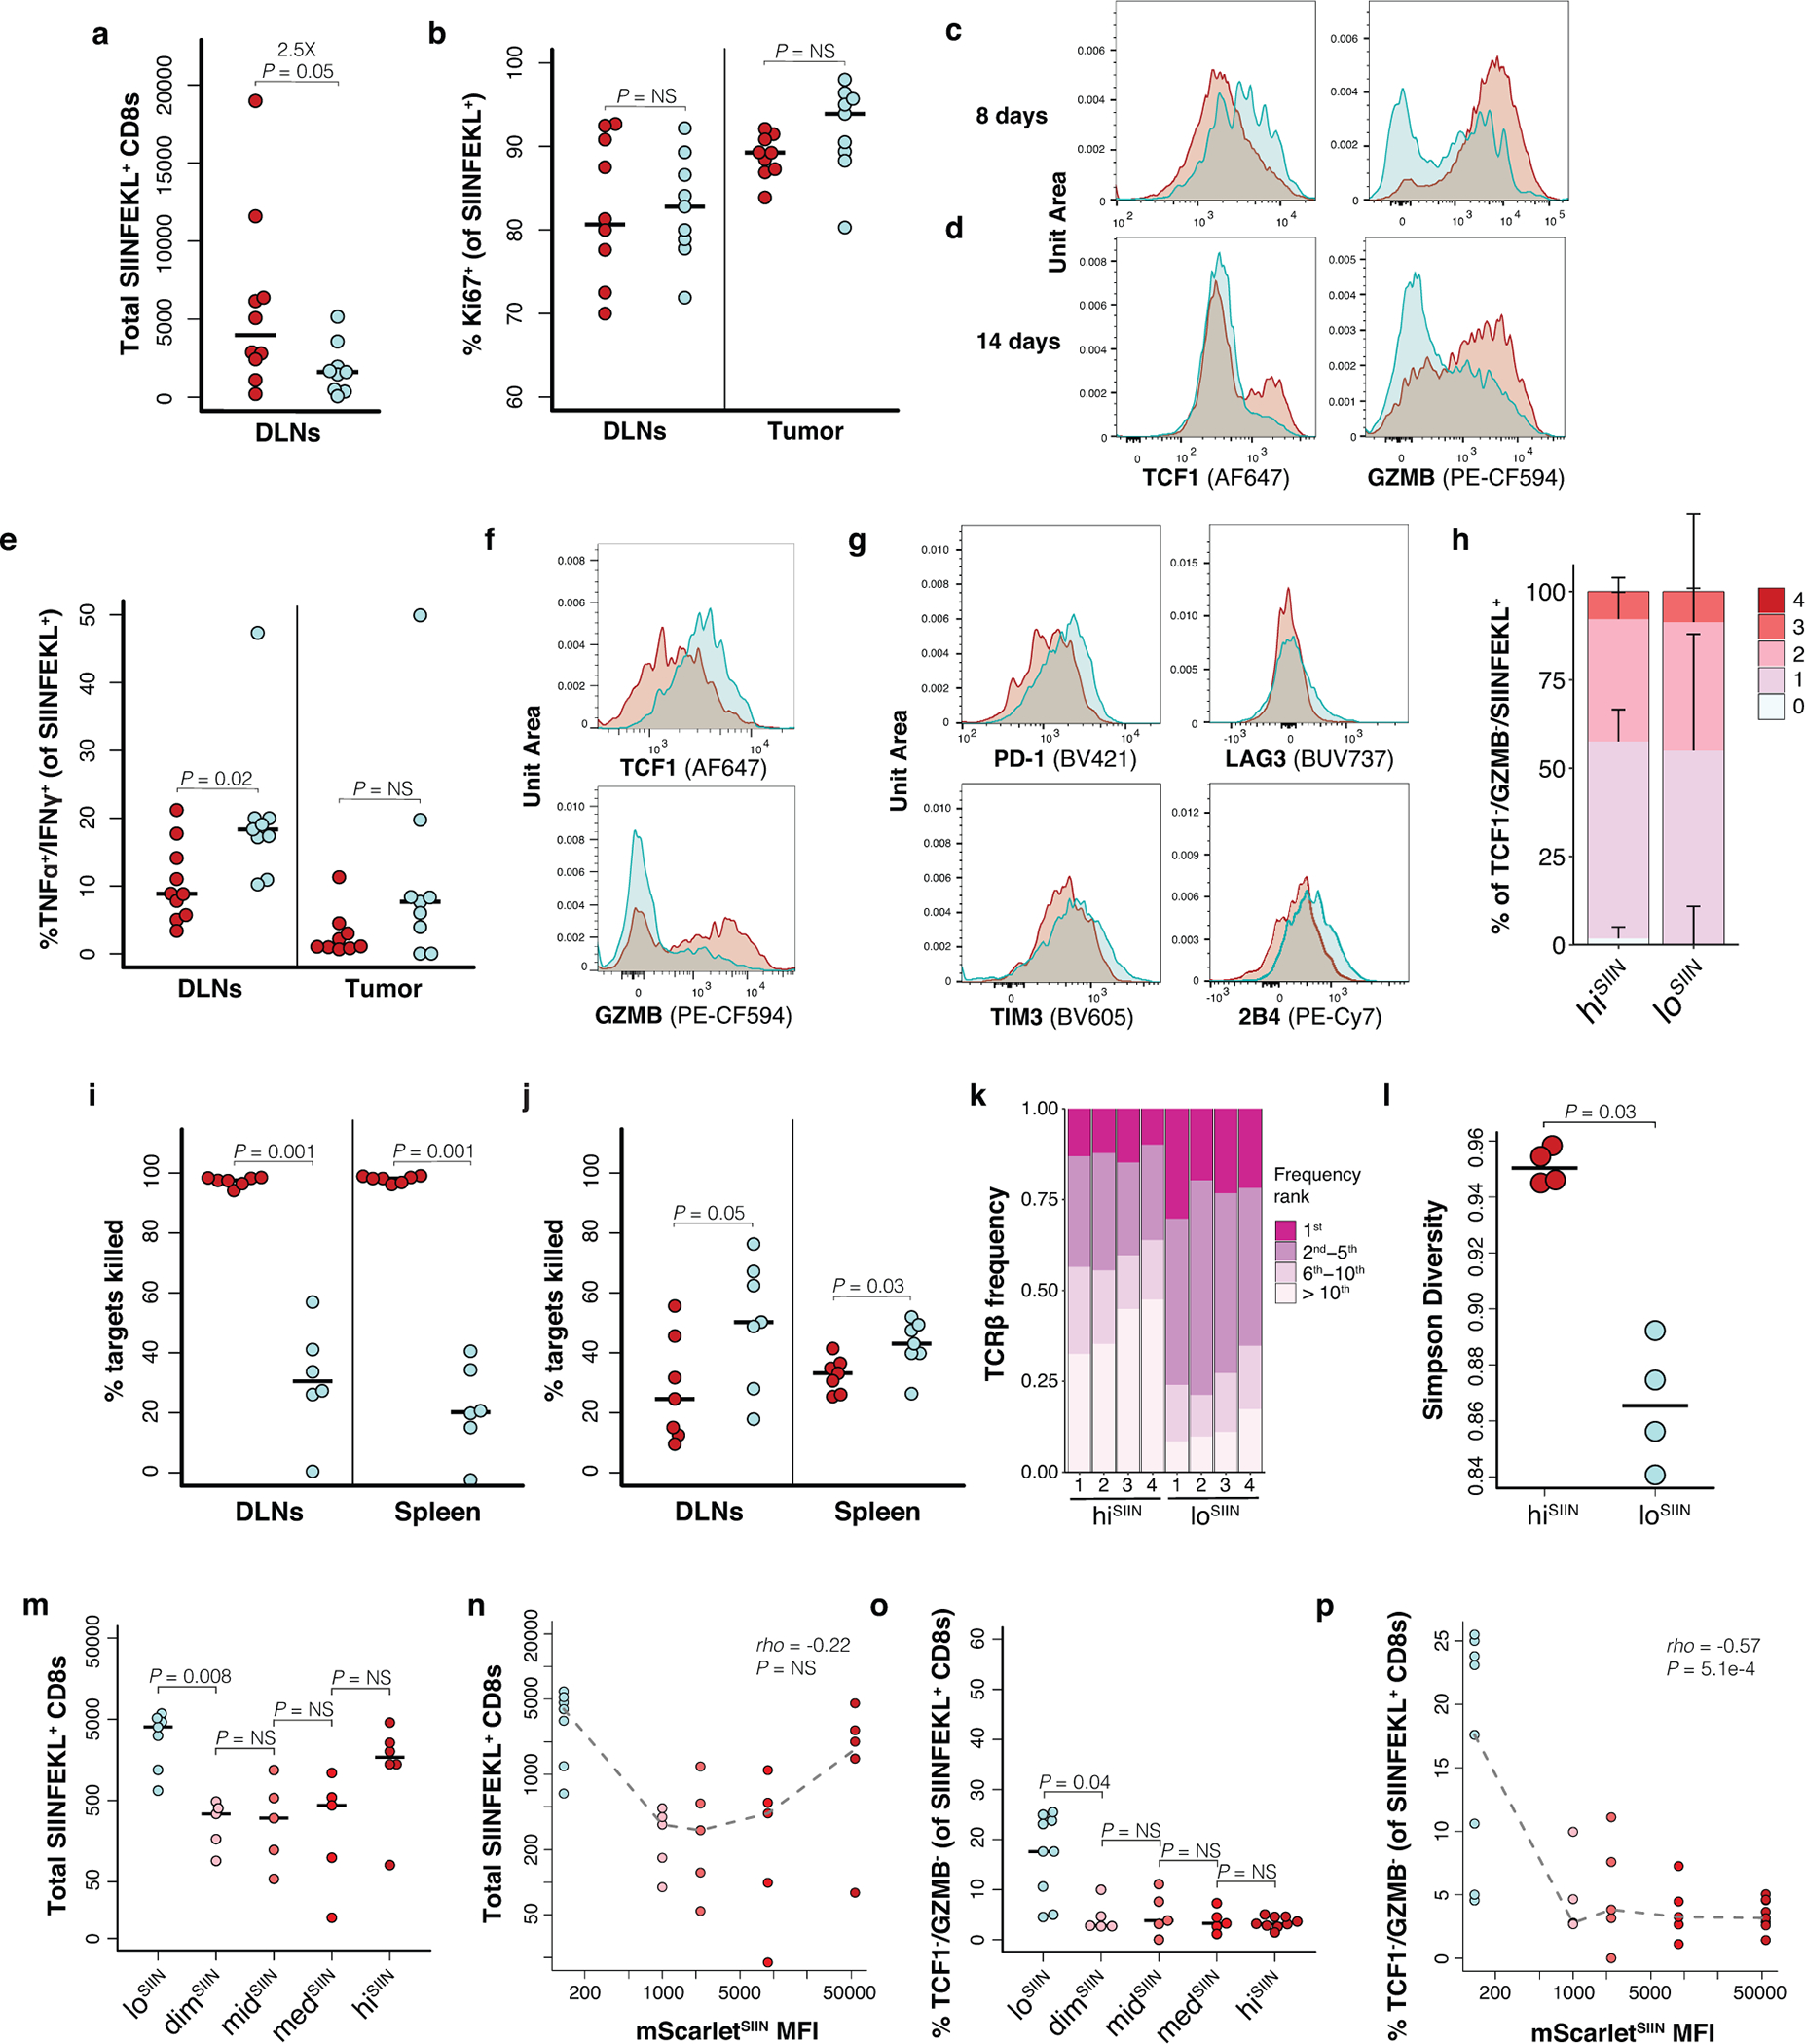
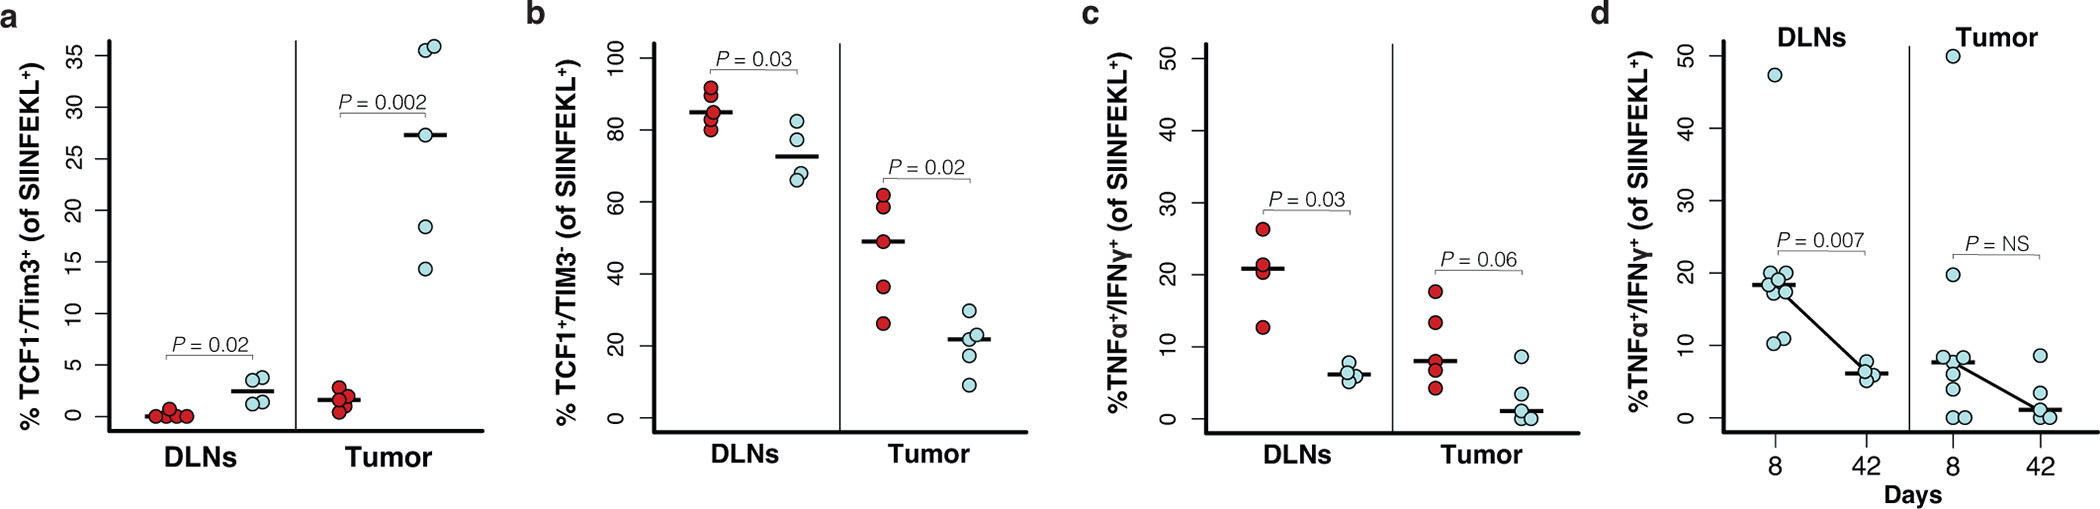
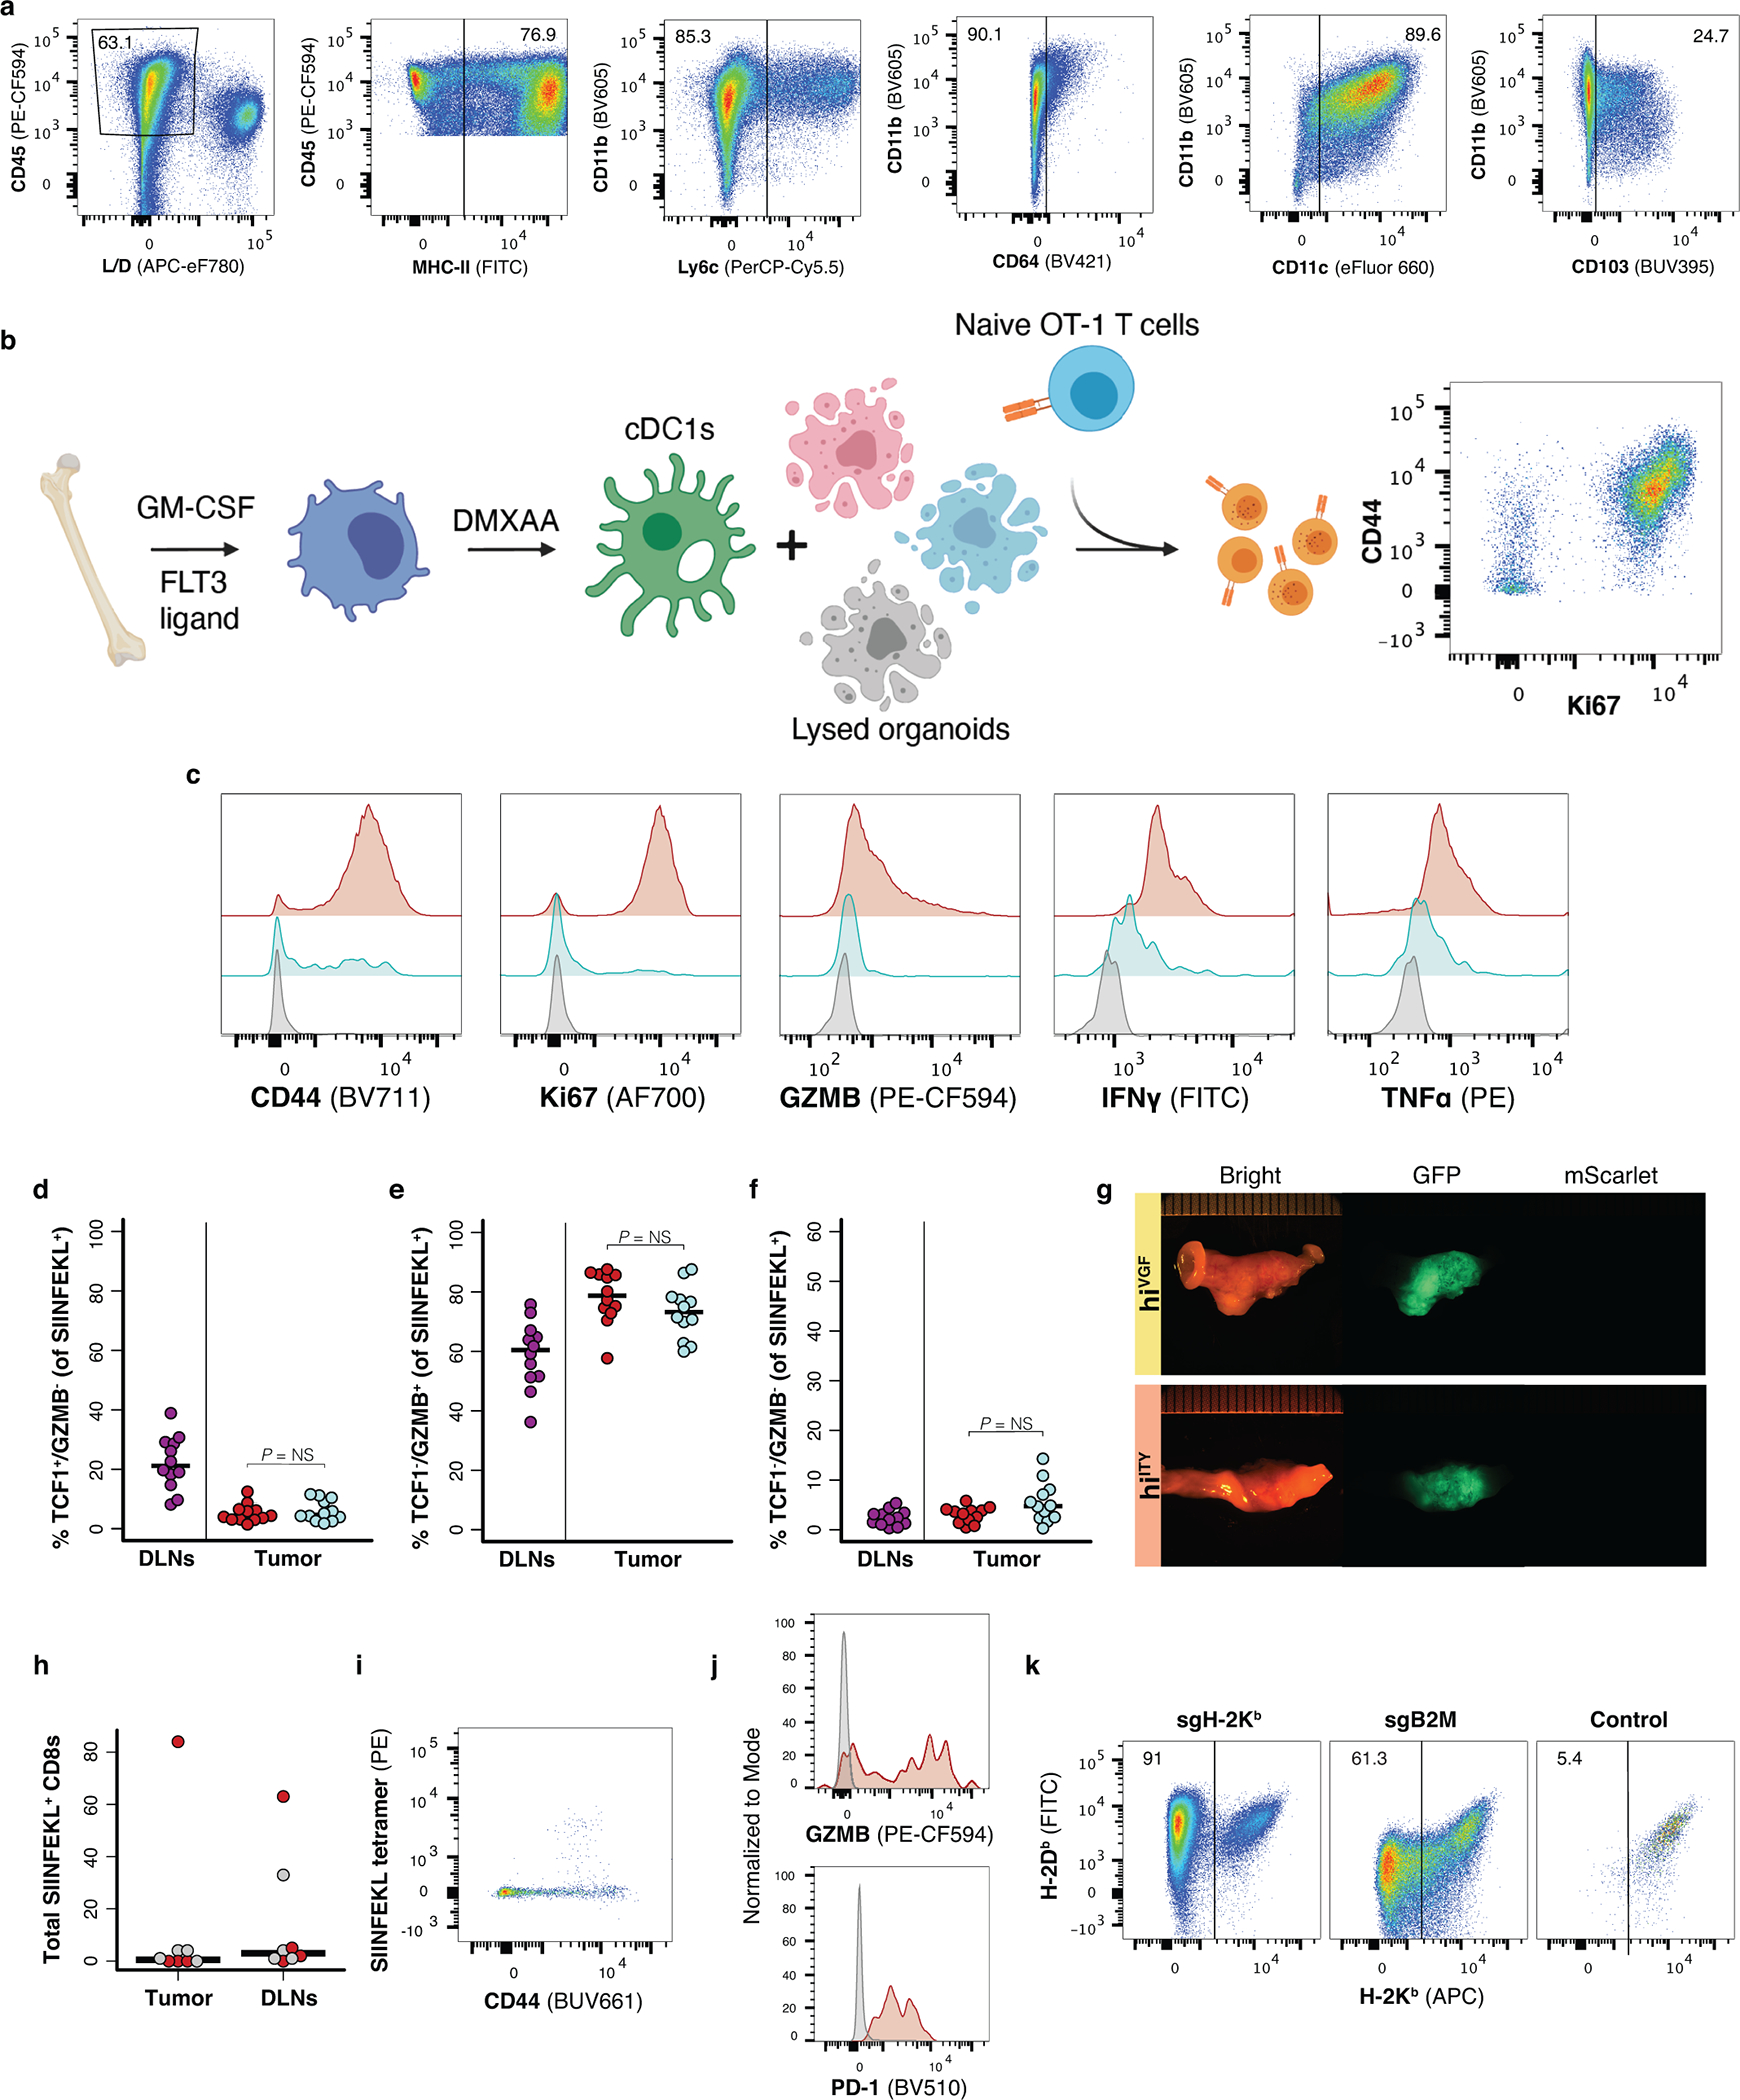
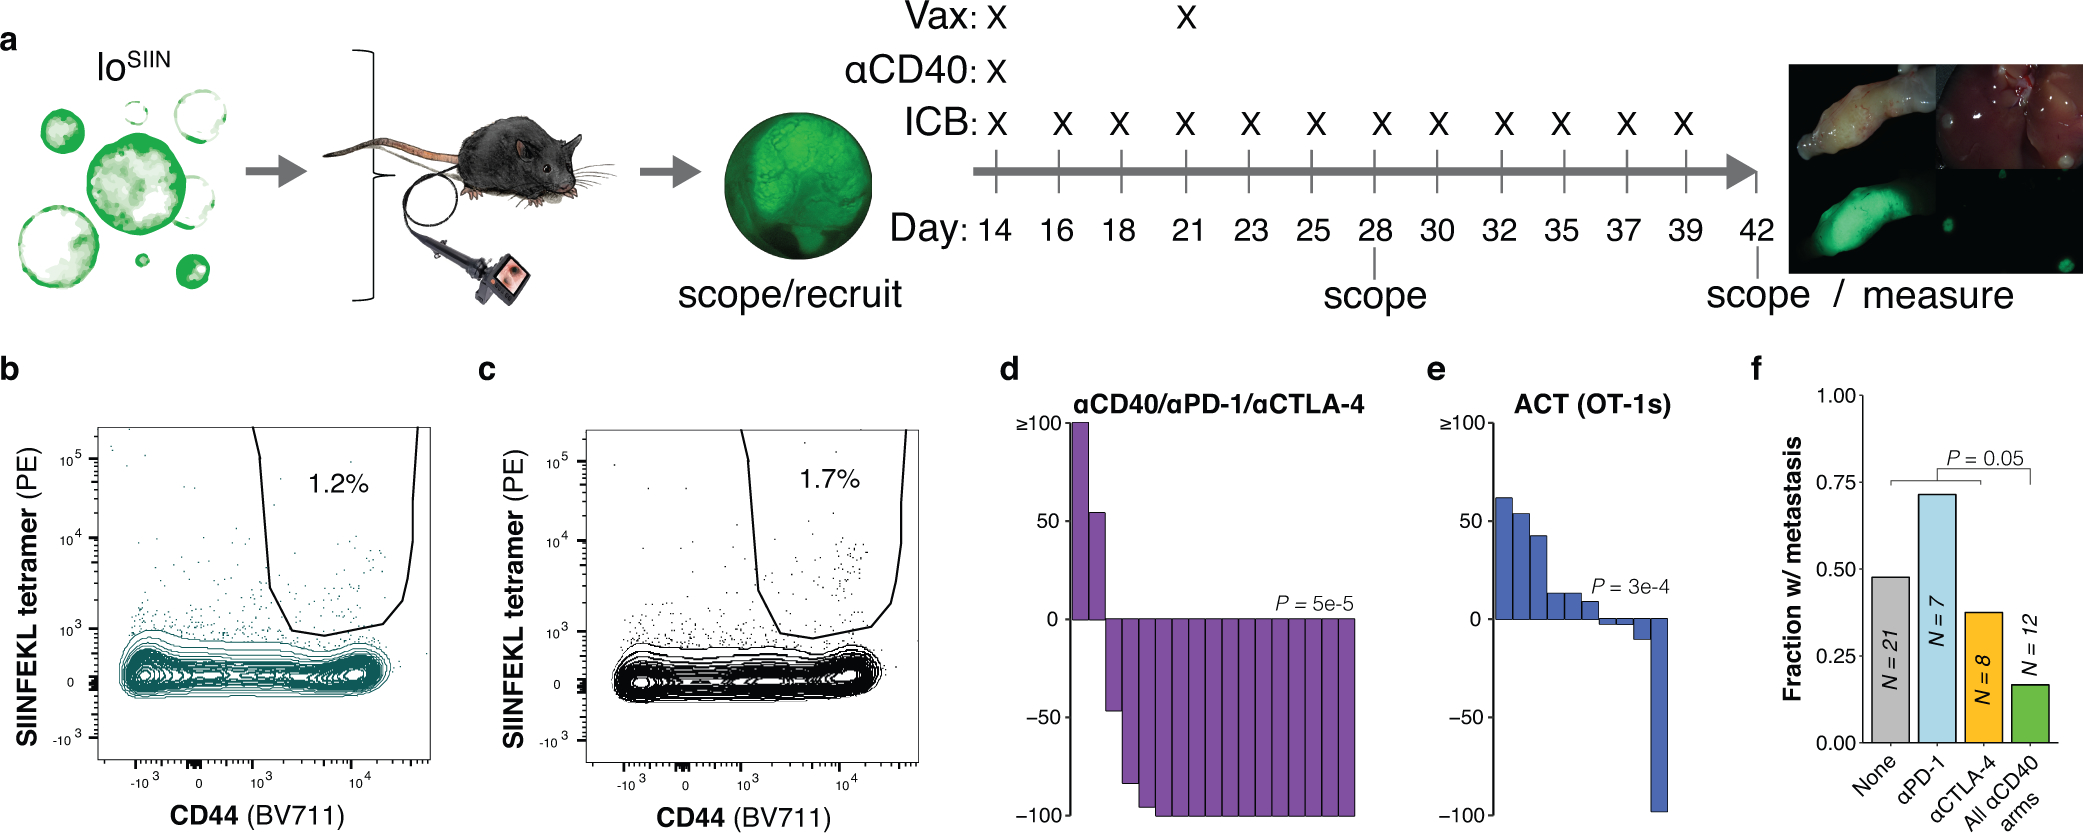
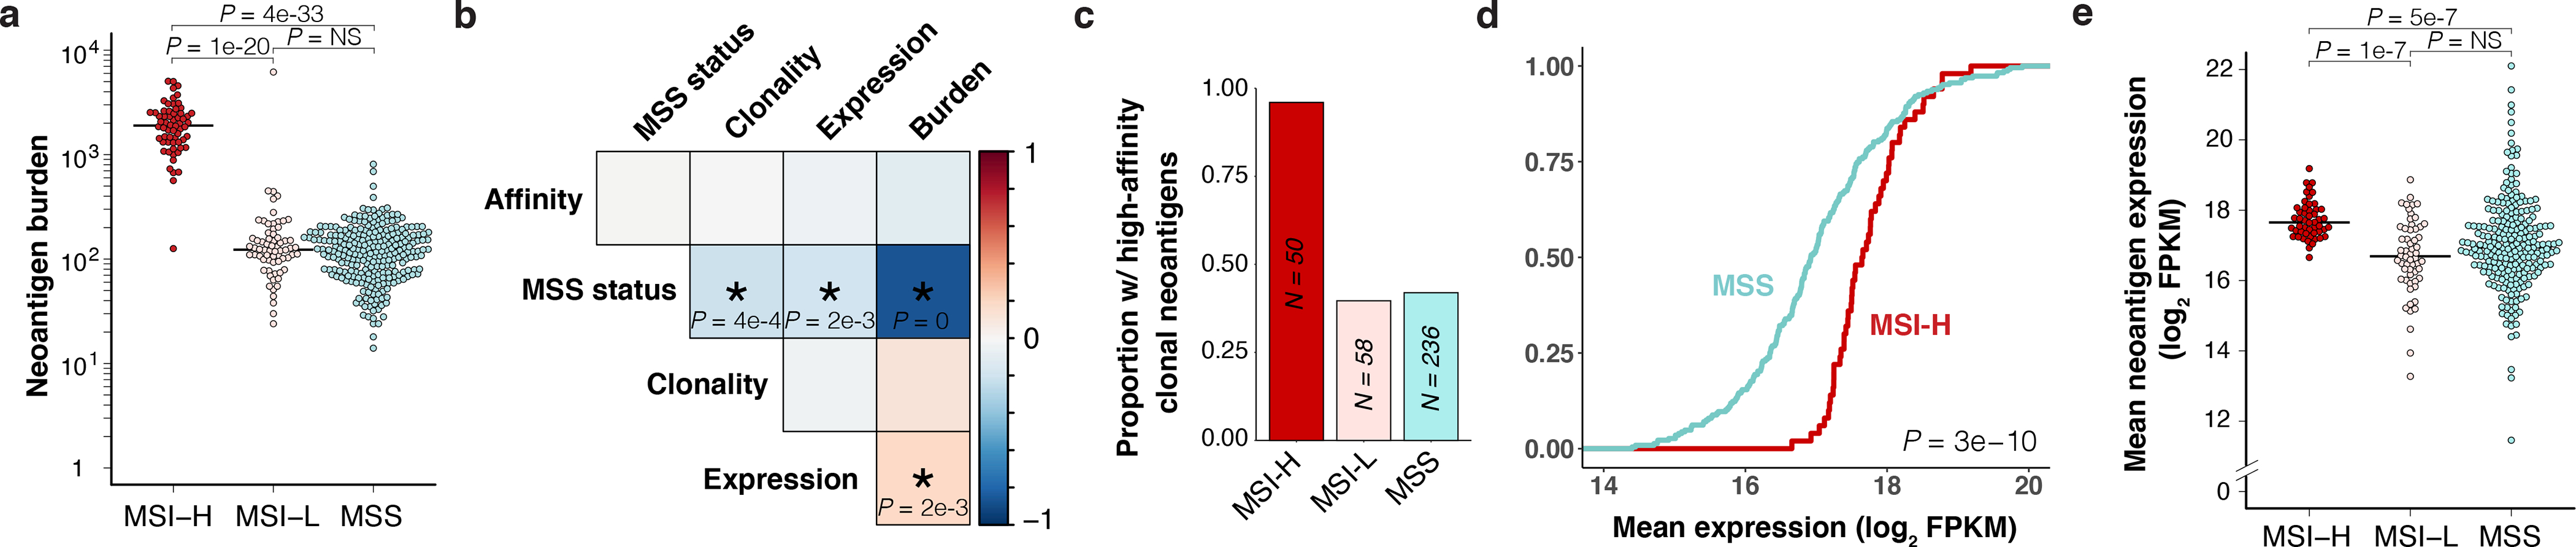
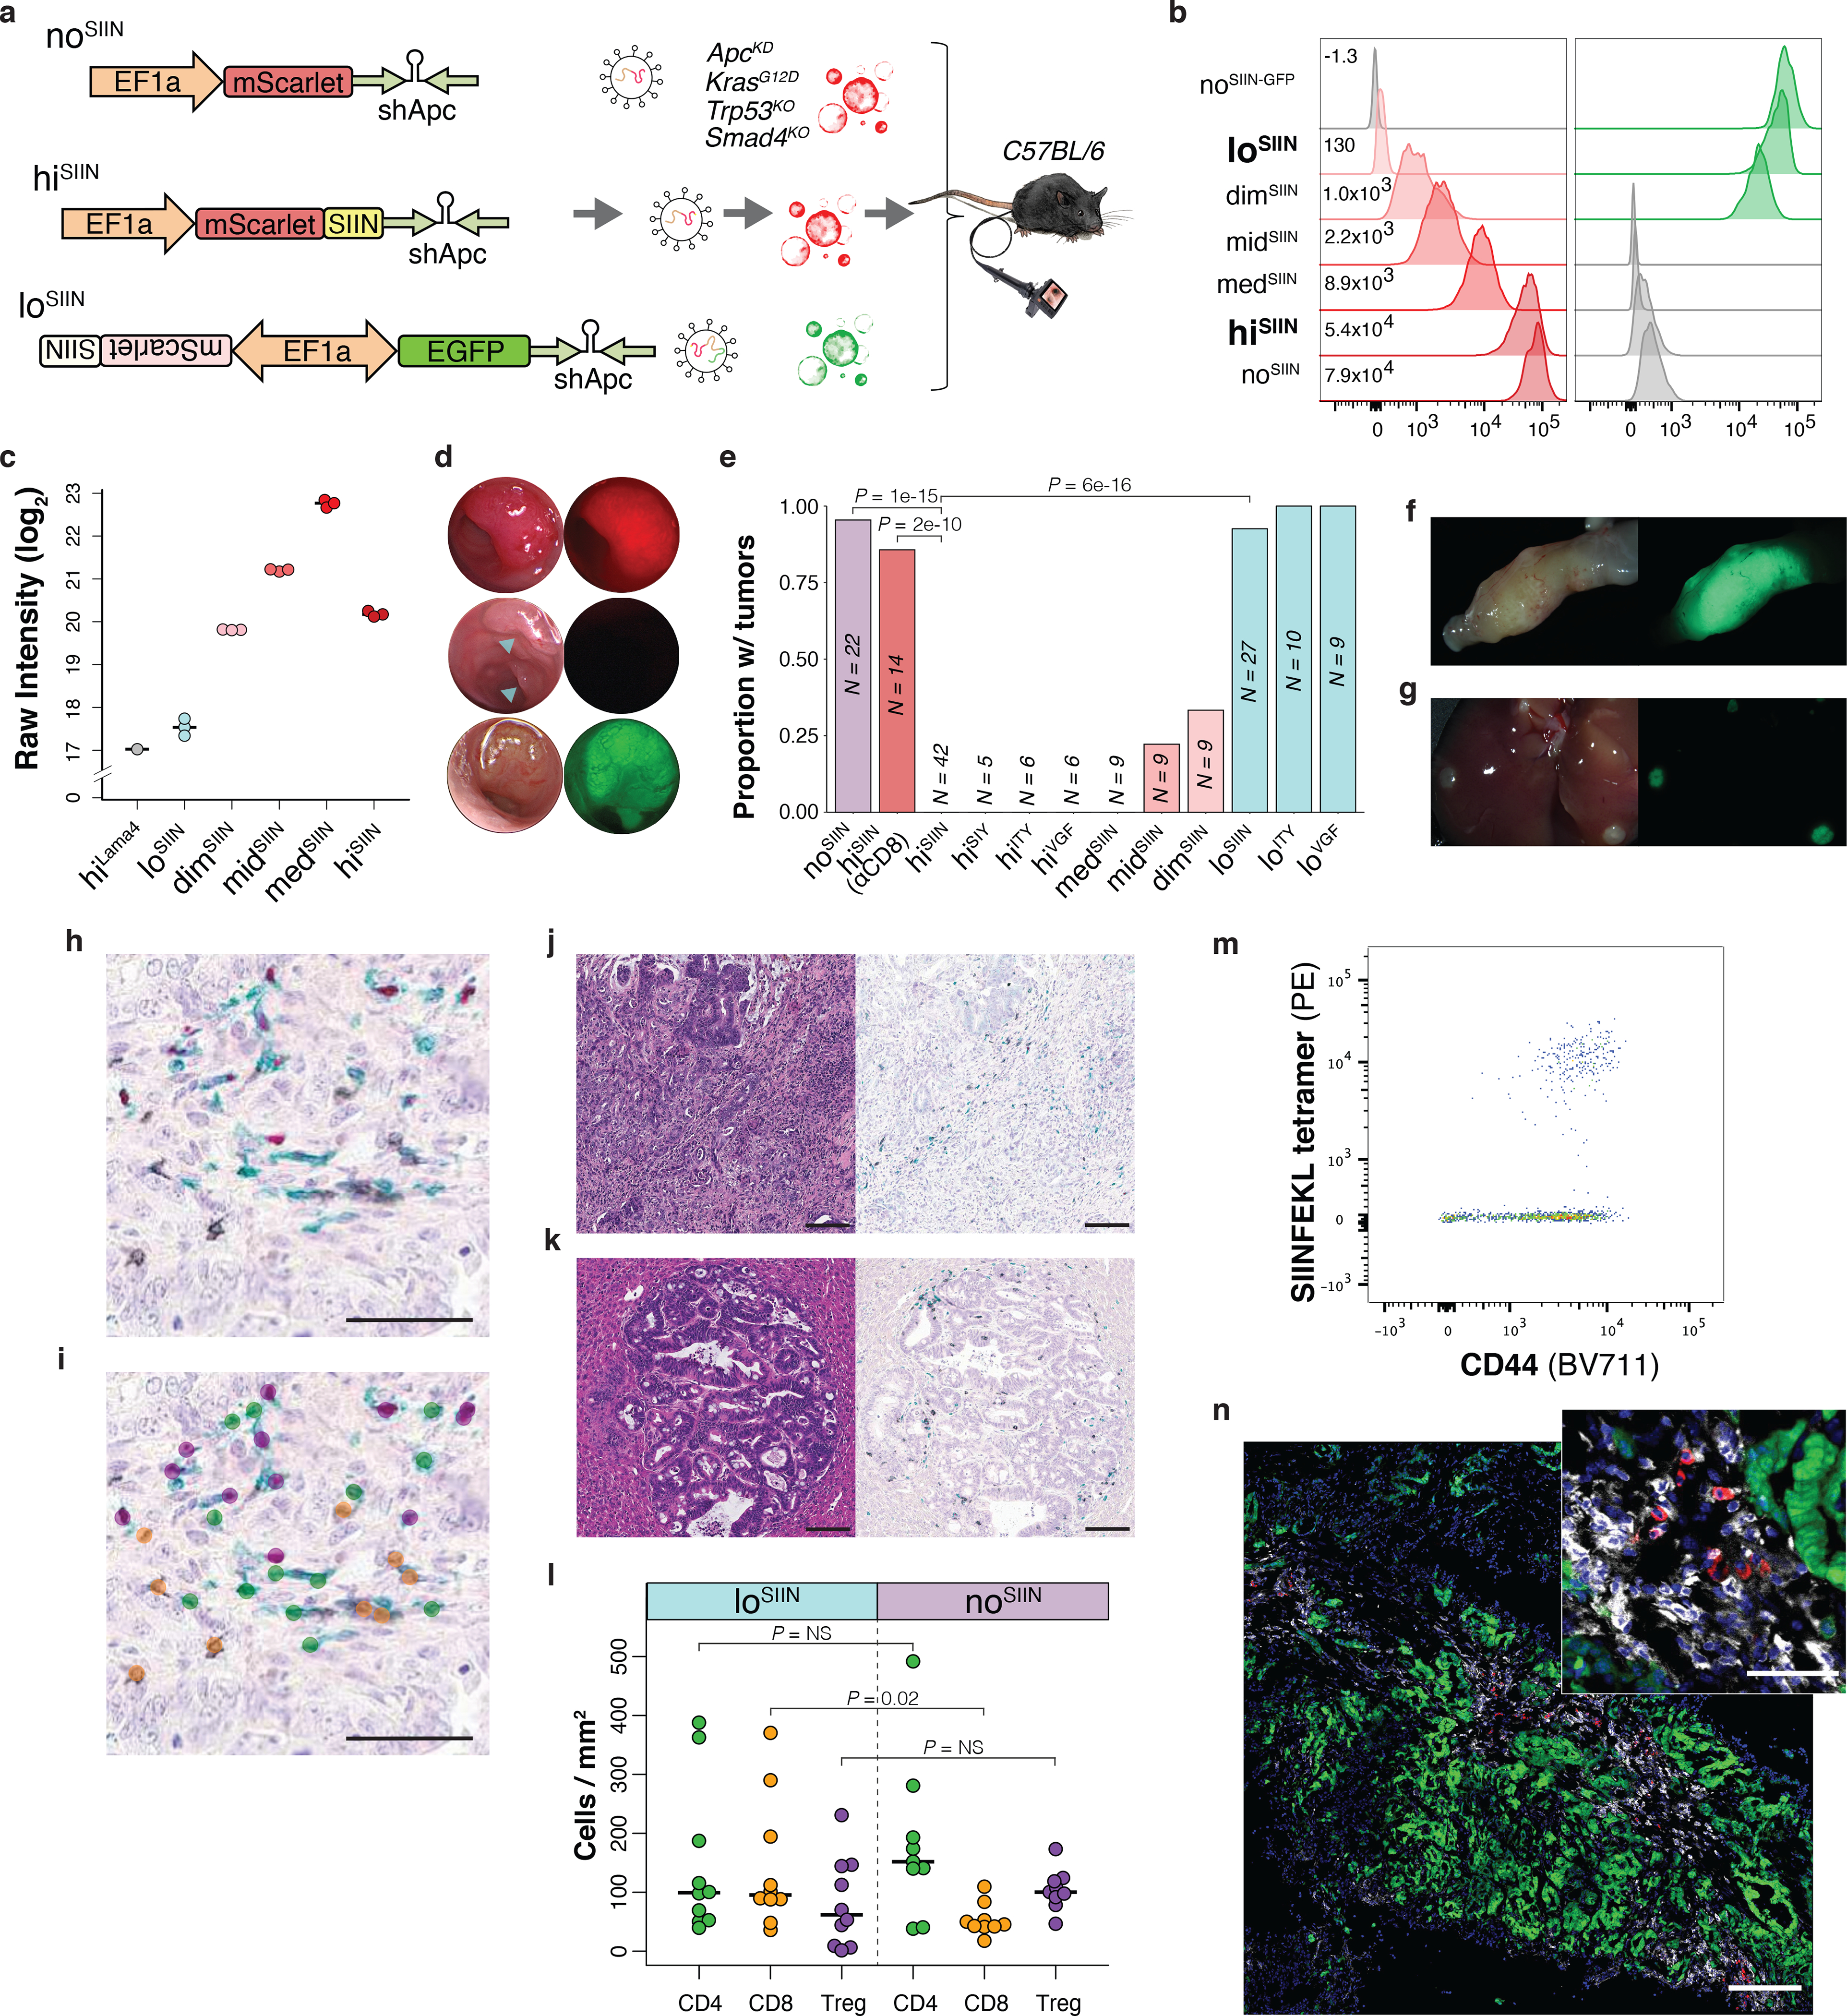
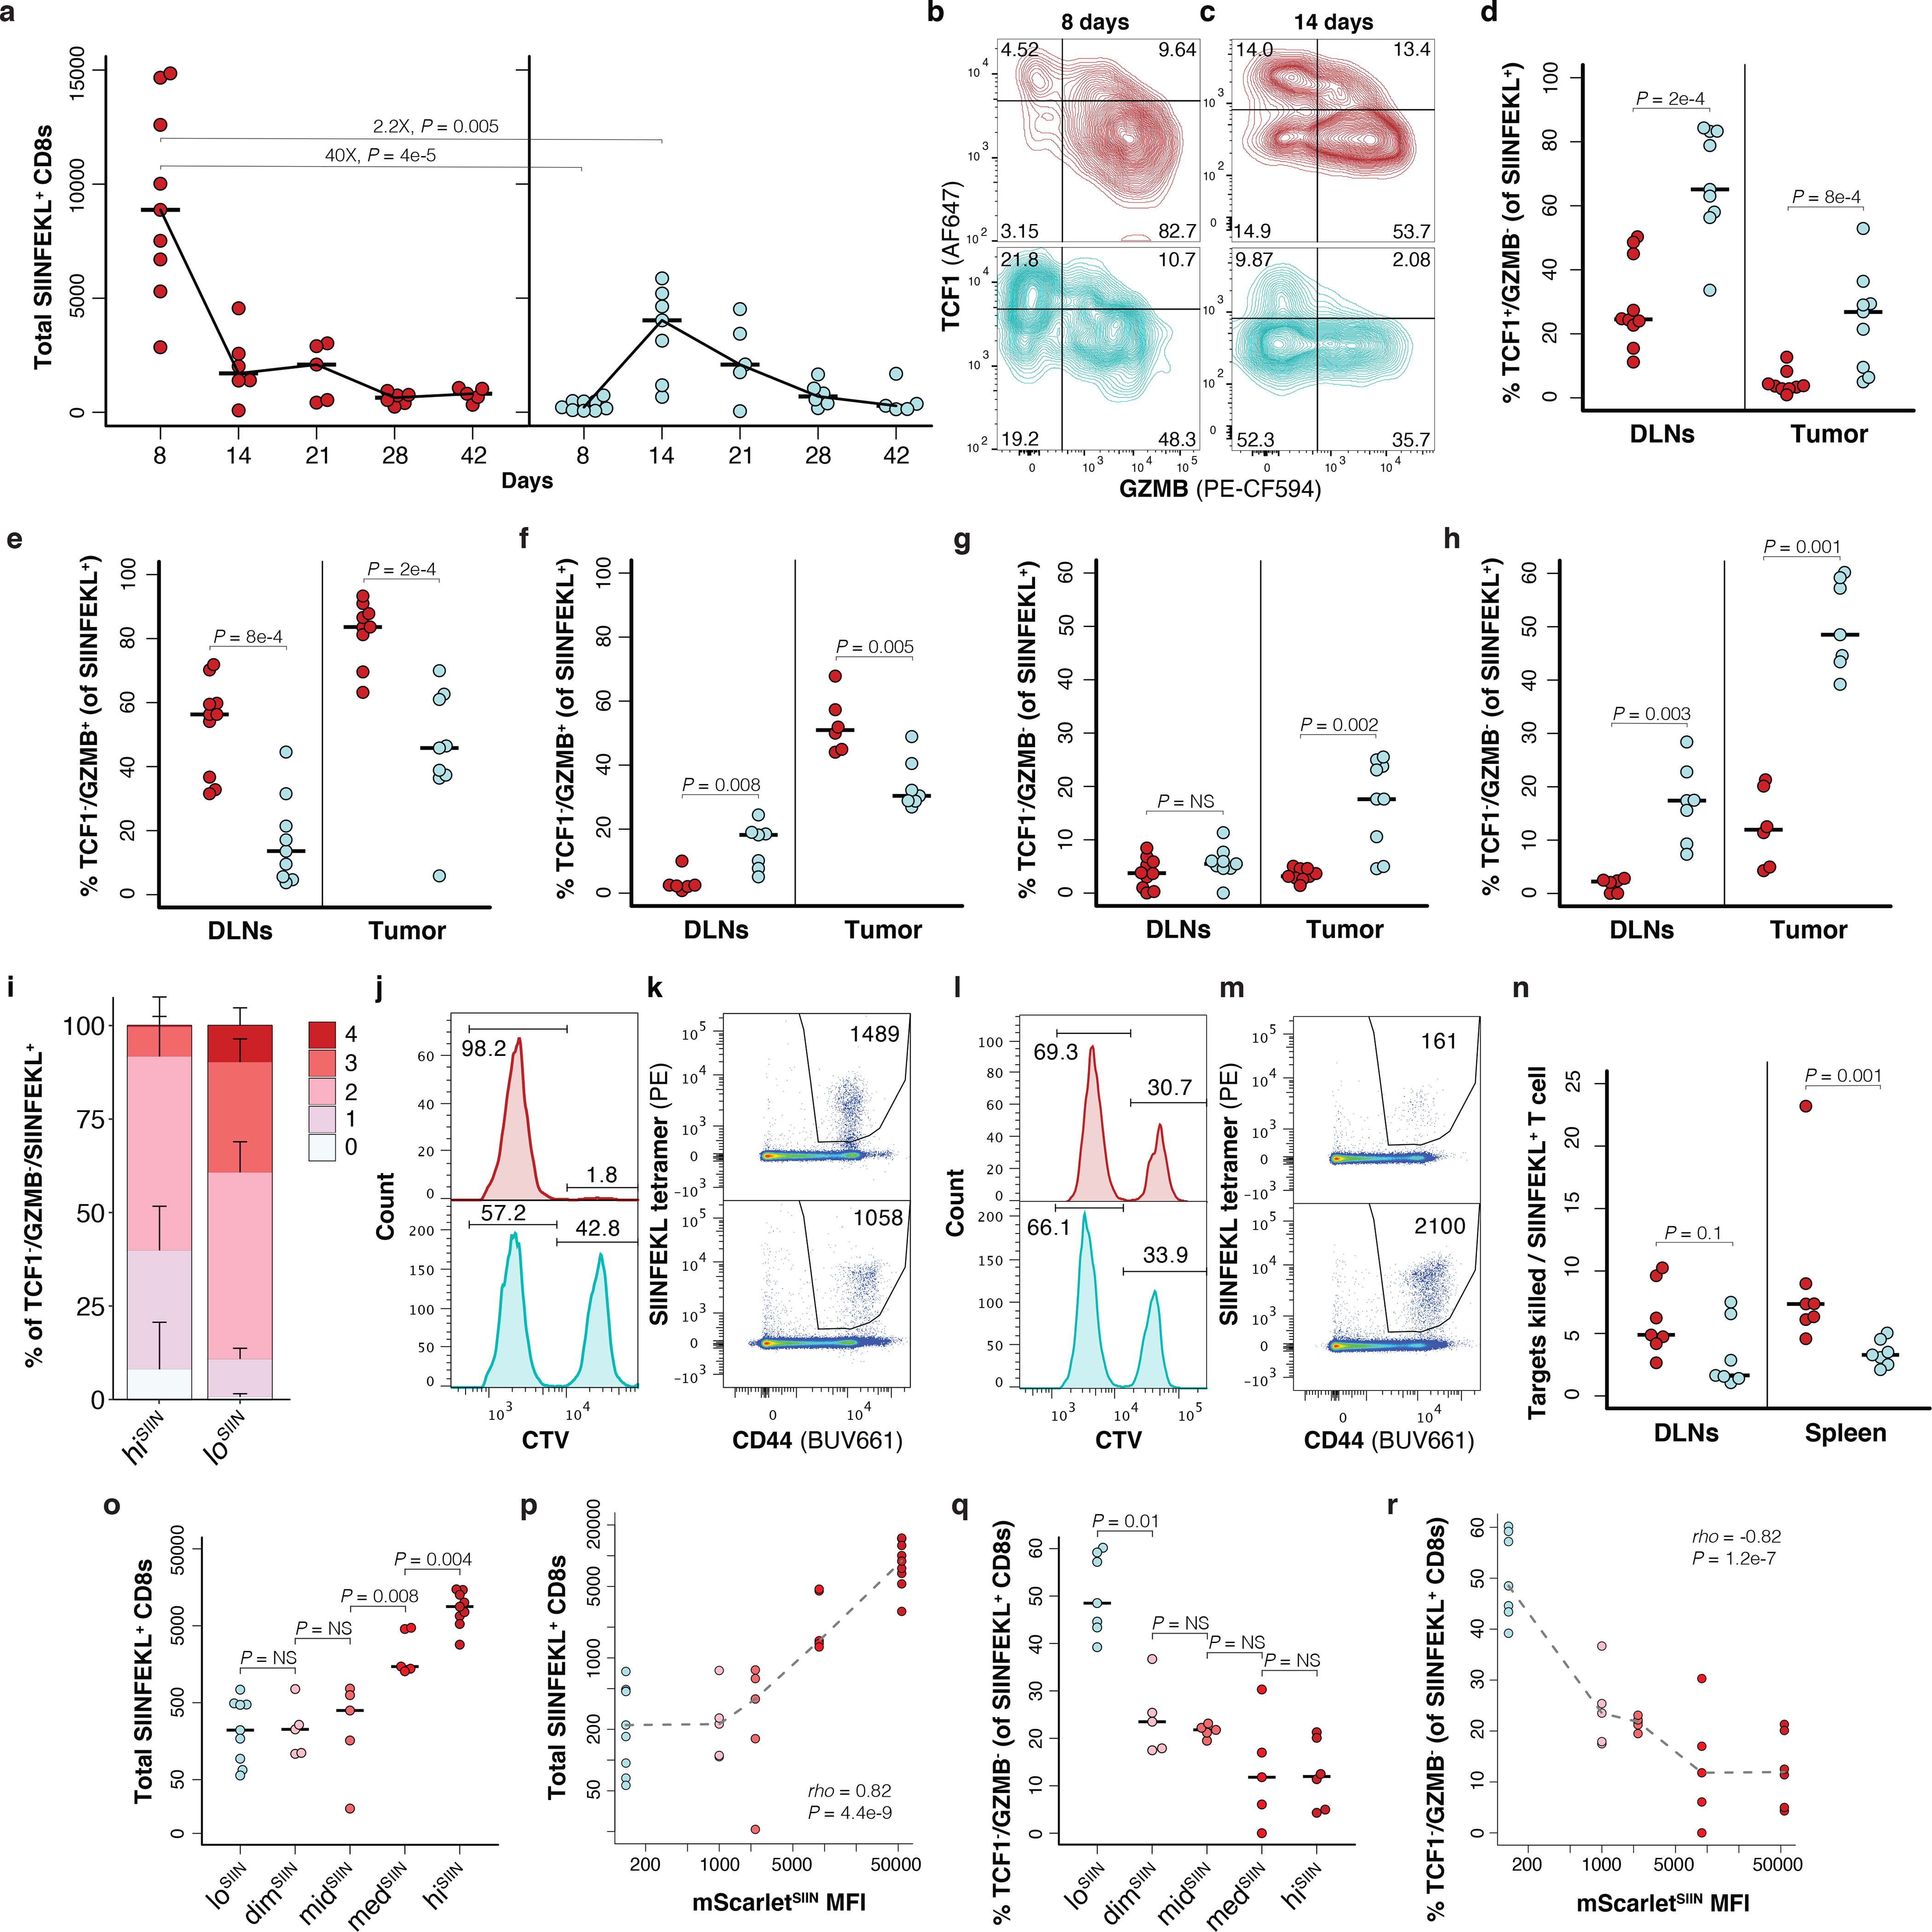
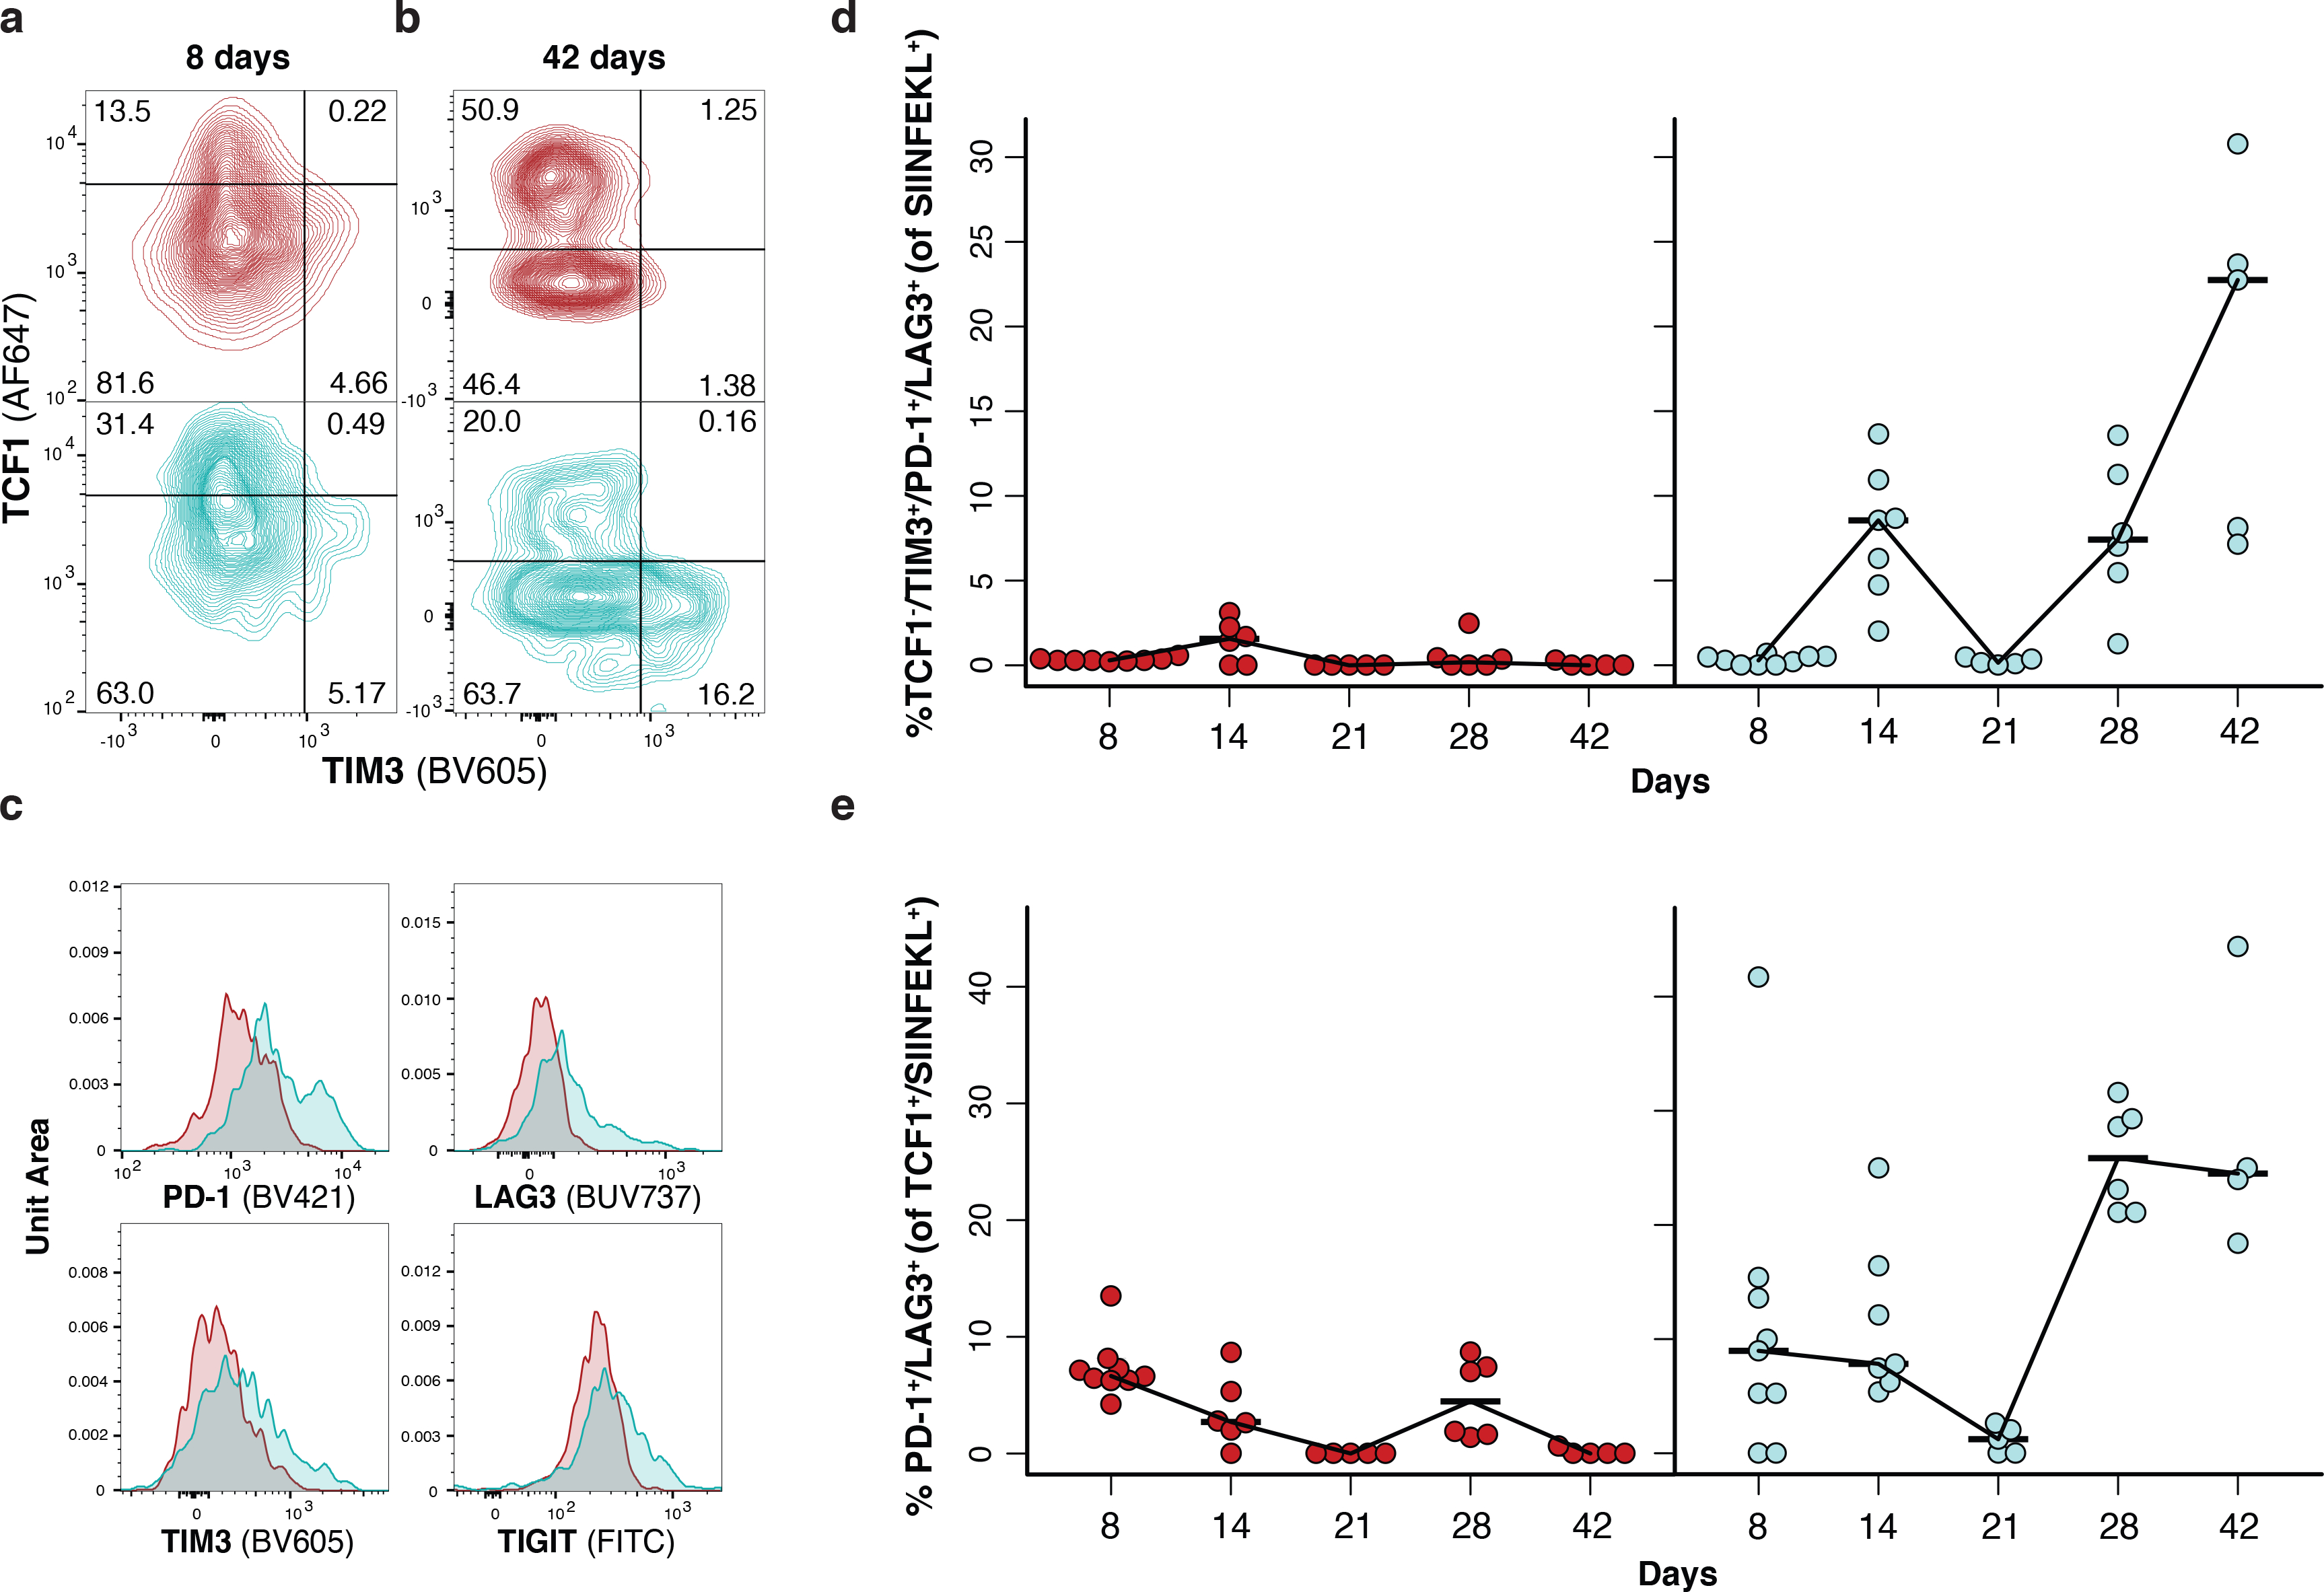
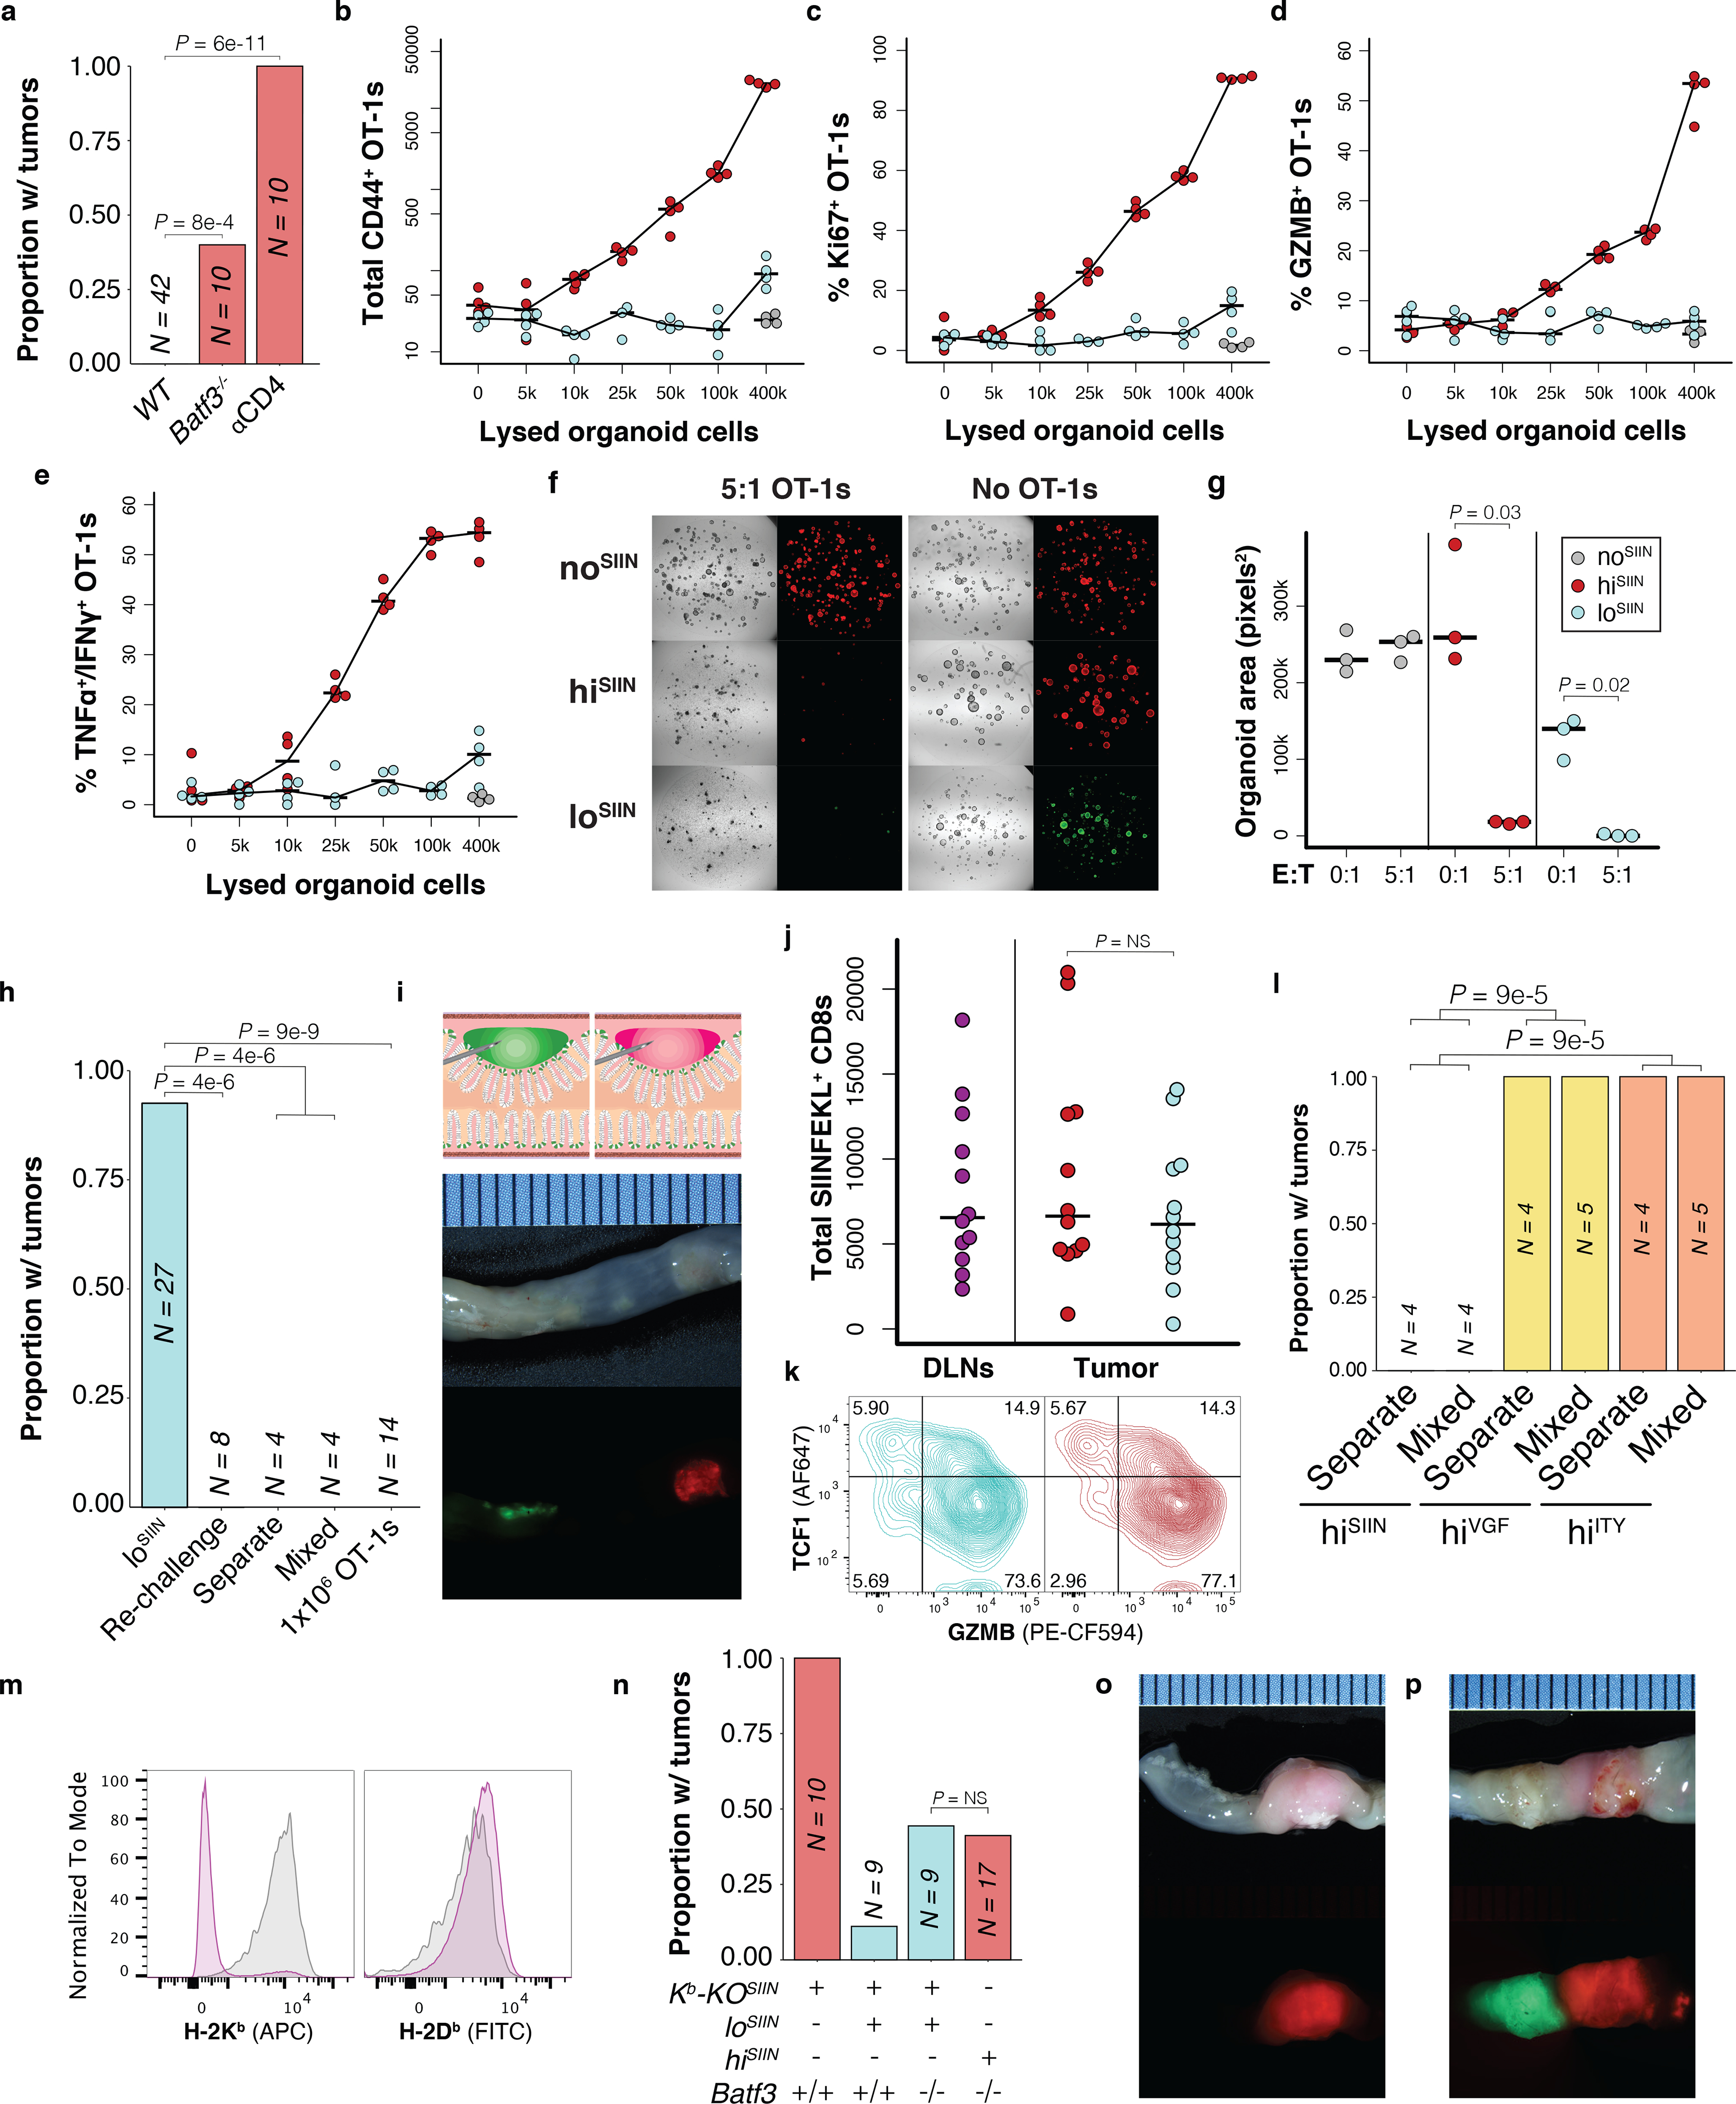
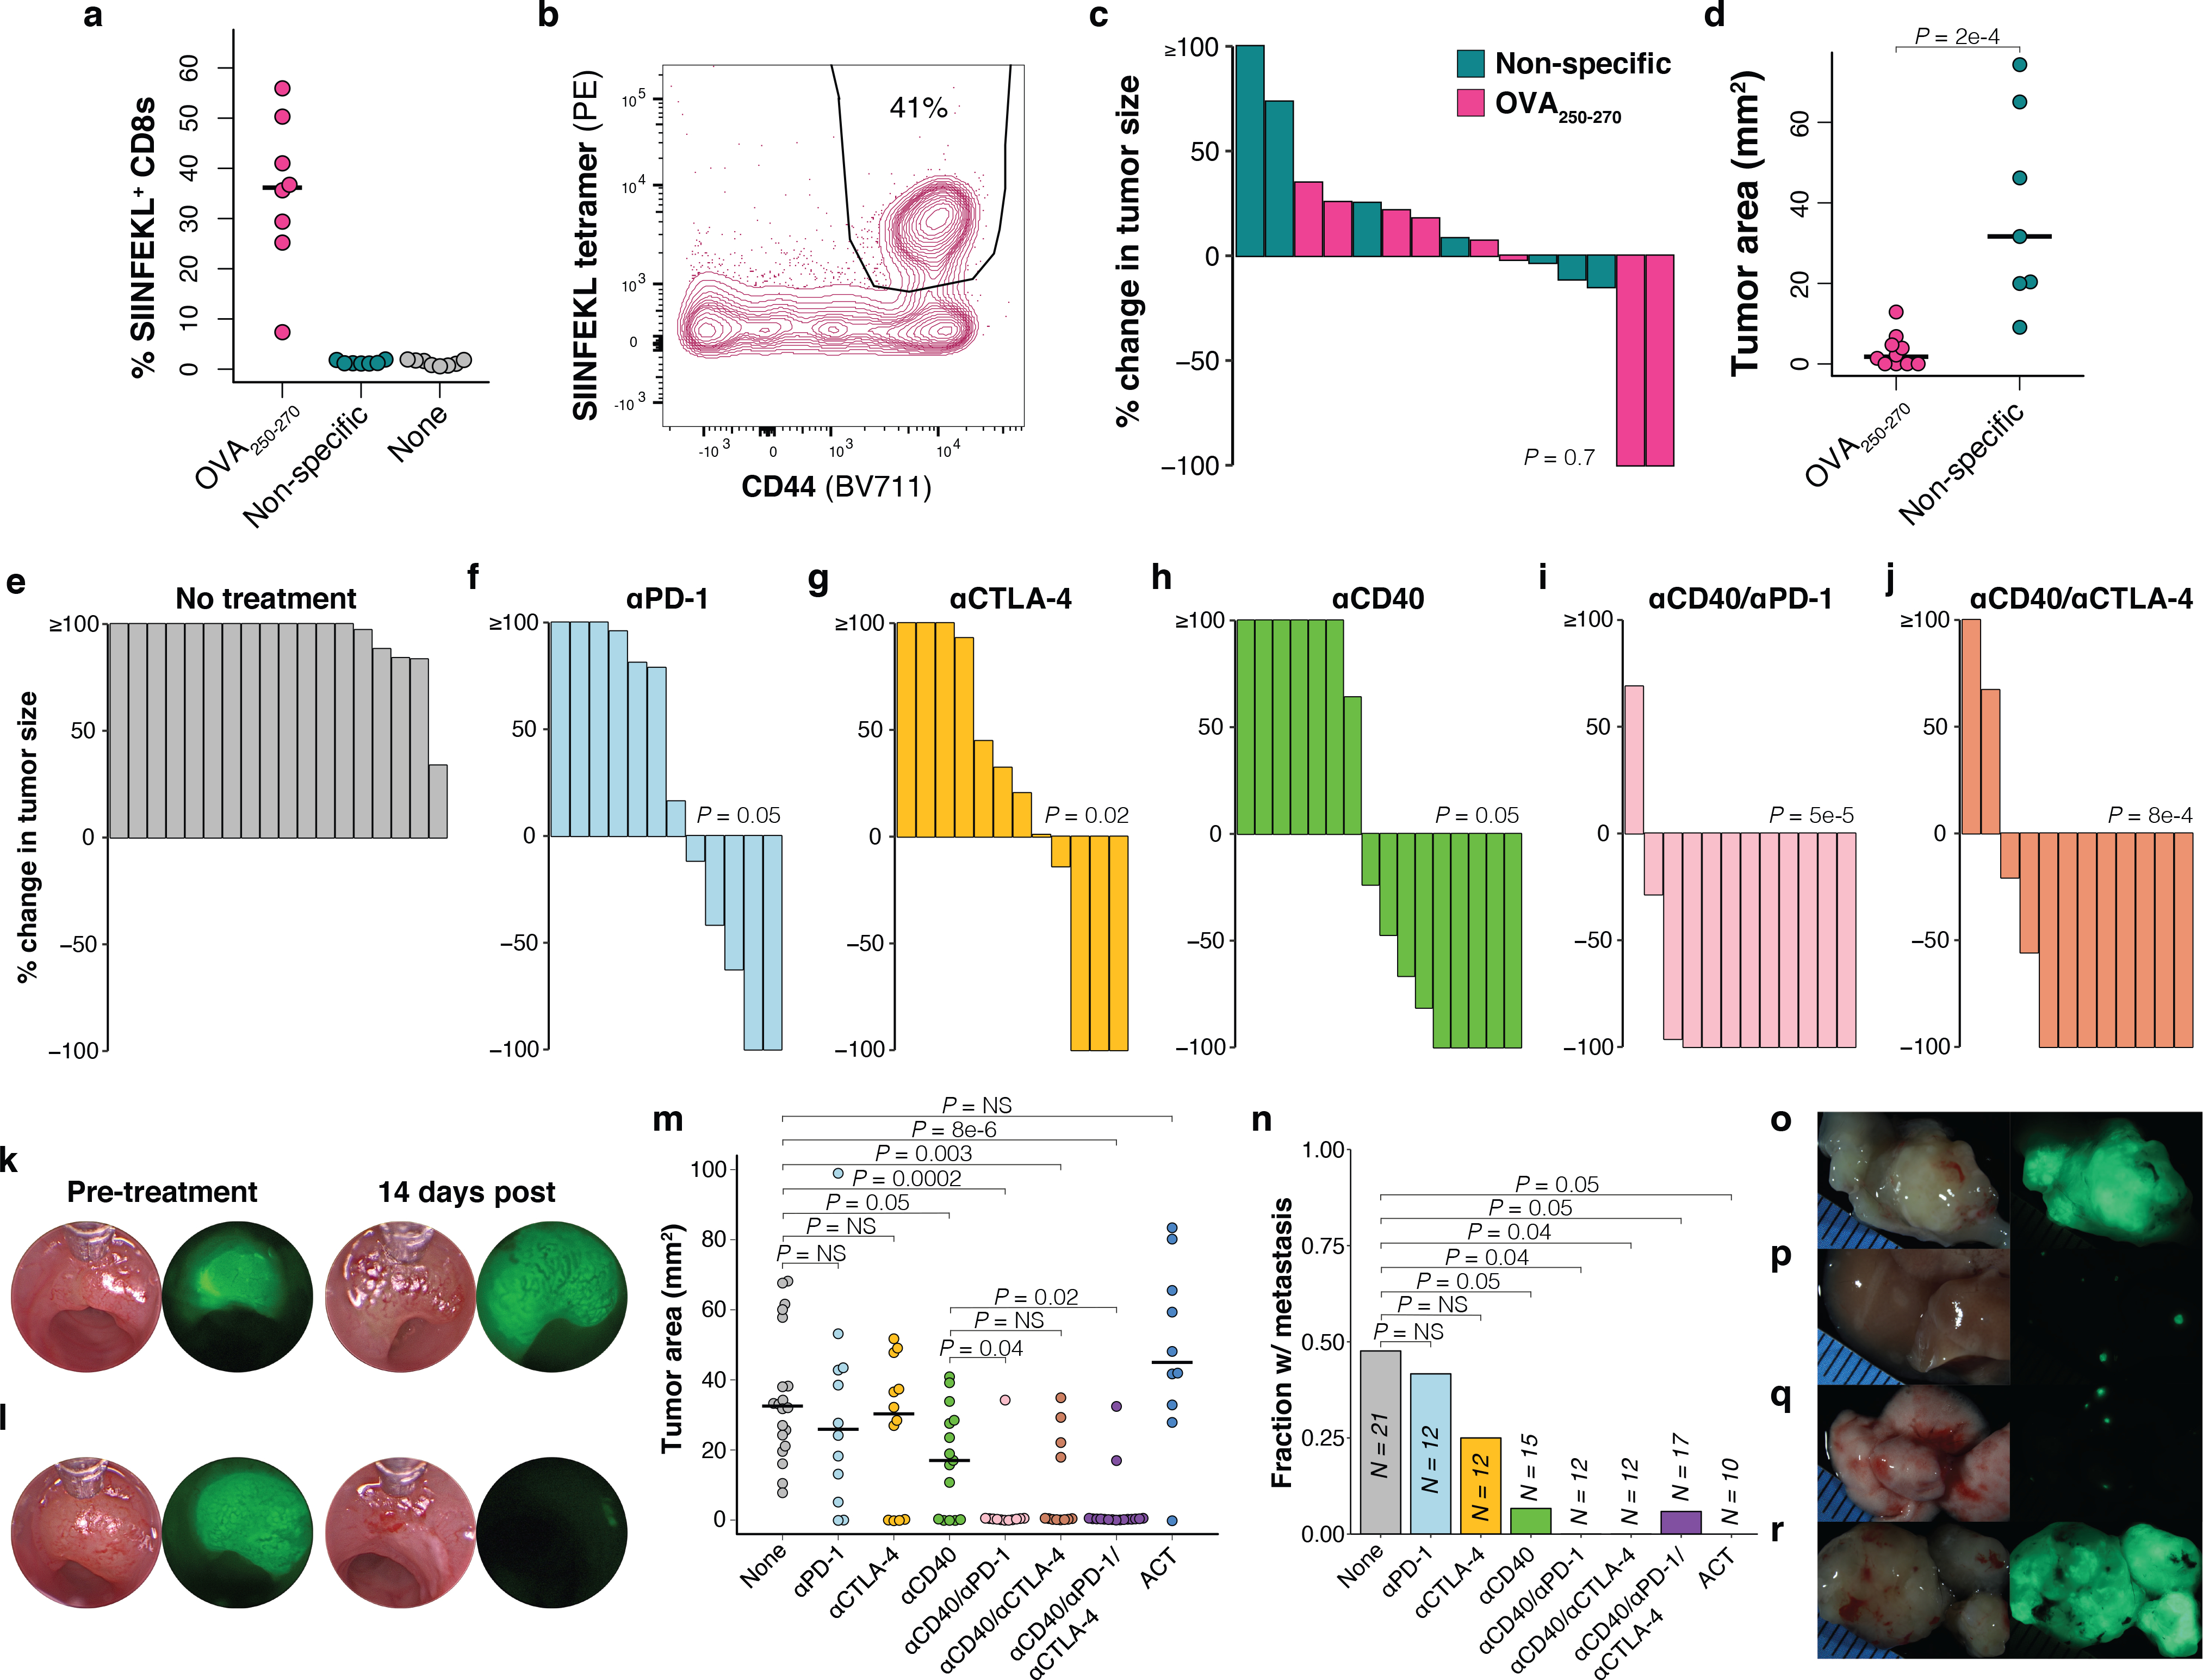
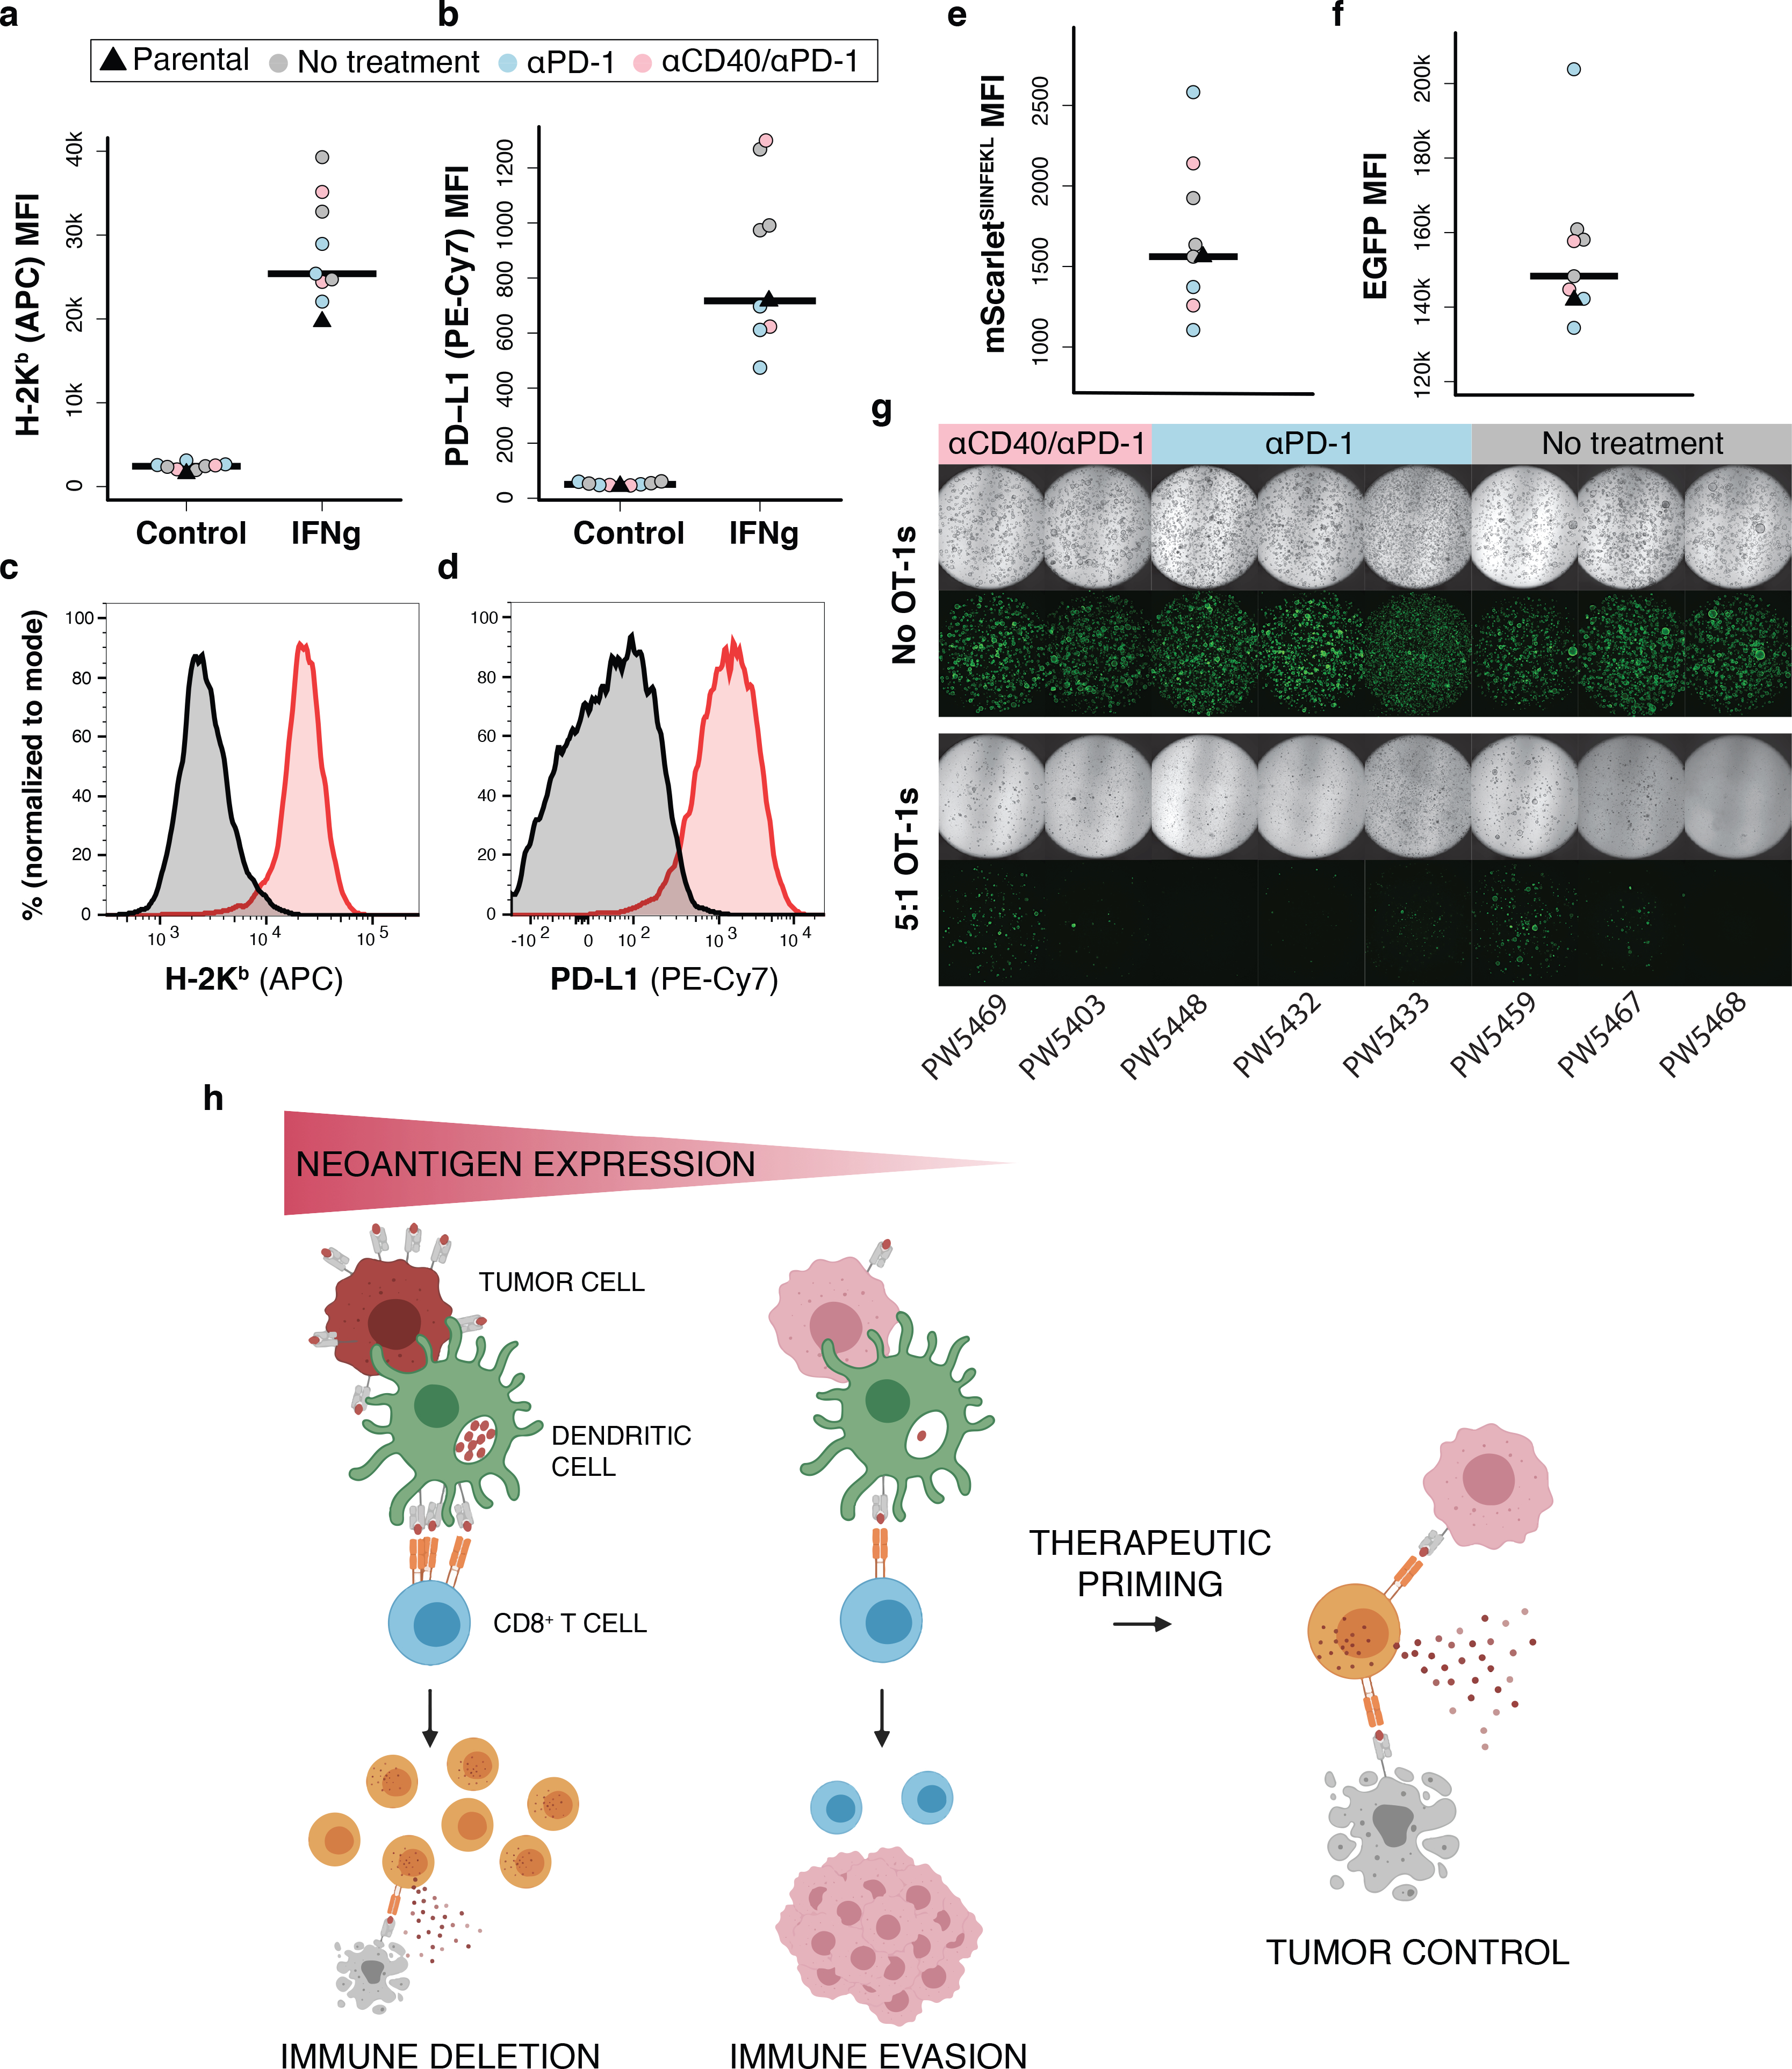
Immune evasion is a hallmark of cancer, and therapies that restore immune surveillance have proven highly effective in cancers with high tumor mutation burden (TMB) (e.g., those with microsatellite instability (MSI)). Whether low TMB cancers, which are largely refractory to immunotherapy, harbor potentially immunogenic neoantigens remains unclear. Here, we show that tumors from all patients with microsatellite stable (MSS) colorectal cancer (CRC) express clonal predicted neoantigens despite low TMB. Unexpectedly, these neoantigens are broadly expressed at lower levels compared to those in MSI CRC. Using a versatile platform for modulating neoantigen expression in CRC organoids and transplantation into the distal colon of mice, we show that low expression precludes productive cross priming and drives immediate T cell dysfunction. Strikingly, experimental or therapeutic rescue of priming rendered T cells capable of controlling tumors with low neoantigen expression. These findings underscore a critical role of neoantigen expression level in immune evasion and therapy response.


Figures

Extended Data Fig. 1:
Extended Data Fig. 1:. Lower burden and expression of predicted neoantigens in MSS versus MSI-H CRC
(a) Total expressed neoantigens by patient including hypermutant MSS cases (in purple). N = 62 MSI-H, 68 MSI-L, and 275 (including 9 hypermutant) MSS patients. All other plots exclude hypermutant MSS cases. (b) Mean expression of all neoantigens, regardless of clonality, by patient. N = 62 MSI-H, 68 MSI-L, and 266 MSS patients. (c-d) Analysis of patients with available ABSOLUTE purity for estimation of clonality (adjVAF). N = 50 MSI-H, 58 MSI-L, and 236 non-hypermutant MSS patients. (c) Empirical cumulative distribution function of mean neoantigen clonality (adjVAF) by patient. Significance was assessed by two-sided Kolmogorov-Smirnov test. (d) Total expressed clonal neoantigens with predicted HLA-I binding IC50 ≤ 500 nM by patient. (e) Mean allele-specific expression of clonal SNV-derived neoantigens by patient, excluding neoantigens with zero gene level expression but including those with zero allele-specific expression. N = 41 MSI-H, 53 MSI-L, and 219 MSS patients. (f-g) Abundance distributions of HLA-I ligandomes by MS in PDOs from MSS CRC patients CRC_01 (f) and CRC_04 (g) with epitope abundance above the median in grey, below the median in light blue, and neoantigens in red. Data from Newey, A, et al., 2019. Significance in (b), (d), and (e) was assessed by two-tailed Wilcoxon Rank Sum test with Holm’s correction for multiple comparisons. Source data for panels (a-e) can be found in Source Data Figure 1a–e.
Extended Data Fig. 2:
Extended Data Fig. 2:. Development of in vivo lentiviral and organoid models of CRC with neoantigen expression
(a) Lentiviruses used to initiate colon tumors in Apcflox/flox and Apcflox/flox; Rag2−/− mice. (b) Efficiency of tumor formation 16 weeks post-injection. N = independent animals. Significance assessed by two-tailed Wilcoxon Rank Sum with Holm’s correction for multiple comparisons. (c) Antigen expression in LucOS-induced tumors in Rag2−/− (left) and wild-type (right) mice at 12 weeks (colonoscopy above, bioluminescence below). (d) Efficiency of tumor induction with LucOS lentivirus at 20,000 and 100,000 transduction units (TU)/μl. N = 26 independent animals. (e) Antigen expression (bioluminescence). N = 26 independent animals. Significance assessed by two-tailed Wilcoxon Rank Sum. (f) Antigen expression in LucOS-induced tumors with continuous T cell depletion at 5 weeks (left) and 7 weeks after T cell depletion (right), and colonoscopy (above). (g) Antigen expression versus relative tumor size (percent of colon occluded) following withdrawal of depleting antibodies. N = 4 independent animals. (h) Correlation of antigen expression and tumor burden in Rag2−/− (dark pink) and αCD4/8 (light pink)-treated mice 12 weeks post-injection with LucOS. N = 17 independent animals. Significance measured by Spearman’s rank-order correlation. (i) noSIIN, hiSIIN, and loSIIN organoids grown in the absence of WNT. Scale bars = 1 mm. Representative of N = 3 independent cultures. (j) Top 10 mutated genes in MSK-IMPACT colon adenocarcinoma (cBioPortal). (k) Lentiviral constructs used to generate organoids expressing only EGFP (noSIIN-GFP) and SIINFEKL expression variants. (l) Linear regression with Pearson correlation of SIINFEKL abundance (TMT-MS) versus mScarletSIIN MFI (flow cytometry). TMT-MS was performed on three independent preparations of each line. (m) H&E and IHC of noSIIN primary colon tumor 42 days post-transplant. Representative of N = 9 independent animals. Scale bar = 100 μM. (n-o) Images of dimSIIN (n) and midSIIN (o) tumors that formed in N = 2/9 and 1/9 transplanted animals, respectively. (p) Lentiviral constructs used to generate organoids expressing SIYRYYGL, ITYTWTRL, and VGFNFRTL at high and low levels. (q) ITYTWTRL and VGFNFRTL tetramer-specific CD8+ T cells infiltrating 42-day loITY and loVGF tumors by flow cytometry. Representative of N = 10 loITY and 9 loVGF transplanted animals.
Extended Data Fig. 3:
Extended Data Fig. 3:. Low neoantigen expression drives reduced T cell function and diversity
(a-m) Flow cytometry of CD44+/CD8+ antigen-specific T cells from lesions and DLNs post-transplant of hiSIIN (red) and loSIIN (blue) organoids. (a) Total antigen-specific T cells and (b) percent Ki67 positive in DLNs at 8 days. N = 10 hiSIIN and 9 loSIIN-transplanted animals. (c-d) TCF1 and GZMB expression in antigen-specific T cells in lesions at 8 (c) and 14 (d) days. Representative of N = 59 animals per line and timepoint. (e) Percent of antigen-specific T cells double-positive for TNFα and IFNγ, and (f) and representative expression of TCF1 and GZMB in this subset within DLNs at 8 days. N = 10 hiSIIN and 9 loSIIN-transplanted animals. (g) Inhibitory receptor expression on TCF1-/GZMB- antigen-specific T cells from tumors at 14 days. Representative of N = 6–7 animals per line. (h) Median percent of TCF1-/GZMB- antigen-specific T cells from tumors expressing 0 through 4 inhibitory receptors (PD-1, TIM3, LAG3, and 2B4) at 8 days. N = 9 hiSIIN and 9 loSIIN-transplanted animals. Bars = standard deviation. (i-j) Percent of SIINFEKL-loaded “target” splenocytes killed in DLNs and spleens from killing assay at 8 (i) and 14 (j) days post-transplant of hiSIIN and loSIIN organoids. N = 6–7 animals per line and timepoint. (k-l) Frequency of most common clonotypes (k) and Simpson diversity score (l) from TCRβ chain sequencing of antigen-specific T cells from hiSIIN (down-sampled) and loSIIN lesions at 8 days. N = 4 independent animals per line. (m-n) Total antigen-specific T cells isolated from lesions at 14 days across all lines (m) and versus mScarletSIIN MFI (n). (o-p) Percent of antigen-specific T cells from lesions at 8 days double-negative for TCF1 and GZMB across lines (o) and versus mScarletSIIN MFI (p). Dashed lines connect medians. Significance assessed by Spearman’s rank correlation. N = 5–9 independent animals per line in (m-p). Significance in (a-b), (e), (i-j), (l-m) and (o) assessed by two-tailed Wilcoxon Rank Sum. Holm’s correction applied in (m) and (o). Source data for panels (a, h-j, m-p) can be found in Source Data Figure 3a, i, n–r.
Extended Data Fig. 4:
Extended Data Fig. 4:. T cells in tumors with low neoantigen expression lose effector function over time
(a-b) Percent of antigen-specific T cells from DLNs and tumors at 42 days negative for TCF1 and positive for TIM3 (a), and positive for TCF1 and negative for TIM3 (b) by flow cytometry. N = 4–5 independent animals per line. (c-d) Percent of antigen-specific T cells from DLNs and tumors double-positive for TNFα and IFNγ at 42 days (N = 4–5 independent animals per line) (c) and both 8 and 42 days (d) (N = 4–9 independent animals per line). Red = hiSIIN, blue = loSIIN. Significance in (a-d) was assessed by Wilcoxon Rank Sum. Source data for panels (a-d) can be found in Source Data Figure 4d–e.
Extended Data Fig. 5:
Extended Data Fig. 5:. Neoantigen expression is limiting for cross priming by canonical and noncanonical antigen-presenting cells
(a) Flow cytometry gating strategy to determine percentage of CD11c+/CD103+ DC1s in BM-DC culture. (b) Schematic of BM-DC isolation, activation, and co-culture with naïve OT-1s. (c) Histograms of CD44, Ki67, GZMB, TNFα, and IFNγ expression on OT-1s representative of N = 4 co-cultures in the 400,000 lysed organoid cells condition. (d-f) Flow cytometric analysis of antigen-specific T cells from DLNs and lesions 8 days post-co-transplant of hiSIIN (red) and loSIIN (blue) organoids at separate sites. Percent TCF1+/GZMB- (d), TCF1-/GZMB+ (e), and TCF1-/GZMB- (f). N = 12 animals. Significance assessed by two-tailed Wilcoxon Rank Sum. (g) Brightfield and fluorescent images of colons and tumors 6 weeks post co-transplant of loSIIN and hiVGF or hiITY, representative of N = 9 animals each. (h-j) Flow cytometric analysis of antigen-specific (CD44+/SIINFEKL+) CD8s in colon and DLNs 6 weeks post-transplant of hiSIIN in Batf3−/− mice. (h) Total SIINFEKL+ CD8s, with progressive tumors in grey (N = 4 animals) and rejected lesions in red (N = 4 animals). (i) Flow plot of SIINFEKL+ CD8s infiltrating rejected lesion, and (j) PD-1 and GZMB expression on CD44+/SIINFEKL+ CD8s (red) versus CD44- CD8s (grey) from rejected lesion representative of N = 4 animals. (k) Flow plots of H-2Kb/H-2Db expression on hiSIIN organoids post electroporation with Cas9 complexes targeting H2-k1 and B2m, or untargeted control (pre-sorting). Organoids were pre-treated with IFNγ. N = 1 experiment. Source data for panels (d-f) can be found in Source Data Figure 5j.
Extended Data Fig. 6:
Extended Data Fig. 6:. Design of preclinical trials to test therapies that rescue priming in low neoantigen expressing tumors
(a) Schematic of vaccination and immunotherapy preclinical trial design and dosing schedule. (b-c) Flow plots of peripheral blood antigen-specific (CD44+/SIINFEKL tetramer+) CD8+ T cells from non-specific peptide-based vaccination (b) and no vaccination control (c) mice, representative of N = 7 and 8 independent animals, respectively. (d-e) Change in tumor size after 14 days of treatment, as determined by colonoscopy. ACT = adoptive cell transfer of OT-1s. N = 17 (d) and 10 (e) independent animals. Significance assessed by Wilcoxon Rank Sum of percent change in tumor size of treatment group versus no treatment, with Holm’s correction. (f) Fraction of mice with any metastases (liver, lung, or omentum), including only mice with progressive primary disease. N = independent animals. Significance assessed by 2×2 Fisher’s exact test of number of mice with metastases across all αCD40 treatment arms (with and without ICB) versus all other arms (no treatment and ICB single agent arms). Source data for panels (d-e) can be found in Source Data Figure 6e–j, m.
Figure 1
Figure 1
MSS CRC harbors both lower burden and expression of predicted neoantigens. Analysis of predicted neoantigens in human CRC (TCGA COADREAD) with high MSI (MSI-H), low MSI (MSI-L), and MSS. (a) Total expressed neoantigens with strong predicted HLA-I binding (IC50 ≤ 500 nM) by patient. N = 62 MSI-H, 68 MSI-L, and 266 non-hypermutant MSS patients. (b-e) Analysis of patients with available ABSOLUTE purity for estimation of clonality (adjVAF). N = 50 MSI-H, 58 MSI-L, and 236 non-hypermutant MSS patients. (b) Spearman rank correlation matrix of MSS status (MSS versus MSI-H) and mean neoantigen expression, predicted affinity, burden, and clonality by patient. Strength of correlation is represented by color scale (red = positive, blue = negative), and significance is indicated by asterisk with P-values displayed. (c) Proportion of patients expressing at least one clonal (adjVAF ≥ 0.5) neoantigen with very strong predicted binding affinity (IC50 ≤ 10 nM). (d) Empirical cumulative distribution function of mean neoantigen expression by patient, showing enrichment of lower expression in MSS patients. Significance assessed by two-sided Kolmogorov-Smirnov test. (e) Mean expression of clonal neoantigens by patient (FPKM, upper quartile-normalized). Significance in (a) and (e) was assessed by two-tailed Wilcoxon Rank Sum test with Holm’s correction for multiple comparisons.
Figure 2
Figure 2
Development of an organoid system to interrogate neoantigen expression level in CRC. (a) shApc-expressing lentiviruses used to transform KP organoids, with no (noSIIN), high (hiSIIN) and low (loSIIN) expression of SIINFEKL. Resulting shAKPS organoids were orthotopically-transplanted into the colons of syngeneic mice. (b) Expression of mScarlet/mScarletSIIN and EGFP in expression variant organoids by flow cytometry. Experiment was performed three times with consistent results. (c) TMT-MS quantification of MHC-I bound SIINFEKL across three independent preparations of each line. (d) Colonoscopy images of noSIIN tumor (RFP channel), hiSIIN scars (RFP channel, blue arrows indicate injection sites), and loSIIN tumor (GFP channel) 28 days post-transplant. Representative of animals in (e). (e) Efficiency of tumor formation 42 days post-transplant with the lines indicated. αCD8 = continuous antibody depletion of CD8+ T cells. Significance assessed by 2×2 Fisher’s exact test with Holm’s correction for multiple comparisons. N = independent animals. (f-g) Stereoscopic brightfield and fluorescent images of loSIIN colon tumor (f) and liver metastases (g) 42 days post-transplant. Representative of animals transplanted in (e). (h-i) Three color IHC (black = CD8, green = CD4, red = FOXP3) (h) and automated annotation by convolutional neural network (i). Scale bars = 50 μM. (j-k) H&E and three color IHC of loSIIN primary colon tumor (j) and liver metastasis (k) 42 days post-transplant. Scale bars = 100 μM. Representative of animals in (l). (l) Quantification of CD8, CD4, and regulatory T cells infiltrating loSIIN and noSIIN tumors by convoluted neural network analysis. Each point represents at least one tumor from a single animal. N = 10 loSIIN and 9 noSIIN transplanted animals. Significance assessed by two-tailed Wilcoxon Rank Sum with Holm’s correction for multiple comparisons. (m-n) Identification of SIINFEKL tetramer-specific CD8+ T cells infiltrating 42-day loSIIN tumors by flow cytometry (m) and immunofluorescence (n) with in situ tetramer staining (green = tumor, white = CD8, red = SIINFEKL tetramer, blue = DAPI). Scale bar = 200 μM in main image, and 50 μM in zoom inset. Representative of N = 10 independent animals.
Figure 3
Figure 3
Low neoantigen expression drives impaired T cell effector commitment and dysfunction. (a) Total CD44+/CD8+ antigen-specific T cells isolated from lesions at indicated days post-transplant of hiSIIN (red) and loSIIN (blue) organoids by flow cytometry. N = 5–9 independent animals per line and timepoint. (b-c) Antigen-specific T cell expression of TCF1 versus GZMB in tumors at 8 (b) and 14 (c) days. Representative of animals in (a). (d-e, g) Percent of antigen-specific T cells from DLNs and tumors at 8 days positive for TCF1 and negative for GZMB (d), negative for TCF1 and positive for GZMB (e), and double-negative for TCF1 and GZMB (g). N = 10 hiSIIN and 9 loSIIN-transplanted animals. (f,h) Percent of antigen-specific T cells from DLNs and tumors at 14 days negative for TCF1 and positive for GZMB (f), and double-negative for TCF1 and GZMB (h). N = 6 hiSIIN and 7 loSIIN-transplanted animals. (i) Median percentage of TCF1-/GZMB- antigen-specific T cells from tumors at 14 days co-expressing 0 through 4 inhibitory receptors (PD-1, TIM3, LAG3, and 2B4). N = 6 hiSIIN and 7 loSIIN-transplanted mice. Bars = standard deviation. (j-m) In vivo killing assay of transferred control (weak CTV stain) and SIINFEKL-loaded “target” (strong CTV stain) splenocytes and flow plots of antigen-specific T cells recovered from DLNs at 8 (j-k) and 14 (l-m) days post-transplant of hiSIIN (red) and loSIIN (blue) organoids. Representative of N = 6–7 independent animals per line and timepoint. (n) Target killing normalized to total antigen-specific T cells recovered in 14-day killing assay. N = 7 independent animals per line. (o-p) Total antigen-specific T cells isolated from lesions at 8 days across all expression variant lines (o) and versus mScarletSIIN MFI (p). (q-r) Percent of TCF1-/GZMB- antigen-specific T cells from 14-day lesions across expression variants (q) and versus mScarletSIIN MFI (r). Dashed lines connect medians. Significance assessed by Spearman’s rank correlation. N = 5–9 independent animals per line in (o-r). Significance in (a), (d-h), (n-o), and (q) assessed by two-tailed Wilcoxon Rank Sum. Holm’s correction applied in (o) and (q).
Figure 4
Figure 4
T cells in tumors with low neoantigen expression become progressively dysfunctional. (a-b) Antigen-specific T cell expression of TCF1 versus TIM3 in tumors at 8 (a) and 42 (b) days post-transplant, and (c) inhibitory receptor expression on antigen-specific T cells from tumors at 42 days post-transplant by flow cytometry. Representative of N = 9 hiSIIN and 9 loSIIN-transplanted animals at 8 days, and N = 5 hiSIIN and 5 loSIIN-transplanted animals at 42 days. (d-e) Percent TCF1-/TIM3+/PD-1+/LAG3+ (d) and TCF1+/PD-1+/LAG3+ (e) antigen-specific T cells isolated from tumors at 8-, 14-, 21-, 28-, and 42-days post-transplant. Red = hiSIIN, blue = loSIIN. N = 4–9 independent animals per line and timepoint.
Figure 5
Figure 5
Low neoantigen expression limits T cell cross priming. (a) Efficiency of tumor formation 6 weeks post-transplant of hiSIIN organoids into WT, Batf3−/−, and WT mice with continuous anti-CD4 treatment. N = independent animals. (b-e) Cross priming of 10,000 naïve OT-1s co-cultured with 50,000 activated BM-DCs loaded with lysed noSIIN (grey), loSIIN (blue), and hiSIIN (red) cells. Flow cytometric quantification of CD44+, Ki67+, GZMB+, and TNFα+/IFNγ+ OT-1s. N = 4 co-cultures per line and condition. (f) Images of day 4 organoid and activated OT-1 co-cultures, representative of (g). (g) Quantification of organoid confluence. E:T = effector-to-target ratio. N = 3 co-cultures per line and condition. Significance assessed by two-tailed t-test. (h) Efficiency of tumor formation 6 weeks post-transplant of loSIIN, loSIIN 4 weeks post-transplant of hiSIIN (Re-challenge), loSIIN and hiSIIN at separate sites or mixed, and loSIIN concurrent with retro-orbital injection of activated OT-1s. N = independent animals. (i) Schematic of co-transplant of loSIIN (green) and hiSIIN (red) organoids (top), and stereoscopic images 8 days post-transplant (bottom) representative of N = 12 animals. (j-k) Flow cytometric analysis of antigen-specific T cells from DLNs and lesions 8 days post-co-transplant of hiSIIN (red) and loSIIN (blue) organoids at separate sites. N = 12 independent animals. (j) Total antigen-specific T cells. Significance assessed by two-tailed Wilcoxon Rank Sum. (k) Expression of GZMB and TCF1, representative of animals in (j). (l) Efficiency of tumor formation 6 weeks post co-transplant of loSIIN with indicated organoids mixed or at separate sites. N = independent animals. (m) Expression of H-2Kb/H-2Db on hiSIIN organoids after electroporation with Cas9 complexes targeting H2-k1 (pre-sorting). Purple: targeted; grey: untargeted. Organoids pre-treated with IFNγ. N = 1 experiment. (n) Efficiency of tumor formation 6 weeks post-transplant of Kb-KOSIIN, hiSIIN or co-transplant of loSIIN and Kb-KOSIIN in WT and Batf3−/− mice. N = independent animals. (o-p) Stereoscopic images of tumors 6 weeks post co-transplant of Kb-KOSIIN and loSIIN organoids in WT (o) and Batf3−/− mice (p), representative of animals transplanted in (n). Significance in (a), (h), (l) and (n) assessed by 2×2 Fisher’s exact test, with Holm’s correction applied in (h).
Figure 6
Figure 6
Therapeutic vaccination and agonistic anti-CD40 are efficacious in low neoantigen expressing tumors. (a) Percent of total peripheral blood CD8+ T cells that are antigen specific (CD44+/SIINFEKL tetramer+) in loSIIN tumor-bearing mice following two weeks (two doses) of OVA250–270 (N = 8 animals), non-specific (N = 7 animals), or no peptide-based vaccination (N = 8 animals). (b) Flow plot of peripheral blood antigen-specific CD8+ T cells from OVA250–270 vaccinated mouse, representative of N = 8 animals. (c) Change in loSIIN tumor size as measured by longitudinal colonoscopy following 14 days (two doses) of OVA250–270 (N = 8 animals) or non-specific vaccination (N = 7 animals). Significance assessed by Wilcoxon Rank Sum of percent change in tumor size. (d) Primary tumor sizes at necropsy 28 days post-vaccine regimen initiation. N = 10 OVA250–270 and 7 non-specific vaccine treated animals. Significance assessed by Wilcoxon Rank Sum. (e-j) Immunotherapy preclinical trial of mice bearing loSIIN tumors showing change in tumor size after 14 days of treatment, as determined by colonoscopy. N = 18 (e), 12 (f), 12 (g), 16 (h), 12 (i), and 12 (j) independent animals. Significance assessed by Wilcoxon Rank Sum of percent change in tumor size of treatment groups versus no treatment, with Holm’s correction. (k-l) Colonoscopy images of tumors pre- and post-treatment from mice receiving no treatment (k) and αCD40/αPD-1/αCTLA-4 (l), representative of N = 18 and 17 animals, respectively. (m) Primary tumor sizes at necropsy 28 days post-treatment initiation. ACT = adoptive cell transfer of OT-1s. N = 21 no treatment, 12 αPD-1, 12 αCTLA-4, 15 αCD40, 12 αCD40/αPD-1, 12 αCD40/αCTLA-4, 17 αCD40/αPD-1/αCTLA-4, and 10 ACT arm animals. Significance assessed by Wilcoxon Rank Sum with Holm’s correction. (n) Fraction of mice with any metastases (liver, lung, or omentum). N = same as (m). Significance assessed by 2×2 Fisher’s exact test with Holm’s correction. (o-r) Stereoscopic images of primary colon tumor (o), liver (p), lung (q), and omental (r) metastases from an αPD-1-treated mouse 28 days post-treatment initiation, representative of N = 12 animals.
Figure 7
Figure 7
Immunotherapy refractory low neoantigen expressing tumors remain vulnerable to antigen-specific T cell killing. (a-d) Flow cytometric analysis of H-2Kb and PD-L1 MFI (a-b) and representative histograms of expression (c-d) following 24 hours of IFNγ stimulation (10 ng/mL) in ex vivo loSIIN tumor-derived organoids. Each organoid line was derived from a treatment refractory tumor taken from an independent animal in the indicated treatment arms in Fig. 6. Parental = un-transplanted loSIIN organoids. N = 3 no treatment, 3 αPD-1, and 2 αCD40/αPD-1 independent organoid lines. (e-f) Flow cytometric analysis of mScarletSIIN (e) and EGFP (f) expression in ex vivo tumor-derived organoids. N = same as above. (g) Images of co-cultures with ex vivo tumor-derived organoids and activated OT-1s at an effector-to-target ratio of 5:1 at day 4. (h) Schematic representation of the role of neoantigen expression level in immune evasion and response to therapeutic priming.

References

    1. Muzny DM et al. Comprehensive molecular characterization of human colon and rectal cancer. Nature 487, 330–337 (2012). - PMC - PubMed
    1. Le DT et al. Mismatch repair deficiency predicts response of solid tumors to PD-1 blockade. Science 357, 409–413 (2017). - PMC - PubMed
    1. Germano G et al. Inactivation of DNA repair triggers neoantigen generation and impairs tumour growth. Nature 552, 116–120 (2017). - PubMed
    1. Mandal R et al. Genetic diversity of tumors with mismatch repair deficiency influences anti-PD-1 immunotherapy response. Science 364, 485–491 (2019). - PMC - PubMed
    1. Samstein RM et al. Tumor mutational load predicts survival after immunotherapy across multiple cancer types. Nat. Genet. 51, 202–206 (2019). - PMC - PubMed

Methods-only references

    1. Li H et al. The Sequence Alignment/Map format and SAMtools. Bioinformatics 25, 2078–9 (2009). - PMC - PubMed
    1. Weese D, Holtgrewe M & Reinert K RazerS 3: Faster, fully sensitive read mapping. Bioinformatics 28, 2592–2599 (2012). - PubMed
    1. Kim S et al. Strelka2: fast and accurate calling of germline and somatic variants. Nat. Methods 15, 591–594 (2018). - PubMed
    1. Narzisi G et al. Accurate de novo and transmitted indel detection in exome-capture data using microassembly. Nat. Methods 11, 1033–1036 (2014). - PMC - PubMed
    1. McLaren W et al. The Ensembl Variant Effect Predictor. Genome Biol. 17, 122 (2016). - PMC - PubMed

Publication types

Substances