. 2022 Jan;12(1):203-210.
doi: 10.1002/2211-5463.13324. Epub 2021 Nov 17.

Tunneling nanotube formation promotes survival against 5-fluorouracil in MCF-7 breast cancer cells

Affiliations

Tunneling nanotube formation promotes survival against 5-fluorouracil in MCF-7 breast cancer cells

Kaylyn Kato et al. FEBS Open Bio. 2022 Jan.

Abstract

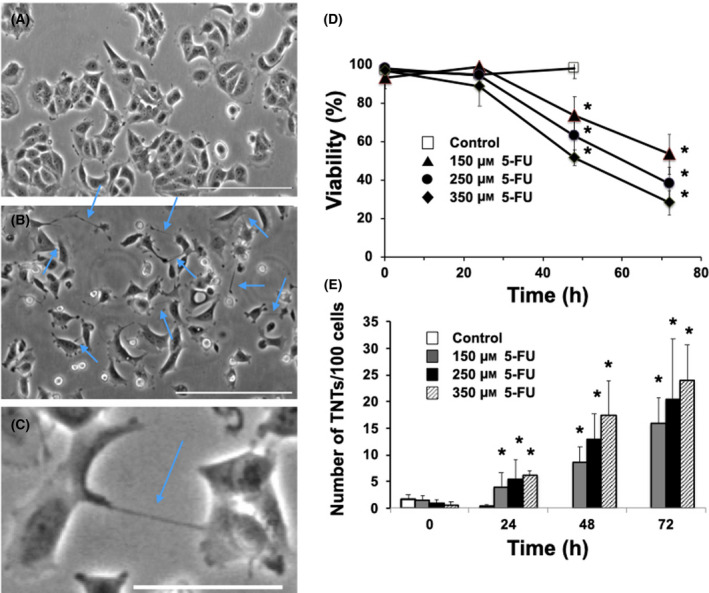
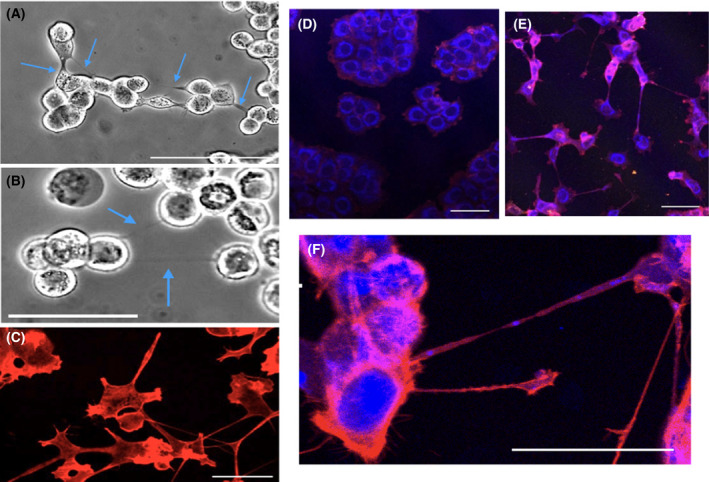
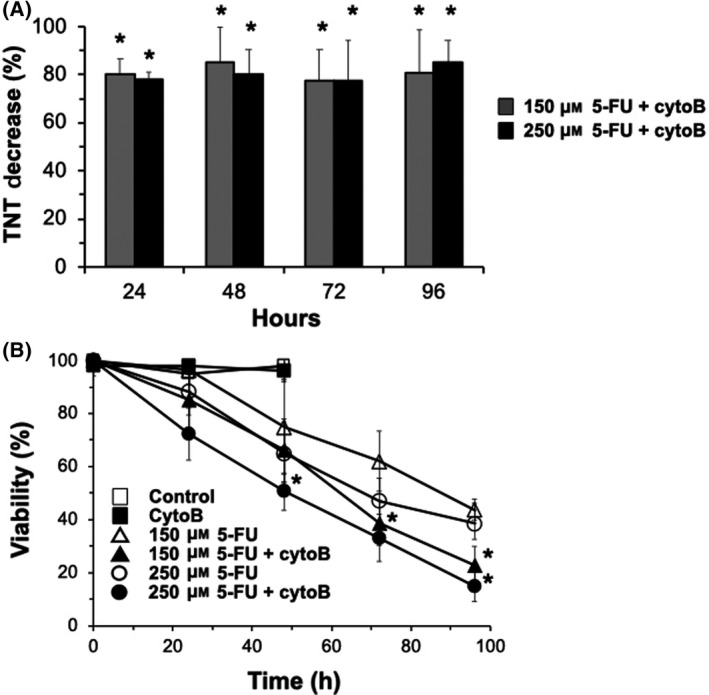
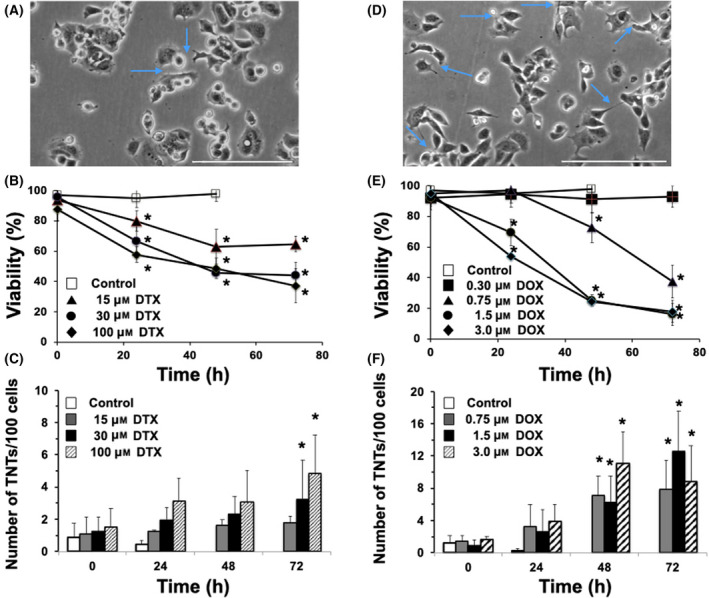
Tunneling nanotubes (TNTs) are F-actin-based open-ended tubular extensions that form following stresses, such as nutritional deprivation and oxidative stress. The chemotherapy agent 5-fluorouracil (5-FU) represents a significant stressor to cancer cells and induces thymidine deficiency, a state similar to nutritional deprivation. However, the ability of 5-FU to induce TNT formation in cancer cells and potentially enhance survival has not been explored. In this study, we examined whether 5-FU can induce TNT formation in MCF-7 breast cancer cells. Cytotoxic doses of 5-FU (150-350 μm) were observed to significantly induce TNT formation beginning at 24 h after exposure. TNTs formed following 5-FU treatment probably originated as extensions of gap junctions as MCF-7 cells detach from cell clusters. TNTs act as conduits for exchange of cellular components and we observed mitochondrial exchange through TNTs following 5-FU treatment. 5-FU-induced TNT formation was inhibited by over 80% following treatment with the F-actin-depolymerizing agent, cytochalasin B (cytoB). The inhibition of TNTs by cytoB corresponded with increased 5-FU-induced cytotoxicity by 30-62% starting at 48 h, suggesting TNT formation aides in MCF-7 cell survival against 5-FU. Two other widely used chemotherapy agents, docetaxel and doxorubicin induced TNT formation at much lower levels than 5-FU. Our work suggests that the therapeutic targeting of TNTs may increase 5-FU chemotherapy efficacy and decrease drug resistance in cancer cells, and these findings merits further investigation.

Keywords: 5-fluorouracil; chemotherapy; cytochalasin B; doxorubicin; drug resistance; tunneling nanotubes.


Conflict of interest statement

The authors declare no conflict of interest.

Figures

Fig. 1
Fig. 1
Cytotoxic doses of 5‐FU treatment induces TNT formation in MCF‐7 cells. (A) Control MCF‐7 cells. (B) MCF‐7 cells treated with 150 μm 5‐FU at 48 h. Blue arrows point to TNT structures formed following 5‐FU treatment. Scale bar = 200 μm. (C) Close up image of MCF‐7 cells treated with 150 μm 5‐FU at 24 h. Scale bar = 50 μm. (D) Time course of MCF‐7 viability following treatment with various doses of 5‐FU: 150 μm (▲), 250 μm (●), and 350 μm (♦) and vehicle control (□). (E) Time course of TNT formation following 5‐FU treatment in MCF‐7 cells. MCF‐7 cells following 5‐FU treatment: 150 μm (grey bar), 250 μm (black bar), 350 μm (striped bar) and vehicle control (white bar). MCF‐7 cells were brought to 70–80% confluence and treated various doses with 5‐FU. Viability was measured by trypan blue in both attached and detached cells. TNT was counted based on the criteria outlined in the Materials and methods. N = 4 experiments. Error bars = standard deviation. *P < 0.05 compared to control at 0 time following ANOVA analysis.
Fig. 2
Fig. 2
Characterization of TNTs formed in MCF‐7 cells following 5‐FU treatment. Key characteristics of TNTs, resistance to trypsin digestion and staining for F‐actin, are shown. (A) MCF‐7 cells (250 μm 5‐FU at 48 h) treated with trypsin (30 min) without disruption of TNTs. Scale bar = 200 μm. (B) MCF‐7 cells (150 μm 5‐FU at 48 h) treatment (60 min) with trypsin does not disrupt TNTs. Scale bar = 100 μm. (C) MCF‐7 cells (250 μm 5‐FU at 48 h) stained with the F‐actin dye, rhodamine phalloidin. Scale bar = 25 μm. Transport of mitochondria through TNTs formed following 5‐FU treatment to MCF‐7. MCF‐7 cells were treated with 5‐FU or vehicle control for 48 h and fixed. TNTs were stained with rhodamine phalloidin (F‐actin dye), while mitochondria were stained using MitoTracker Green. (D) Control MCF‐7 cells. Scale bar = 50 μm. (E) MCF‐7 cells treated with 250 μm 5‐FU at 48 h. (F) Close up of MCF‐7 cells treated with 250 μm 5‐FU at 48 h. Scale bar = 50 μm.
Fig. 3
Fig. 3
CytoB treatment inhibits TNT formation and enhances 5‐FU cytotoxicity in MCF‐7 cells. MCF‐7 cells were pretreated with cytoB for 1 h prior to 5‐FU treatment. (A) Inhibition of 5‐FU‐induced TNT formation by cytoB treatment. 5‐FU 150 μm (grey bar) and 5‐FU 250 μm (black bar) pretreated with cytoB (500 nm). (B) Time course of MCF‐7 viability following 5‐FU treatment in the presence and absence of cytoB. 5‐FU 150 μm (▵), 5‐FU 250 μm (○), vehicle control (□), 5‐FU 150 μm + cytoB (▲), 5‐FU 250 μm + cytoB (●), cytoB (■). Viability was measured by trypan blue in both attached and detached cells. TNT was counted based on the criteria outlined in the Materials and methods. N = 4 experiments. Error bars = standard deviation. *P < 0.05 compared to equivalent 5‐FU samples without cytoB treatment using T‐test.
Fig. 4
Fig. 4
Effect of cytotoxic doses of DTX and DOX treatment on TNT formation in MCF‐7 cells. (A) MCF‐7 cells treated with 30 μm DTX at 72 h. Blue arrows point to some TNT structures formed following DTX treatment. (B) Time course of MCF‐7 viability following treatment with various doses of DTX: 15 μm (▲), 30 μm (●), and 100 μm (♦) and vehicle control (□). (C) Time course of TNT formation in MCF‐7 cells following DTX treatment. DTX 15 μm (grey bar), DTX 30 μm (black bar), and DTX 100 μm (striped bar) μm and vehicle control (white bar). (D) MCF‐7 cells treated with 1.5 μm DOX at 48 h. Blue arrows point to some TNT structures formed following DOX treatment. (E) Time course of MCF‐7 viability following treatment with various doses of DOX: 0.30 μm (■), 0.75 μm (▲), 1.5 μm (●), and 3 μm (♦) and vehicle control (□). (F) Time course of TNT formation following DOX treatment in MCF‐7 cells. DOX 0.75 μm (grey bar), DOX 1.5 μm (black bar), DOX 3 μm (striped bar) μm and vehicle control (white bar). MCF‐7 cells were brought to 70–80% confluence and treated various doses with DOX. Viability was measured by trypan blue in both attached and detached cells. TNTs were counted based on the criteria outlined in the Materials and methods. Scale bar = 200 μm. N = 4 experiments. Error bars = standard deviation. *P < 0.05 compared to control at 0 time following ANOVA analysis.

References

    1. Rustom A, Saffrich R, Markovic I, Walther P, Gerdes HH. Nanotubular highways for intercellular organelle transport. Science. 2004;303:1007–10. - PubMed
    1. Abounit S, Zurzolo C. Wiring through tunneling nanotubes–from electrical signals to organelle transfer. J Cell Sci. 2012;125:1089–98. - PubMed
    1. Mittal R, Karhu E, Wang JS, Delgado S, Zukerman R, Mittal J, et al. Cell communication by tunneling nanotubes: implications in disease and therapeutic applications. J Cell Physiol. 2019;234:1130–46. - PubMed
    1. Wang X, Gerdes HH. Transfer of mitochondria via tunneling nanotubes rescues apoptotic PC12 cells. Cell Death Differ. 2015;22:1181–91. - PMC - PubMed
    1. Kretschmer A, Zhang F, Somasekharan SP, Tse C, Leachman L, Gleave A, et al. Stress‐induced tunneling nanotubes support treatment adaptation in prostate cancer. Sci Rep. 2019;9:7826. - PMC - PubMed