A comparison of proton stopping power measured with proton CT and x-ray CT in fresh postmortem porcine structures
- PMID: 34739140
- PMCID: PMC8678357
- DOI: 10.1002/mp.15334
A comparison of proton stopping power measured with proton CT and x-ray CT in fresh postmortem porcine structures
Abstract
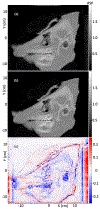
Purpose: Currently, calculations of proton range in proton therapy patients are based on a conversion of CT Hounsfield units of patient tissues into proton relative stopping power. Uncertainties in this conversion necessitate larger proximal and distal planned target volume margins. Proton CT can potentially reduce these uncertainties by directly measuring proton stopping power. We aim to demonstrate proton CT imaging with complex porcine samples, to analyze in detail three-dimensional regions of interest, and to compare proton stopping powers directly measured by proton CT to those determined from x-ray CT scans.
Methods: We have used a prototype proton imaging system with single proton tracking to acquire proton radiography and proton CT images of a sample of porcine pectoral girdle and ribs, and a pig's head. We also acquired close in time x-ray CT scans of the same samples and compared proton stopping power measurements from the two modalities. In the case of the pig's head, we obtained x-ray CT scans from two different scanners and compared results from high-dose and low-dose settings.
Results: Comparing our reconstructed proton CT images with images derived from x-ray CT scans, we find agreement within 1% to 2% for soft tissues and discrepancies of up to 6% for compact bone. We also observed large discrepancies, up to 40%, for cavitated regions with mixed content of air, soft tissue, and bone, such as sinus cavities or tympanic bullae.
Conclusions: Our images and findings from a clinically realistic proton CT scanner demonstrate the potential for proton CT to be used for low-dose treatment planning with reduced margins.
Keywords: digitally reconstructed radiograph; iterative algorithm; proton computed tomography; proton imaging; proton radiography; relative stopping power.
© 2021 American Association of Physicists in Medicine.
Conflict of interest statement
Conflict of Interest Statement
The authors have intellectual property rights to the innovations described in this paper. Don F. DeJongh and Victor Rykalin are co-owners of ProtonVDA LLC.
Figures


References
-
- Schulte RW, Bashkirov V, Loss Klock MC, Li T, Wroe AJ, Evseev I, Williams DC, and Satogata T, Density resolution of proton computed tomography, Medical Physics 32, 1035–1046 (2005). - PubMed
-
- Farace P, Tommasino F, Righetto R, Fracchiolla F, Scaringella M, Bruzzi M, and Civinini C, Technical Note: CT calibration for proton treatment planning by cross-calibration with proton CT data, Medical Physics 48, 1349–1355 (2021). - PubMed
MeSH terms
Substances
Grants and funding
LinkOut - more resources
Full Text Sources

