. 2021 Nov 5;7(45):eabg1964.
doi: 10.1126/sciadv.abg1964. Epub 2021 Nov 5.

The metabolic adaptation evoked by arginine enhances the effect of radiation in brain metastases

Affiliations

The metabolic adaptation evoked by arginine enhances the effect of radiation in brain metastases

Rossella Marullo et al. Sci Adv. .

Abstract

Selected patients with brain metastases (BM) are candidates for radiotherapy. A lactatogenic metabolism, common in BM, has been associated with radioresistance. We demonstrated that BM express nitric oxide (NO) synthase 2 and that administration of its substrate l-arginine decreases tumor lactate in BM patients. In a placebo-controlled trial, we showed that administration of l-arginine before each fraction enhanced the effect of radiation, improving the control of BM. Studies in preclinical models demonstrated that l-arginine radiosensitization is a NO-mediated mechanism secondary to the metabolic adaptation induced in cancer cells. We showed that the decrease in tumor lactate was a consequence of reduced glycolysis that also impacted ATP and NAD+ levels. These effects were associated with NO-dependent inhibition of GAPDH and hyperactivation of PARP upon nitrosative DNA damage. These metabolic changes ultimately impaired the repair of DNA damage induced by radiation in cancer cells while greatly sparing tumor-infiltrating lymphocytes.


Figures
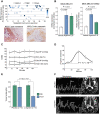
Fig. 1.
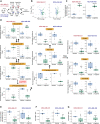
Fig. 1.. l-Arginine decreases tumor lactate concentration in BM.
(A) Expression of NOS2 in 42 BM specimens. The Y axis indicates the percent of positive cells, the color scale represents intensity of expression, and the shape represents different origins of the primary tumor. Representative immunohistochemistry images of two patients with BM from NSCLC. Scale bars, 100 μm. (B) NOS2 expression in MDA-MB-231 and MDA-MB-231-BrM2 cells treated with interleukin-6 (IL-6) and hypoxia (1% O2). (C) Hemodynamic parameters obtained from five patients treated with a single oral dose of 10 g of l-arginine. (D) Plasma concentration of l-arginine obtained from patients in (C). (E) Quantification of tumor lactate in BM before (PRE) and after (POST) administration of placebo (n = 5) and l-arginine (n = 5) taken 24 hours apart. (F) Representative magnetic resonance spectrograms and corresponding images from a patient with BM treated with placebo (top) and 24 hours later with l-arginine (bottom). The arrow indicates the lactate peak.
Fig. 2.
Fig. 2.. l-Arginine improves the effect of radiation therapy in patients with BM.
(A) Flowchart of clinical trial design with allocation results. (B) Overall responses as number of patients achieving a response category by allocation arm. The P value represents the comparison of complete (CR) plus partial responses (PR) among arms. PD, progressive disease; SD, stable disease. (C) Kaplan-Meier curves of the probability of central nervous system (CNS) progression-free survival in l-arginine and placebo arms. (D) Representative images from an NSCLC patient with BM enrolled in the l-arginine arm of the clinical trial.
Fig. 3.
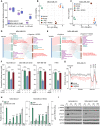
Fig. 3.. Cellular metabolic changes induced by l-arginine administration in TNBC models.
(A) Schematic representation of experiments using two TNBC xenograft models. (B) Volcano plots displaying metabolites significantly changed in vehicle- versus l-arginine–treated MDA-MB-231 and MDA-MB-468 xenografts. (C) Boxplot of l-arginine levels in vehicle- versus l-arginine–treated MDA-MB-231 and MDA-MB-468 xenografts. (D) Significantly changed metabolites belonging to the glycolysis pathway and TCA cycle in vehicle- versus l-arginine–treated MDA-MB-231 and MDA-MB-468 xenografts. (E) NAD+ levels in vehicle- versus l-arginine–treated MDA-MB-231 and MDA-MB-468 xenografts. (F) ATP:ADP and (G) ATP:AMP ratios in vehicle- versus l-arginine–treated MDA-MB-231 and MDA-MB-468 xenografts. *Padj < 0.01, **Padj < 0.001, ***Padj < 0.0001, and ****Padj < 0.00001.
Fig. 4.
Fig. 4.. l-Arginine suppression of tumor metabolism occurs in a NOS2-dependent manner.
(A) Extracellular lactate concentration in MDA-MB-231 and MDA-MB-231-BrM2 cells treated for 60 min with d-arginine (as control) or l-arginine at the indicated concentrations. (B and C) Principal components (PC) analyses of the metabolome of MDA-MB-231 and MDA-MB-468 cells treated in vitro with vehicle, NOS2 inhibitor 1400W, l-arginine, or their combination. (D and E) Sankey plots depicting statistically significant metabolic changes exerted by l-arginine alone or in combination with the NOS2 inhibitor 1400W in MDA-MB-231 and MDA-MB-468 cell lines. Data compared to vehicle. Selected metabolites are indicated. The color pattern of metabolites indicates similar changes. (F) Extracellular lactate concentration in a panel of TNBC and NSCLC cell lines exposed to l-arginine alone or in combination with the NOS2 inhibitor 1400W. (G) Oxygen consumption rate (OCR) in MDA-MB-231 cells exposed to vehicle (black), d-arginine (gray), or l-arginine (red) for the indicated times. FCCP, carbonyl cyanide p-trifluoromethoxyphenylhydrazone; OLIG, oligomycin; ROTN, rotenone. (H) Total cellular ATP levels (right x axis) and cell necrosis (left x axis) in MDA-MB-231 and MDA-MB-231-BrM2 cells treated with l-arginine for the indicated time points (y axis, in minutes). Cyclophosphamide was used as a positive control for cell necrosis (CTRL). (I) Total and phosphorylated levels of AMPK and its target ACC1 in MDA-MB-231 and MDA-MB-231-BrM2 cells treated with l-arginine for the indicated time points (in minutes). HSPA5 and actin were used as controls. *P < 0.01, **P < 0.001, and ***P < 0.0001.
Fig. 5.
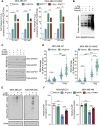
Fig. 5.. l-Arginine generates peroxynitrate, GAPDH nitrosylation, and protein ADP-ribosylation.
(A) Peroxynitrate levels in MDA-MB-231 and MDA-MB-231-BrM2 cells treated with vehicle, l-arginine, the SOD mimetic tempol (SOD1mim), or the combination of l-arginine and SOD1mim for 15 and 55 min. (B) Total protein nitrosylation in MDA-MB-231 cells exposed to l-arginine for 60 min. GSNO was used as a positive control. (C) SNO-GAPDH (and total GAPDH) in MDA-MB-231 and MDA-MB-468 cells exposed for 60 min to l-arginine alone or in combination with the NOS2 inhibitor 1400W. GSNO was used as a positive control. (D) DNA damage levels assessed by comet assay in MDA-MB-231 and MDA-MB-231-BrM2 cells exposed to vehicle or l-arginine for 60 min with and without Fpg. (E) Total mono– and poly–ADP-ribosylated proteins in MDA-MB-231 and MDA-MB-468 cells exposed to l-arginine alone or in combination with the NOS2 inhibitor 1400W. (F) NAD+ levels in MDA-MB-231 and MDA-MB-468 cells exposed to l-arginine alone or in combination with the PARP inhibitor olaparib. **P < 0.001 and ***P < 0.0001.
Fig. 6.
Fig. 6.. l-Arginine radiosensitizes cancer cells in a NOS2-dependent manner.
(A) Dose response curves of MDA-MB-231, MDA-MB-231-BrM2, MDA-MB-468, and H460 cells exposed to l-arginine for 60 min followed by a dose range of ionizing radiation. (B) Surviving fraction of MDA-MB-231, MDA-MB-231-BrM2, MDA-MB-468, and H460 cells exposed to vehicle or l-arginine for 60 min followed by 2-Gy ionizing radiation with or without the NOS2 inhibitor 1400W. *P < 0.01, **P < 0.001, and ***P < 0.0001.
Fig. 7.
Fig. 7.. l-Arginine decreases the DNA damage repair capacity of cancer cells.
(A) DNA synthesis capacity determined by 5-bromo-2′-deoxyuridine (BrdU) incorporation in MDA-MB-231 cells exposed to vehicle or l-arginine for 60 min with or without the NOS inhibitor L-NMMA. (B) Representative images of nuclear γH2AX and 53BP1 foci in MDA-MB-231-BrM2 cells exposed to vehicle, l-arginine, ionizing radiation, or the combination. (C) DNA damage levels assessed by comet assay in MDA-MB-231-BrM2 cells exposed to vehicle or l-arginine for 60 min followed by ionizing radiation (4 Gy). DNA damage was assessed at 60 min following l-arginine administration (baseline, before irradiation) and at 30 min and 4 hours following irradiation. (D) DNA damage levels in MDA-MB-231-BrM2 cells exposed to vehicle or l-arginine for 1 hour followed by etoposide for 2 hours. DNA damage was assessed by comet assay at 1 hour after vehicle or l-arginine administration, at 2 hours after etoposide treatment, and at 1.5 and 6 hours after drug washing (recovery). (E) Intratumor lactate concentration in the murine 4T1 TNBC orthotopic model. Mice were treated with vehicle or a mouse-equivalent dose of l-arginine administered by oral gavage, and tumor lactate content was measured after 60 min by nuclear magnetic resonance (NMR). (F) Experimental design (left) to determine γH2AX levels by flow cytometry in tumor cells (middle) and CD45+ tumor-associated lymphocytes (right) isolated from the murine 4T1 TNBC orthotopic model. Mice were treated with vehicle or a mouse-equivalent dose of l-arginine followed by ionizing radiation (2 Gy). Data are shown in viable cells (cleaved caspase-3NEG). *P < 0.01, **P < 0.001, and ***P < 0.0001. ns, not significant.

References

    1. Lin X., DeAngelis L. M., Treatment of brain metastases. J. Clin. Oncol. 33, 3475–3484 (2015). - PMC - PubMed
    1. Kamar F. G., Posner J. B., Brain metastases. Semin. Neurol. 30, 217–235 (2010). - PubMed
    1. Nam B.-H., Kim S. Y., Han H.-S., Kwon Y., Lee K. S., Kim T. H., Ro J., Breast cancer subtypes and survival in patients with brain metastases. Breast Cancer Res. 10, R20 (2008). - PMC - PubMed
    1. Illum H., Wang D. H., Dowell J. E., Hittson W. J., Torrisi J. R., Meyer J., Huerta S., Phase I dose escalation trial of nitroglycerin in addition to 5-fluorouracil and radiation therapy for neoadjuvant treatment of operable rectal cancer. Surgery 158, 460–465 (2015). - PubMed
    1. Gao X., Saha D., Kapur P., Anthony T., Livingston E. H., Huerta S., Radiosensitization of HT-29 cells and xenografts by the nitric oxide donor DETANONOate. J. Surg. Oncol. 100, 149–158 (2009). - PubMed