. 2021 Jun 25;372(6549):eabc3593.
doi: 10.1126/science.abc3593. Epub 2021 Aug 5.

Ubiquitination is essential for recovery of cellular activities after heat shock

Affiliations

Ubiquitination is essential for recovery of cellular activities after heat shock

Brian A Maxwell et al. Science. .

Abstract

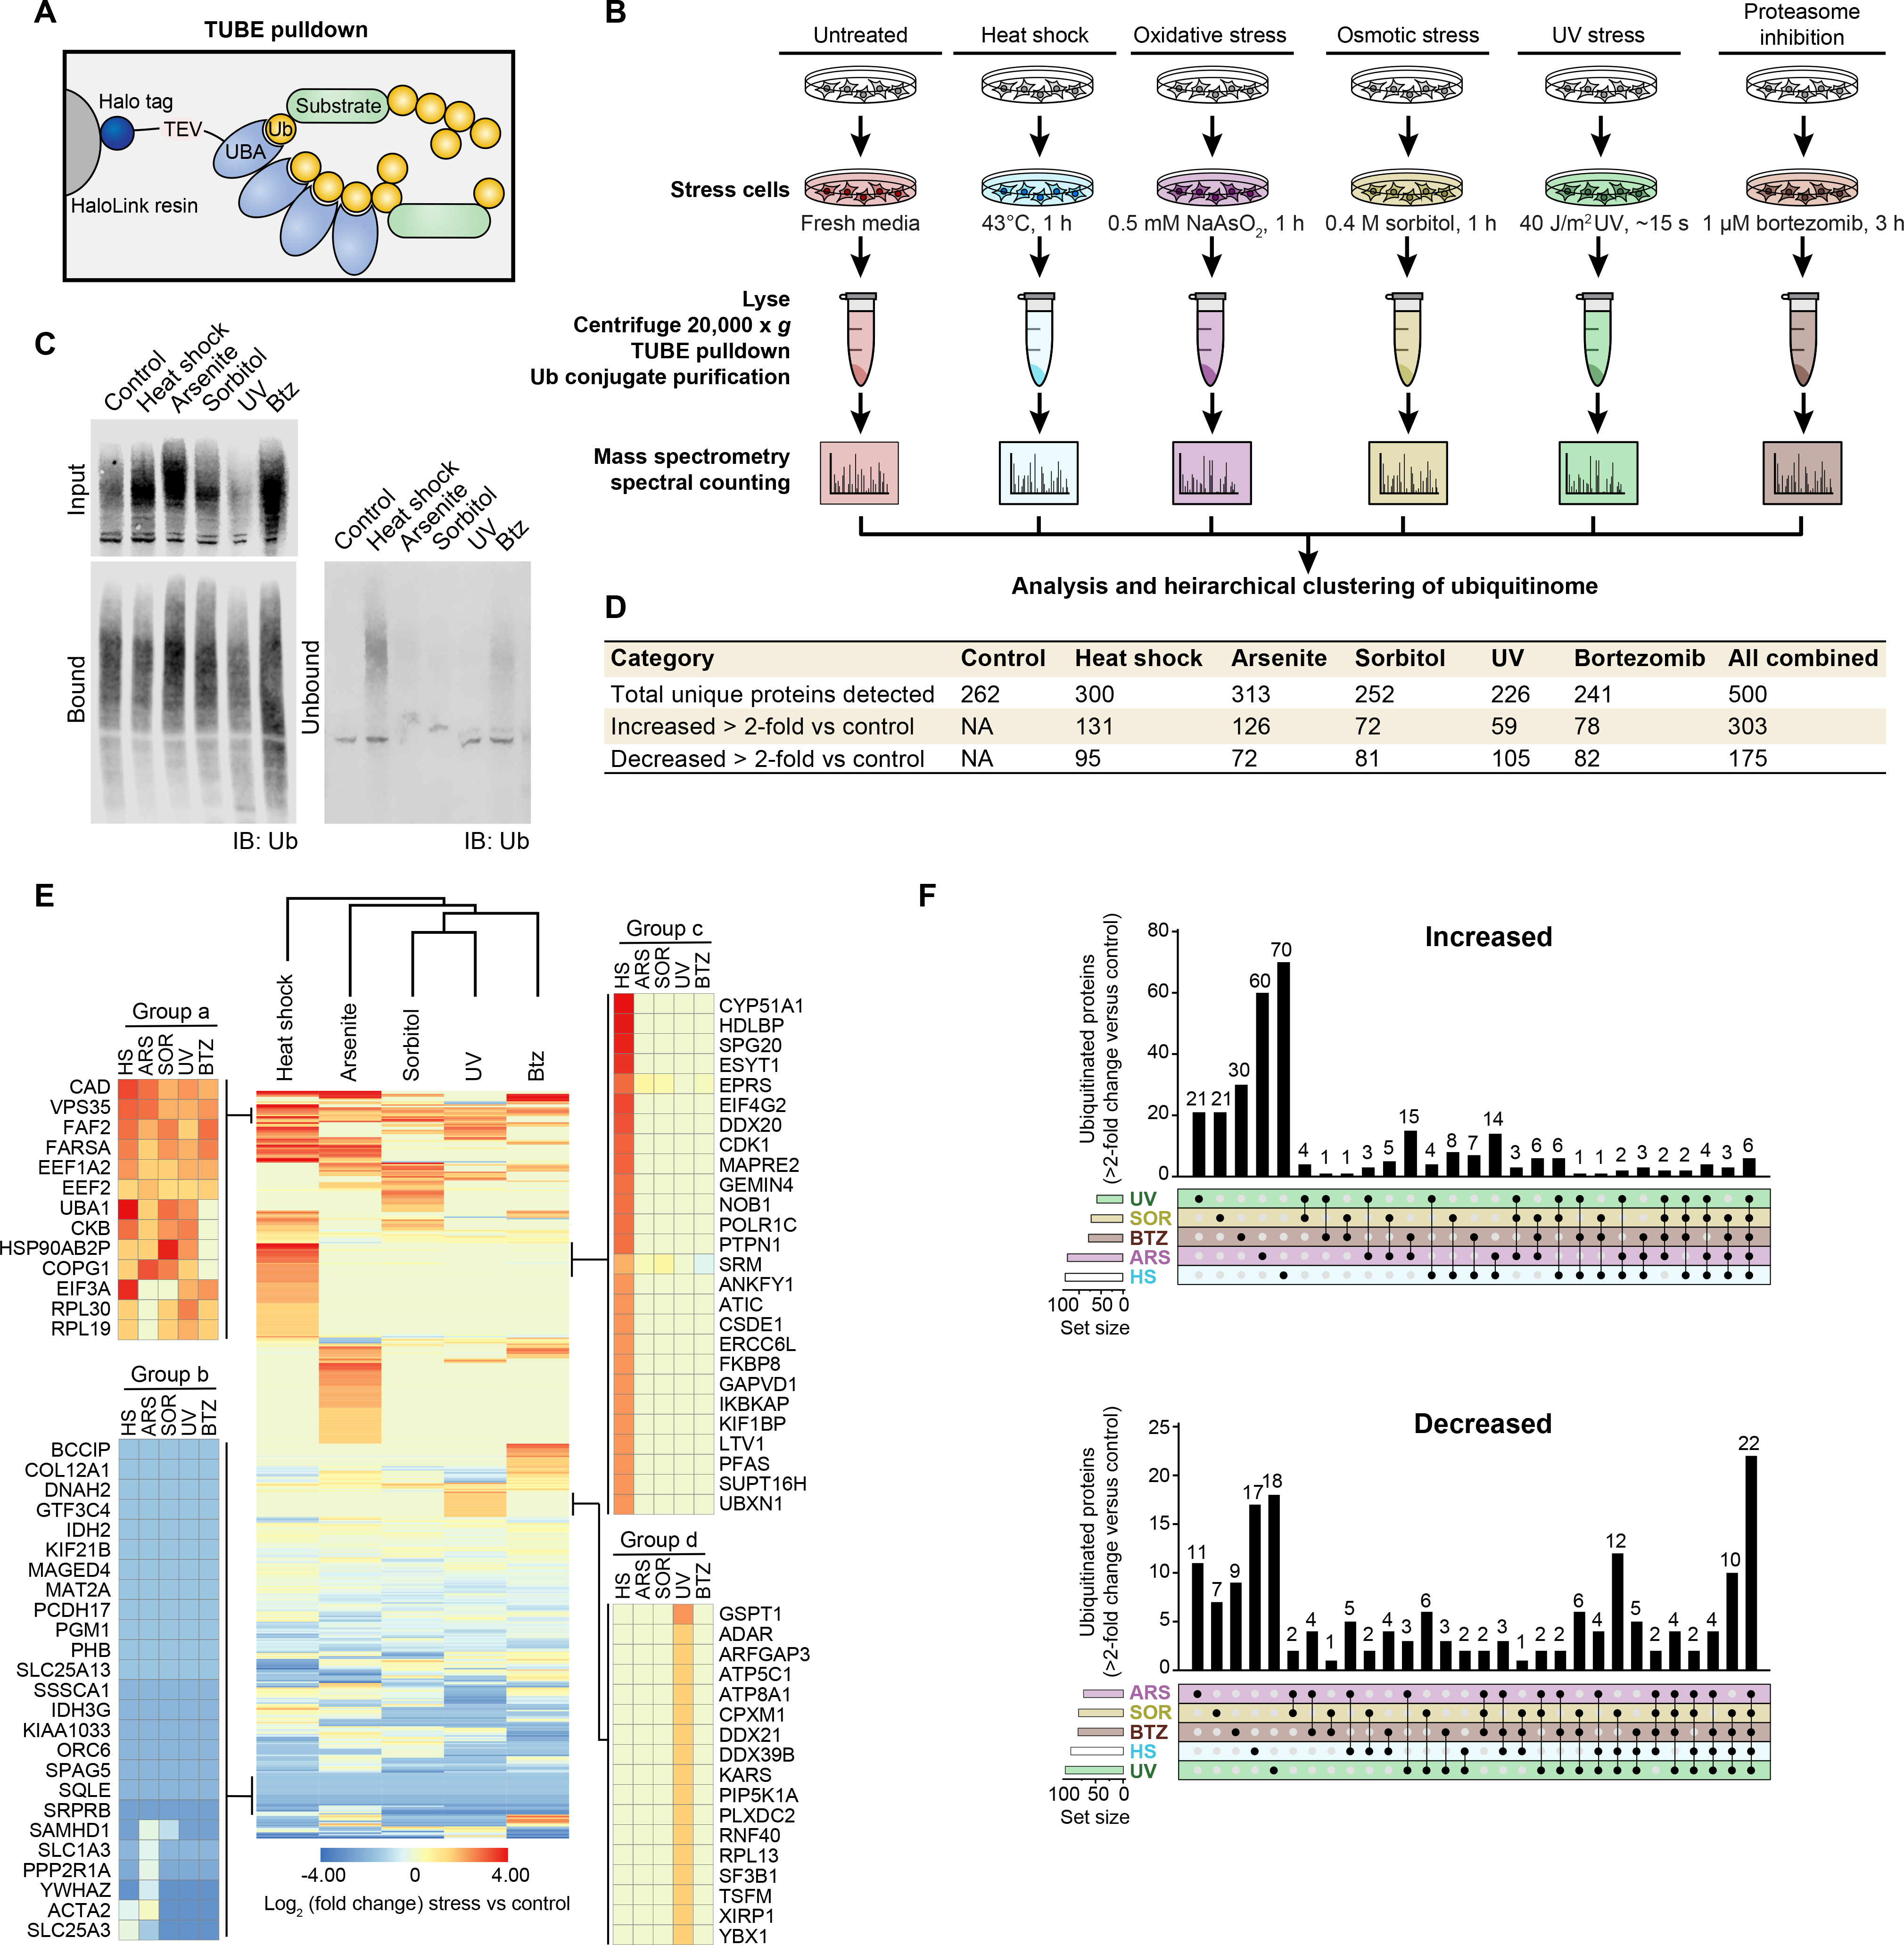
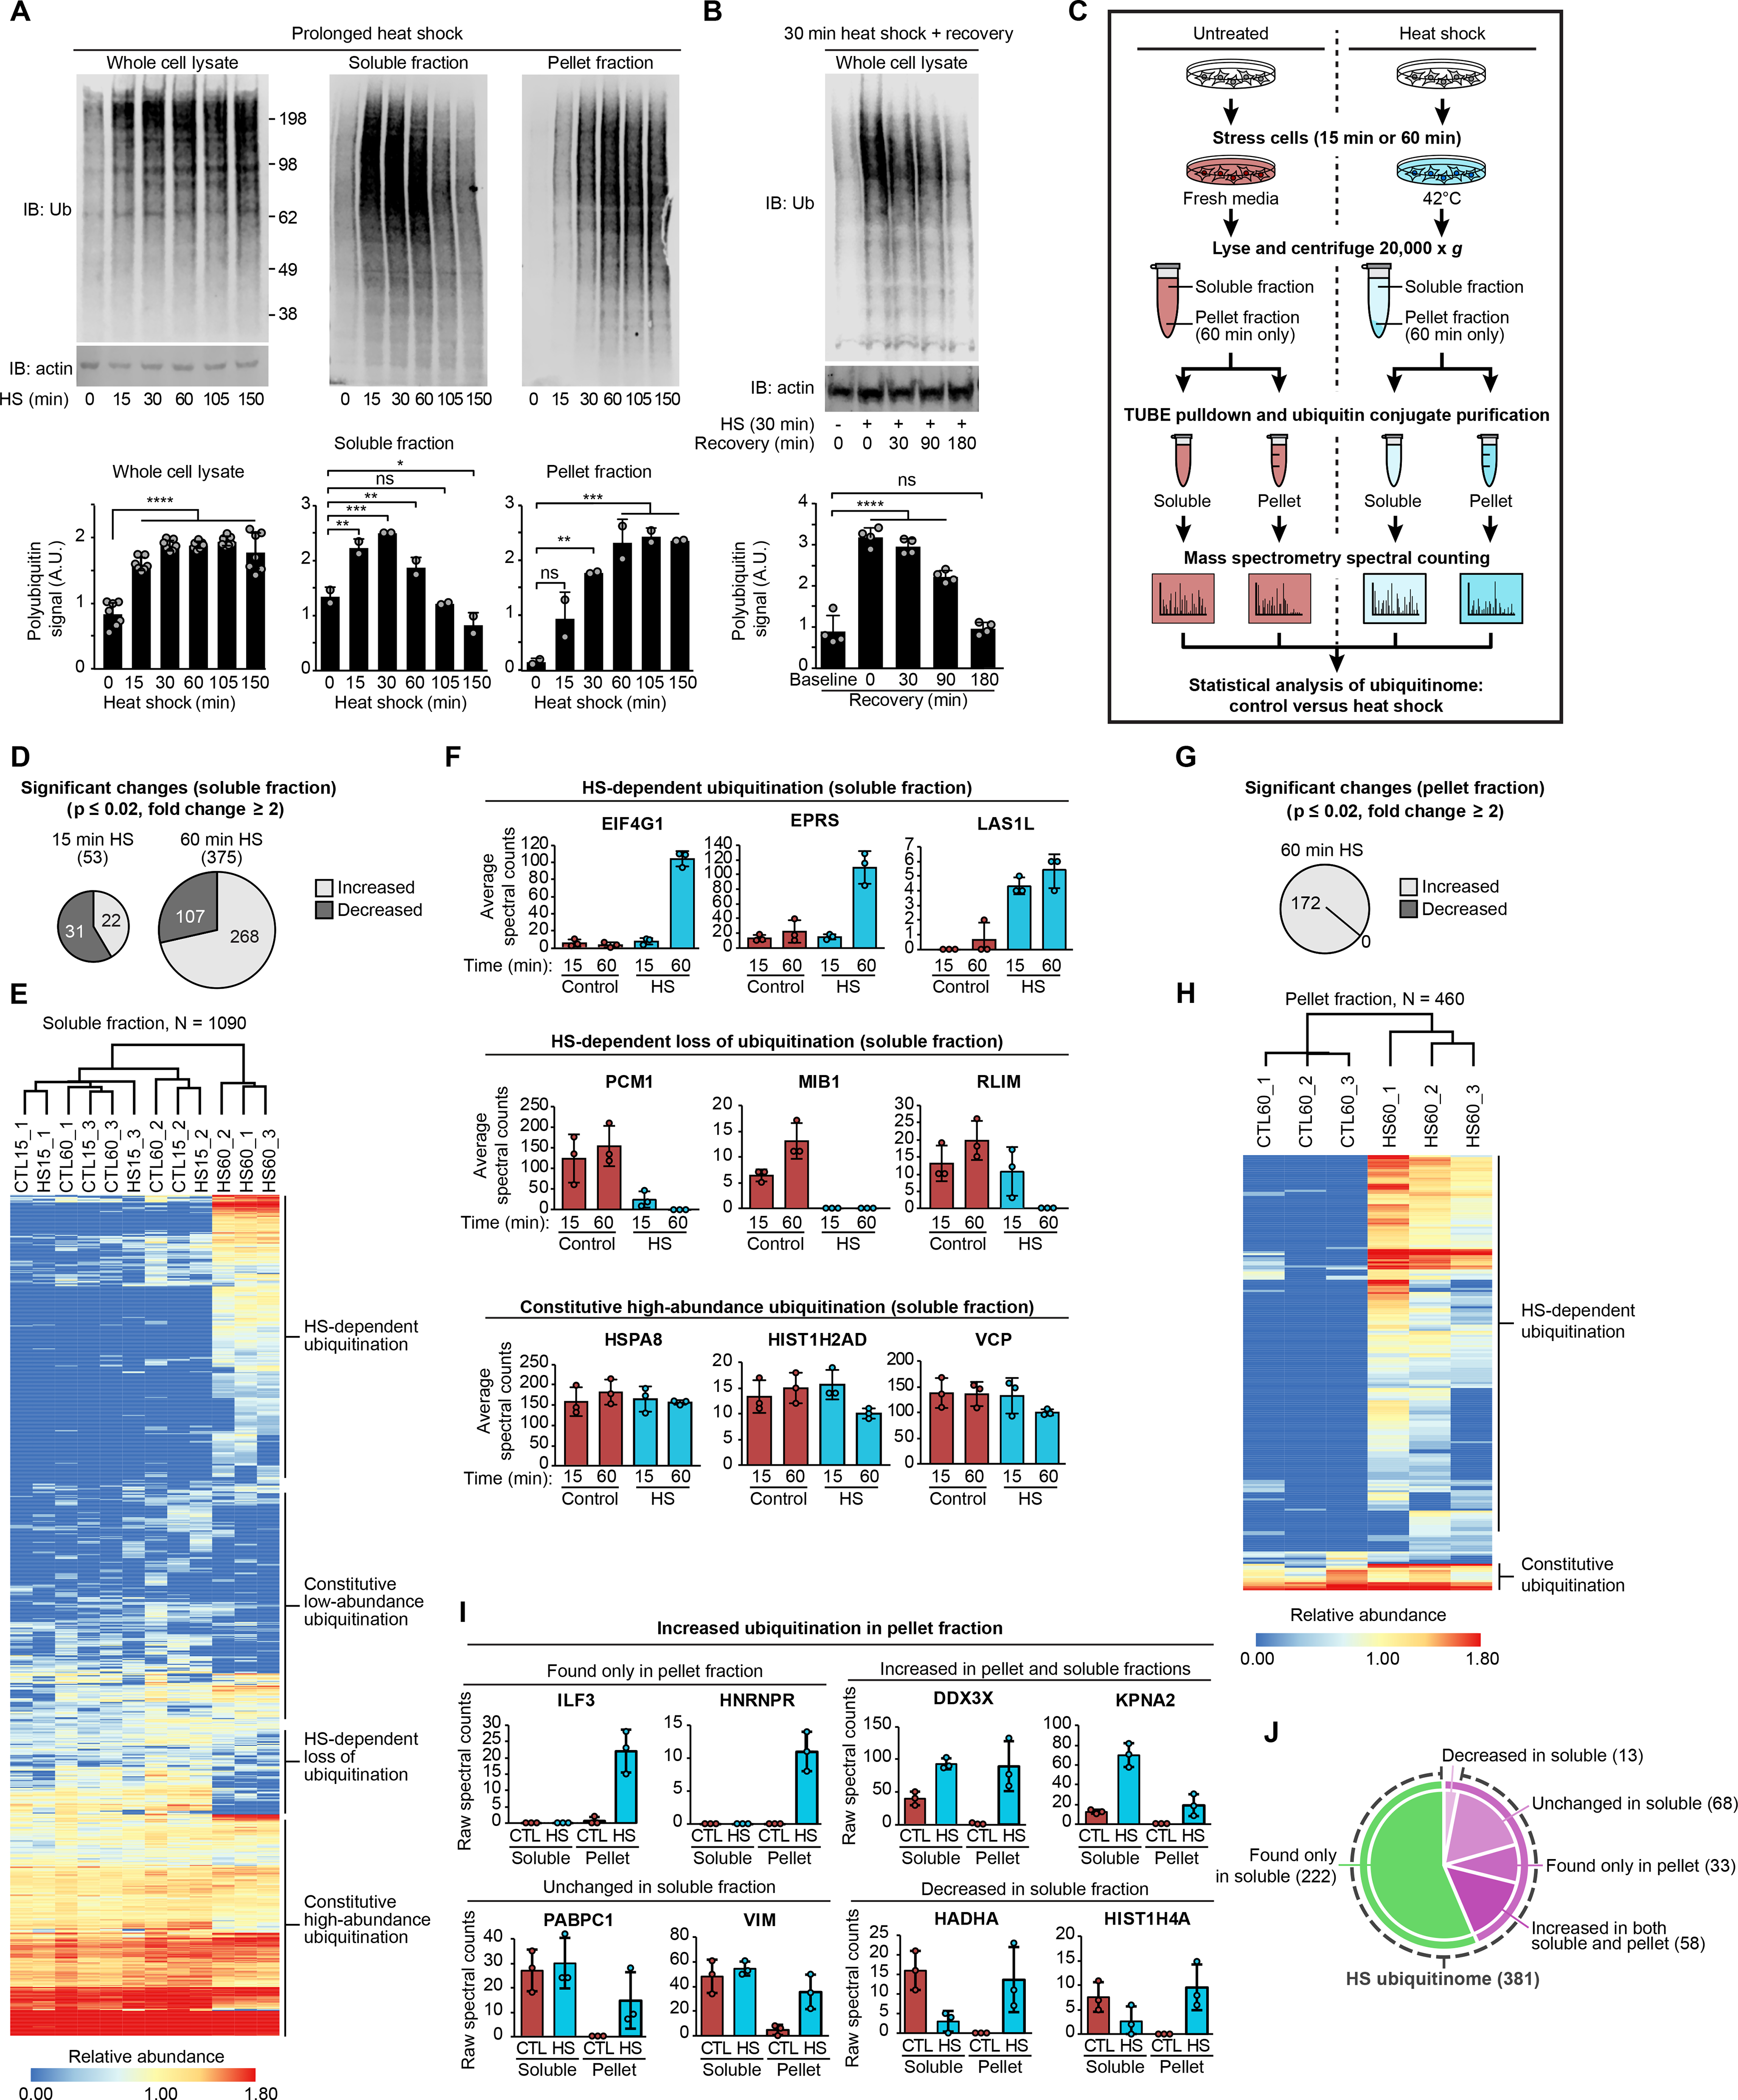
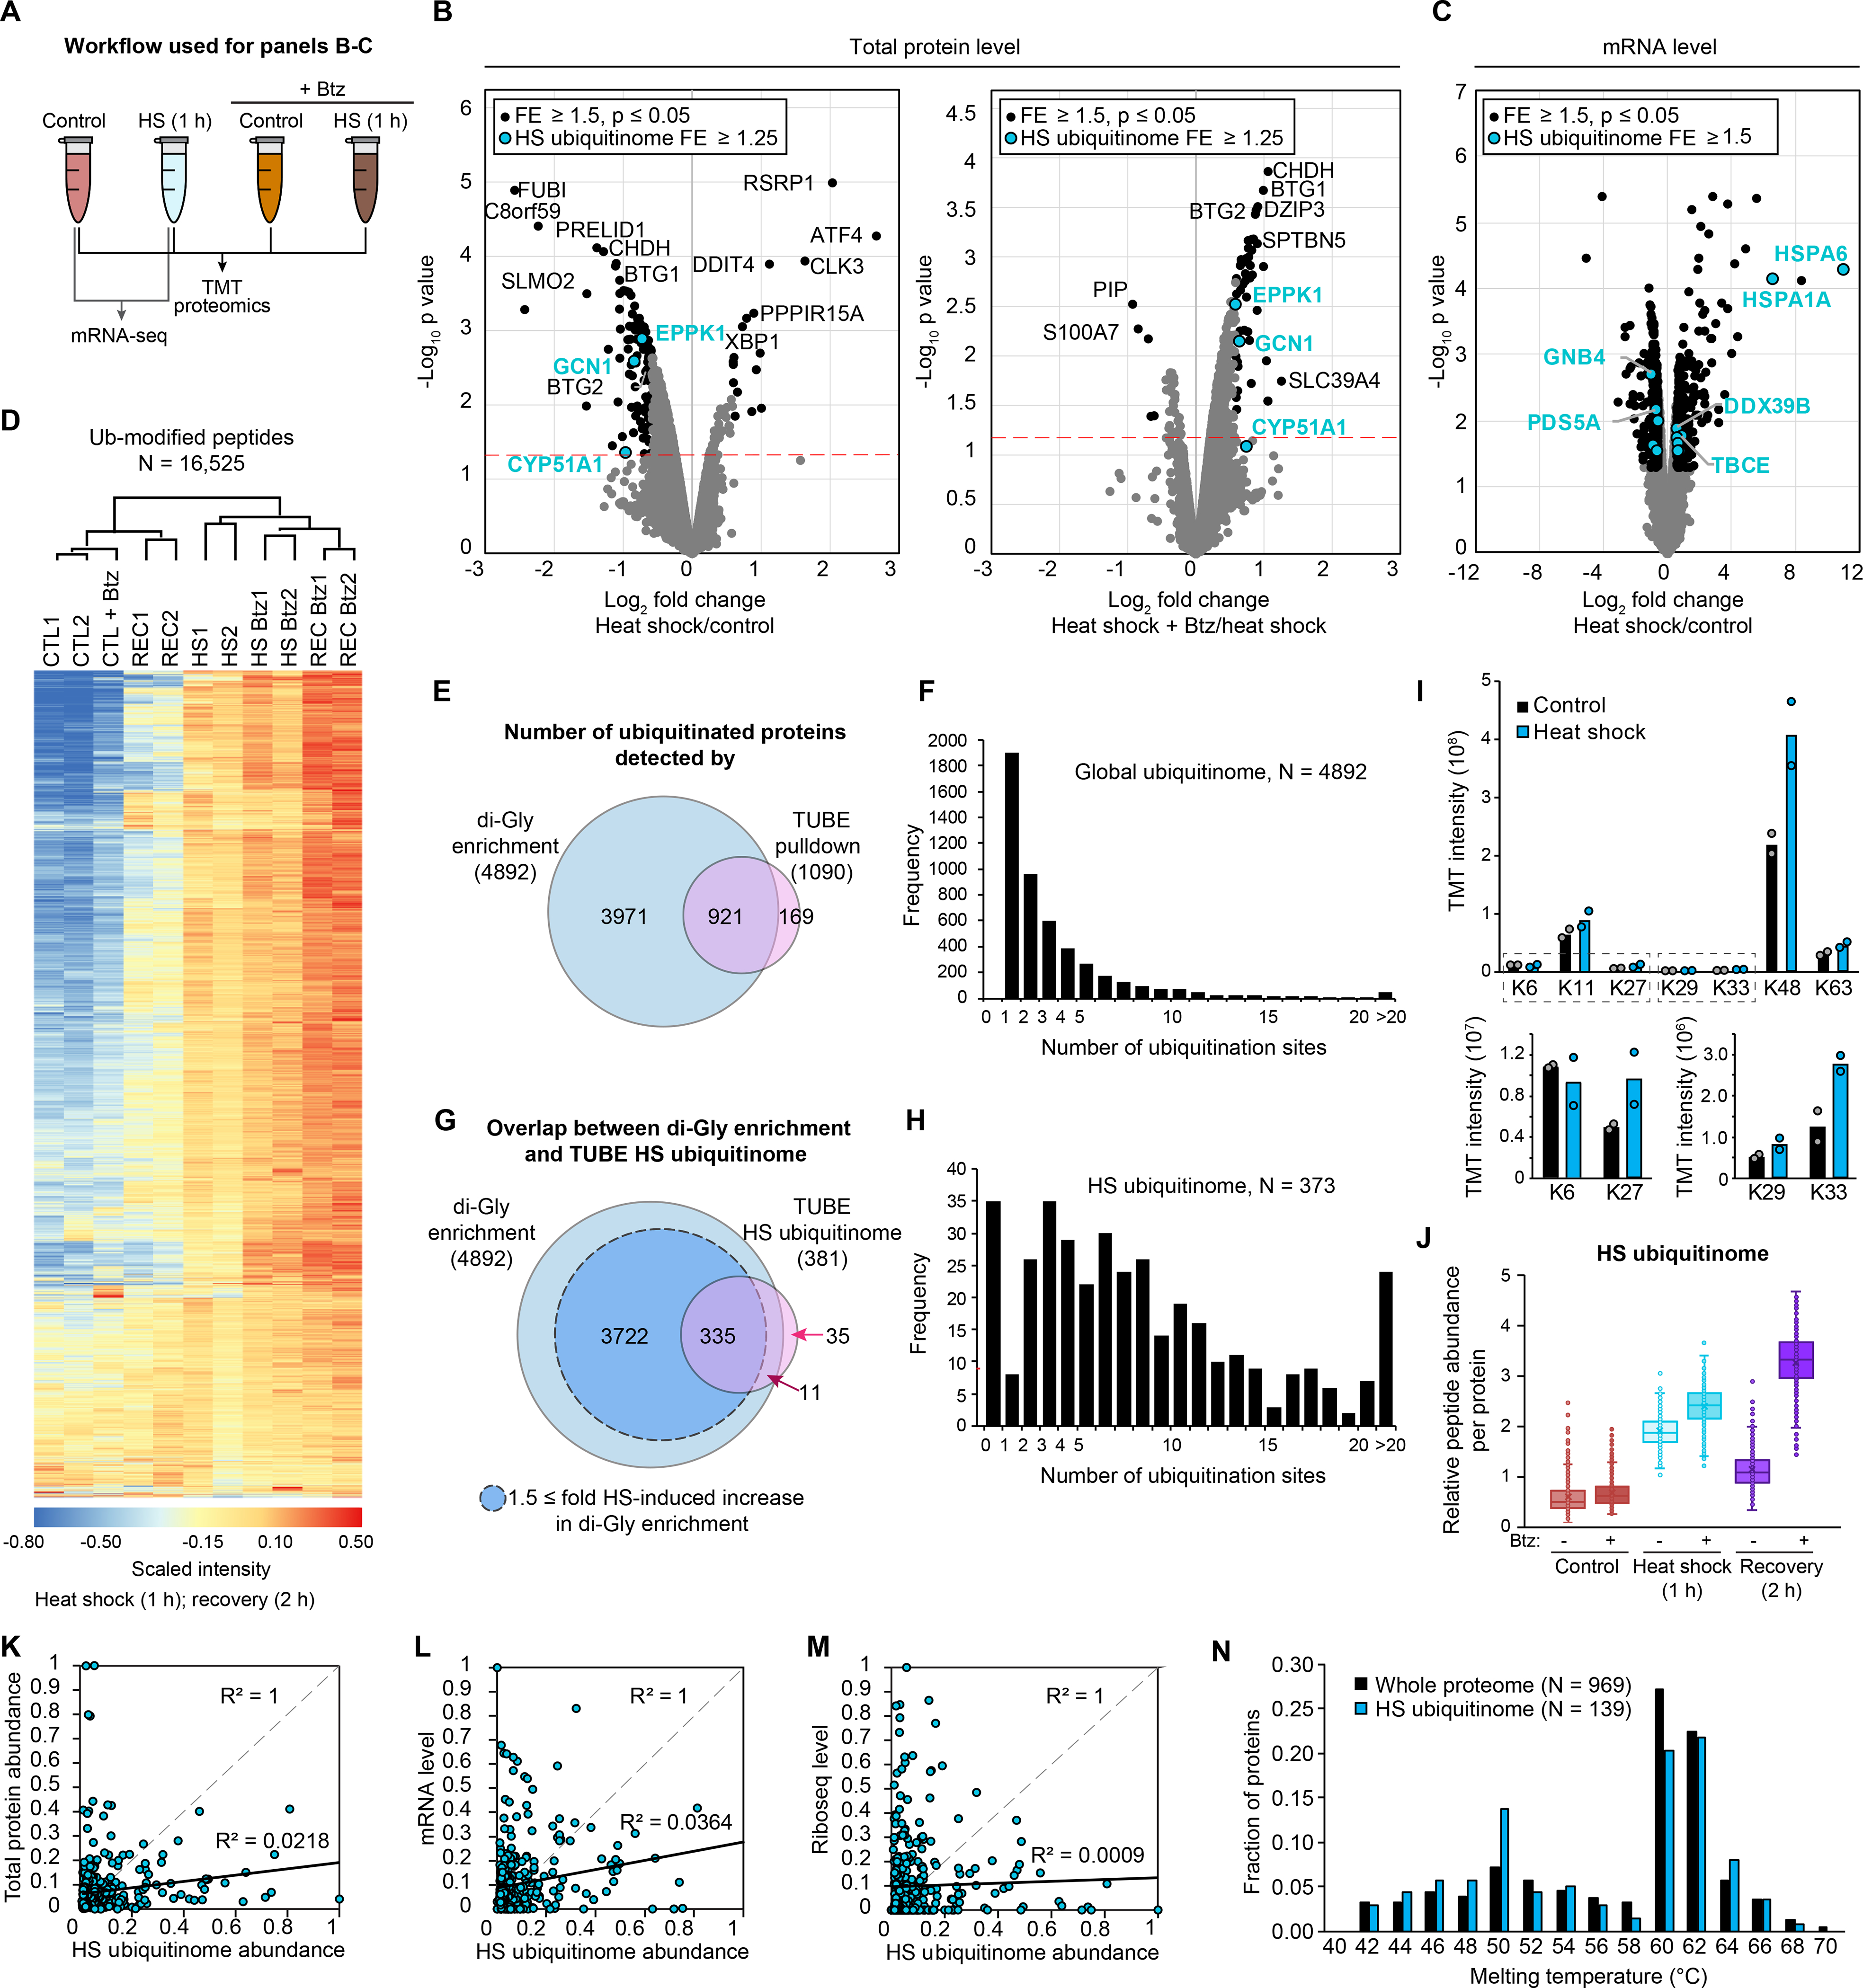
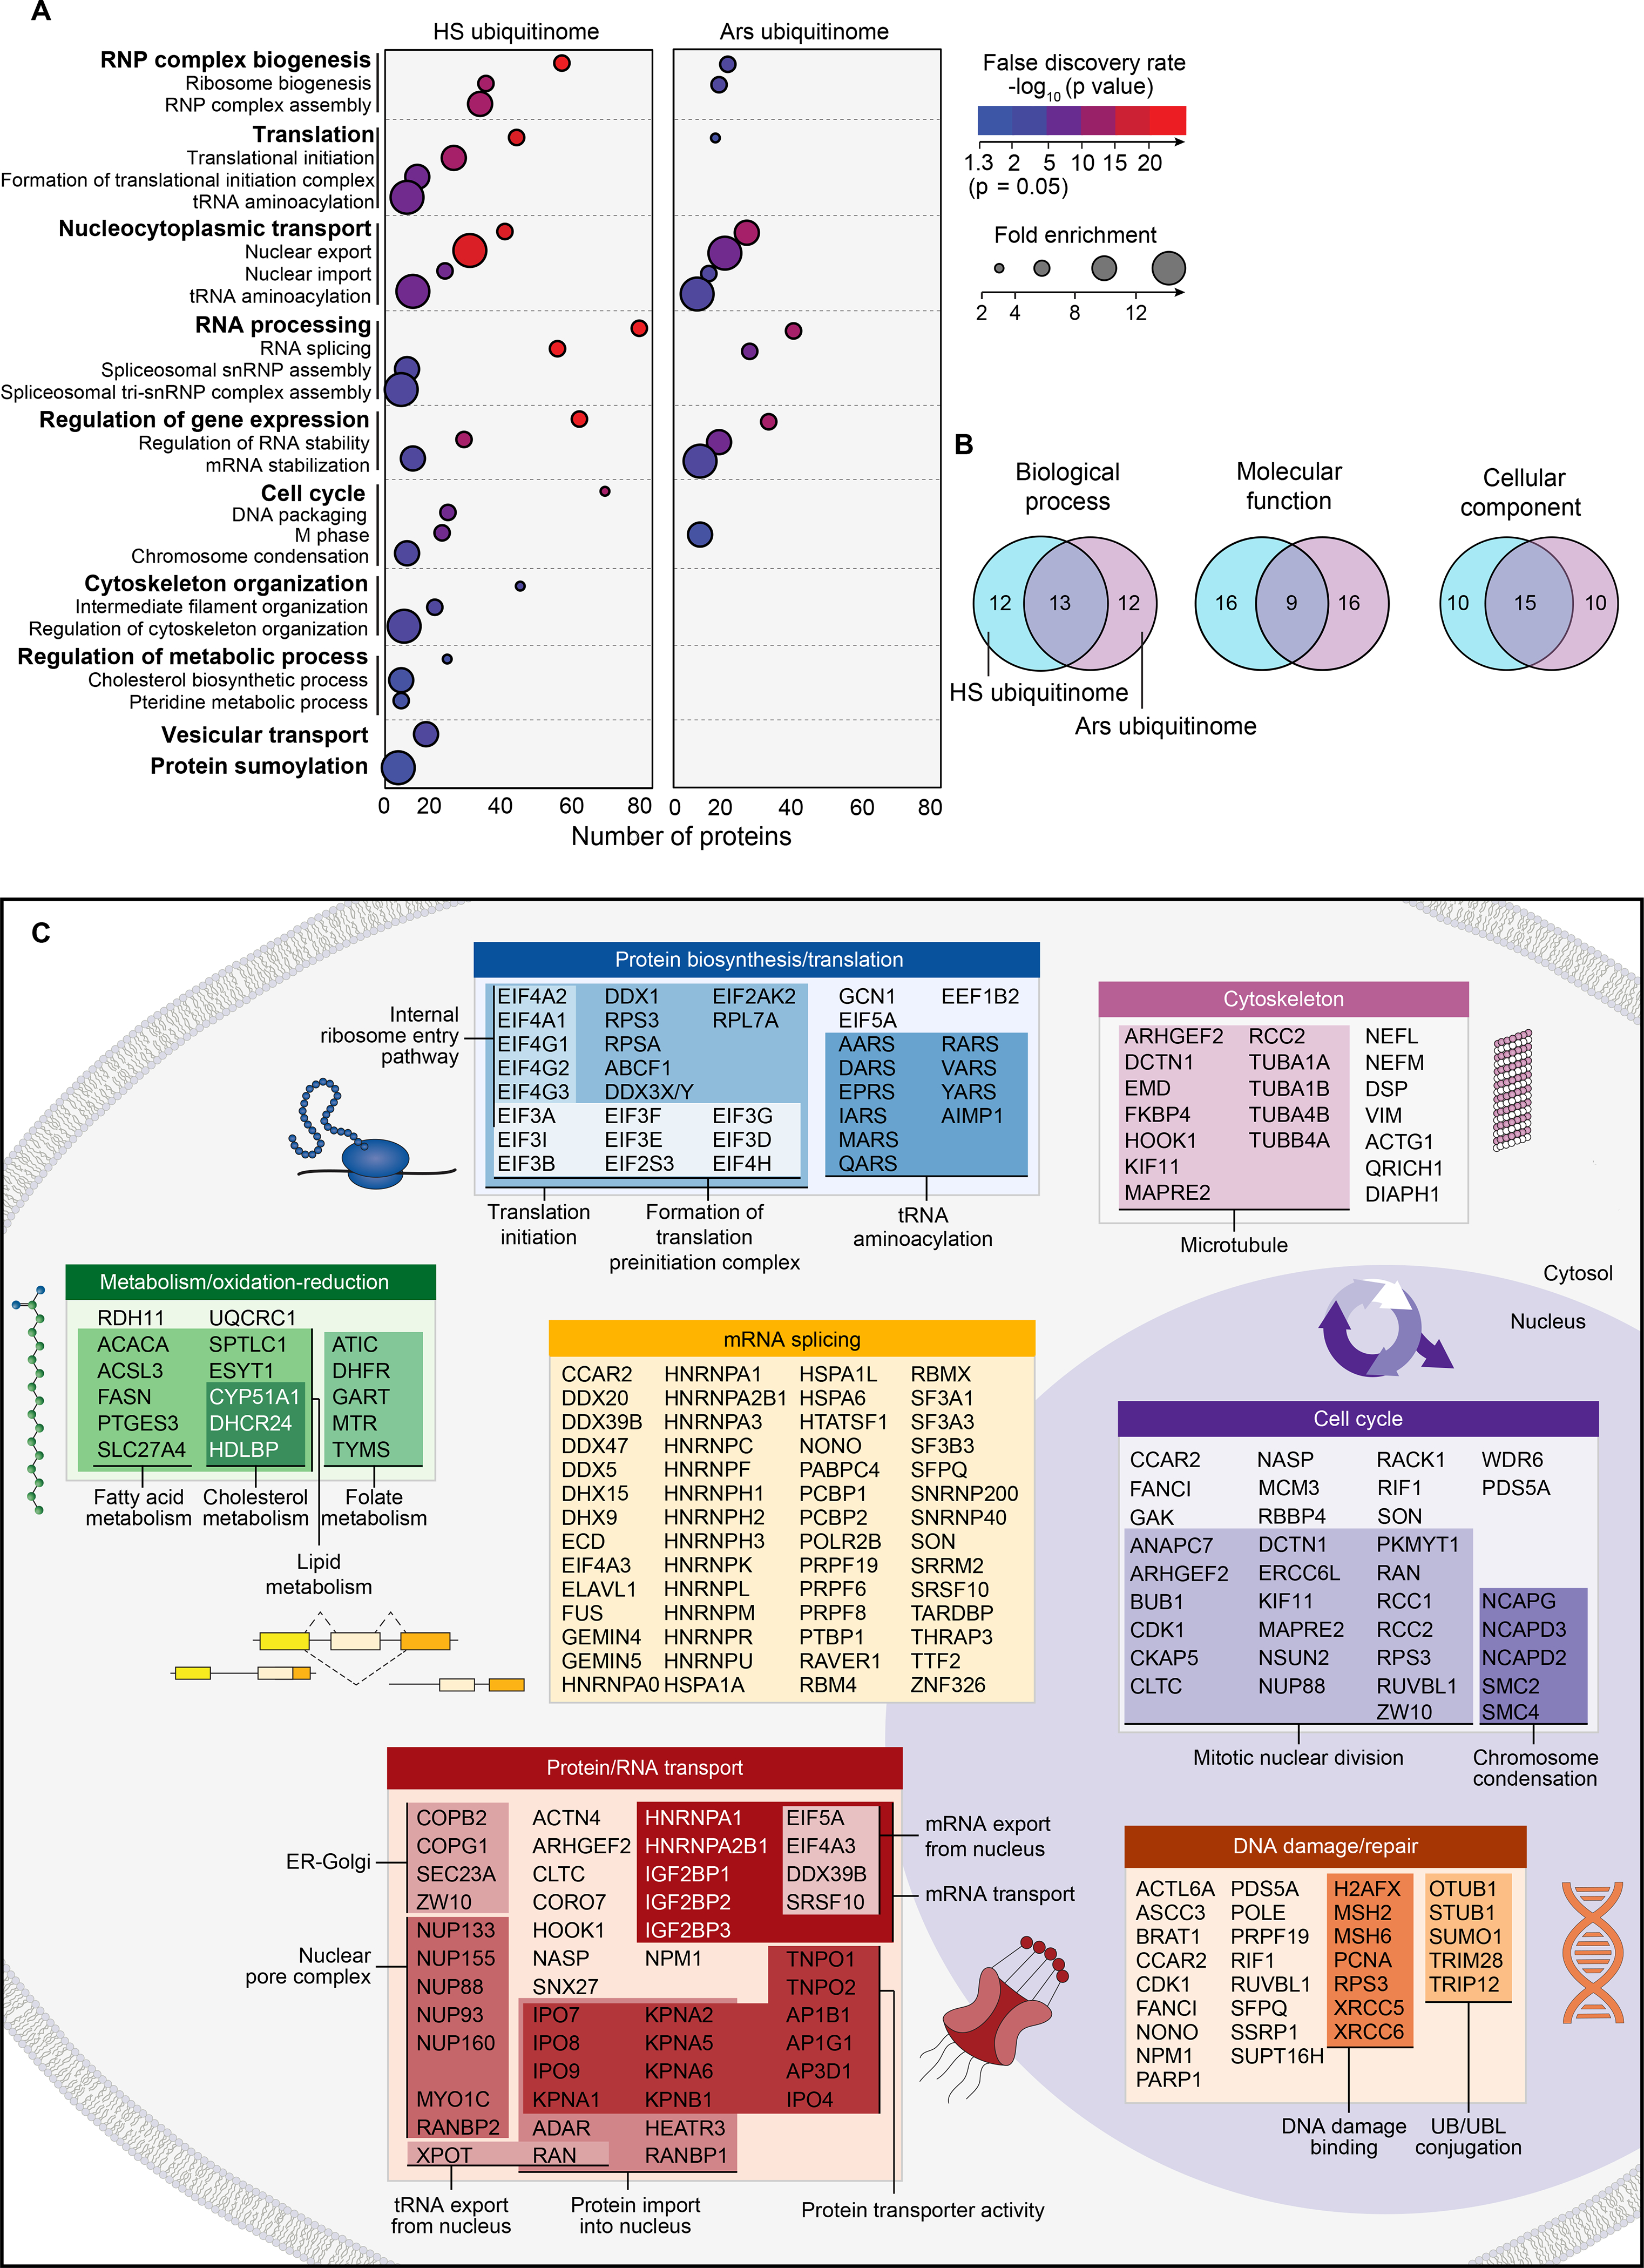
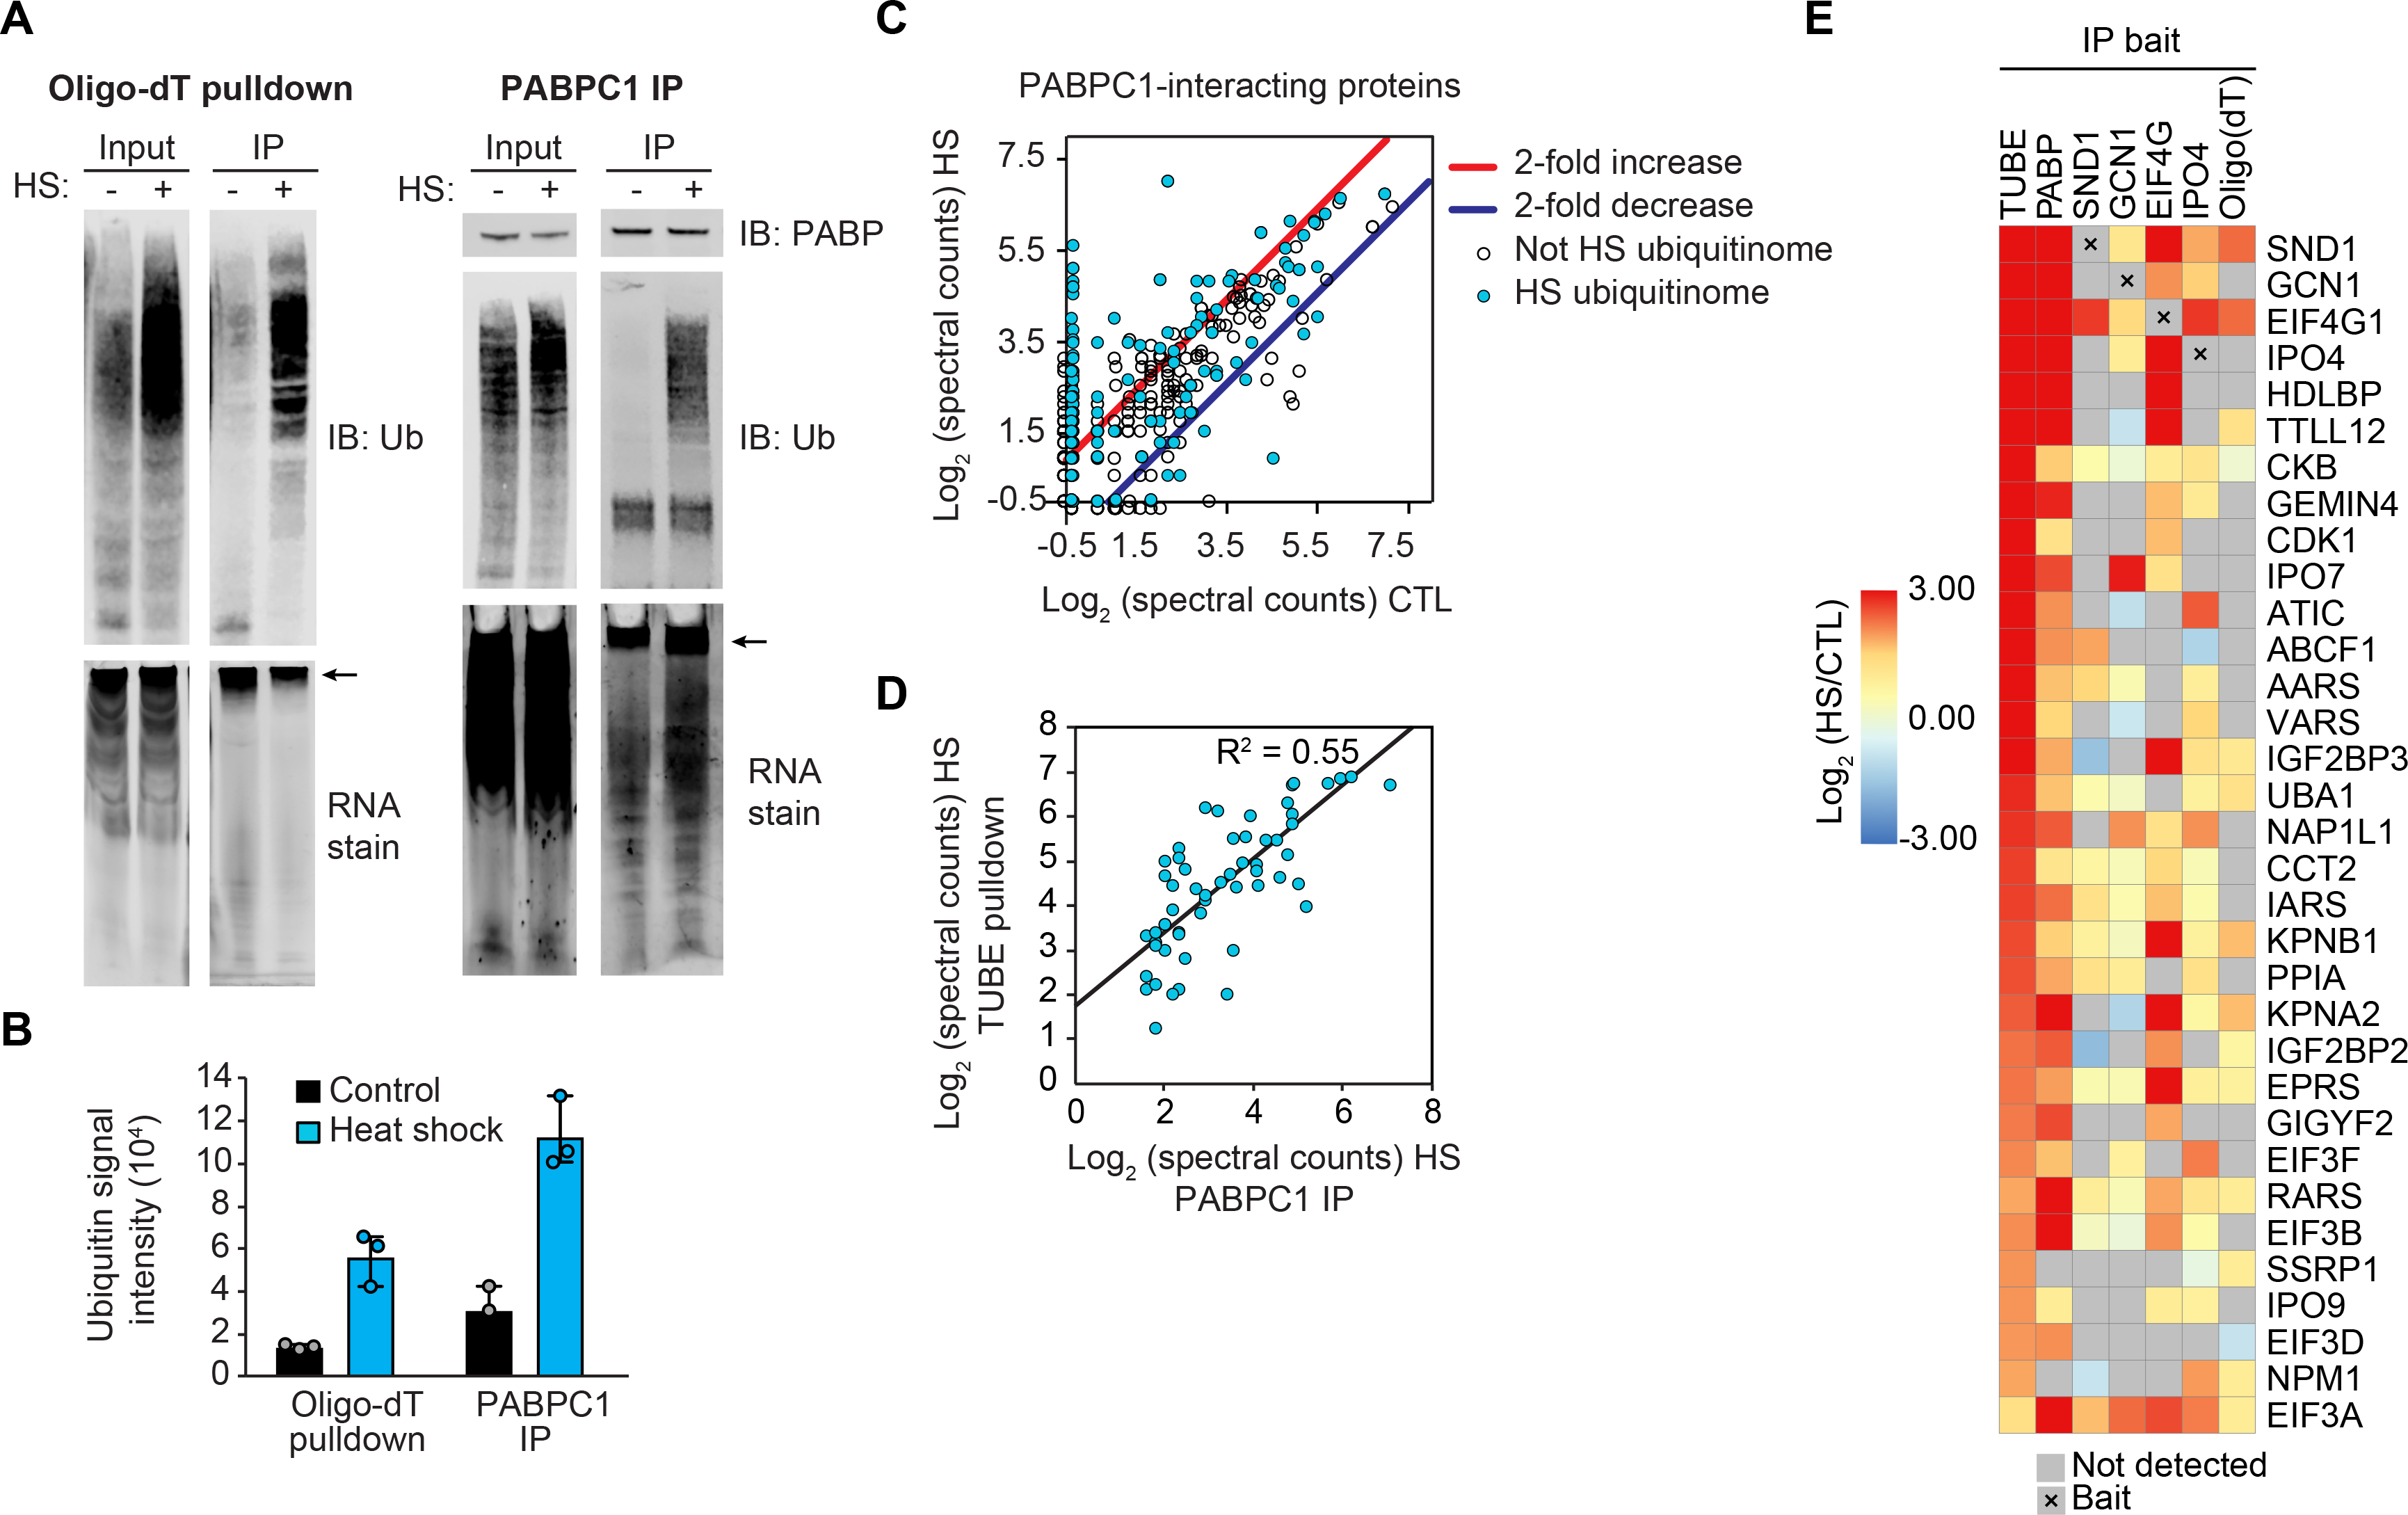
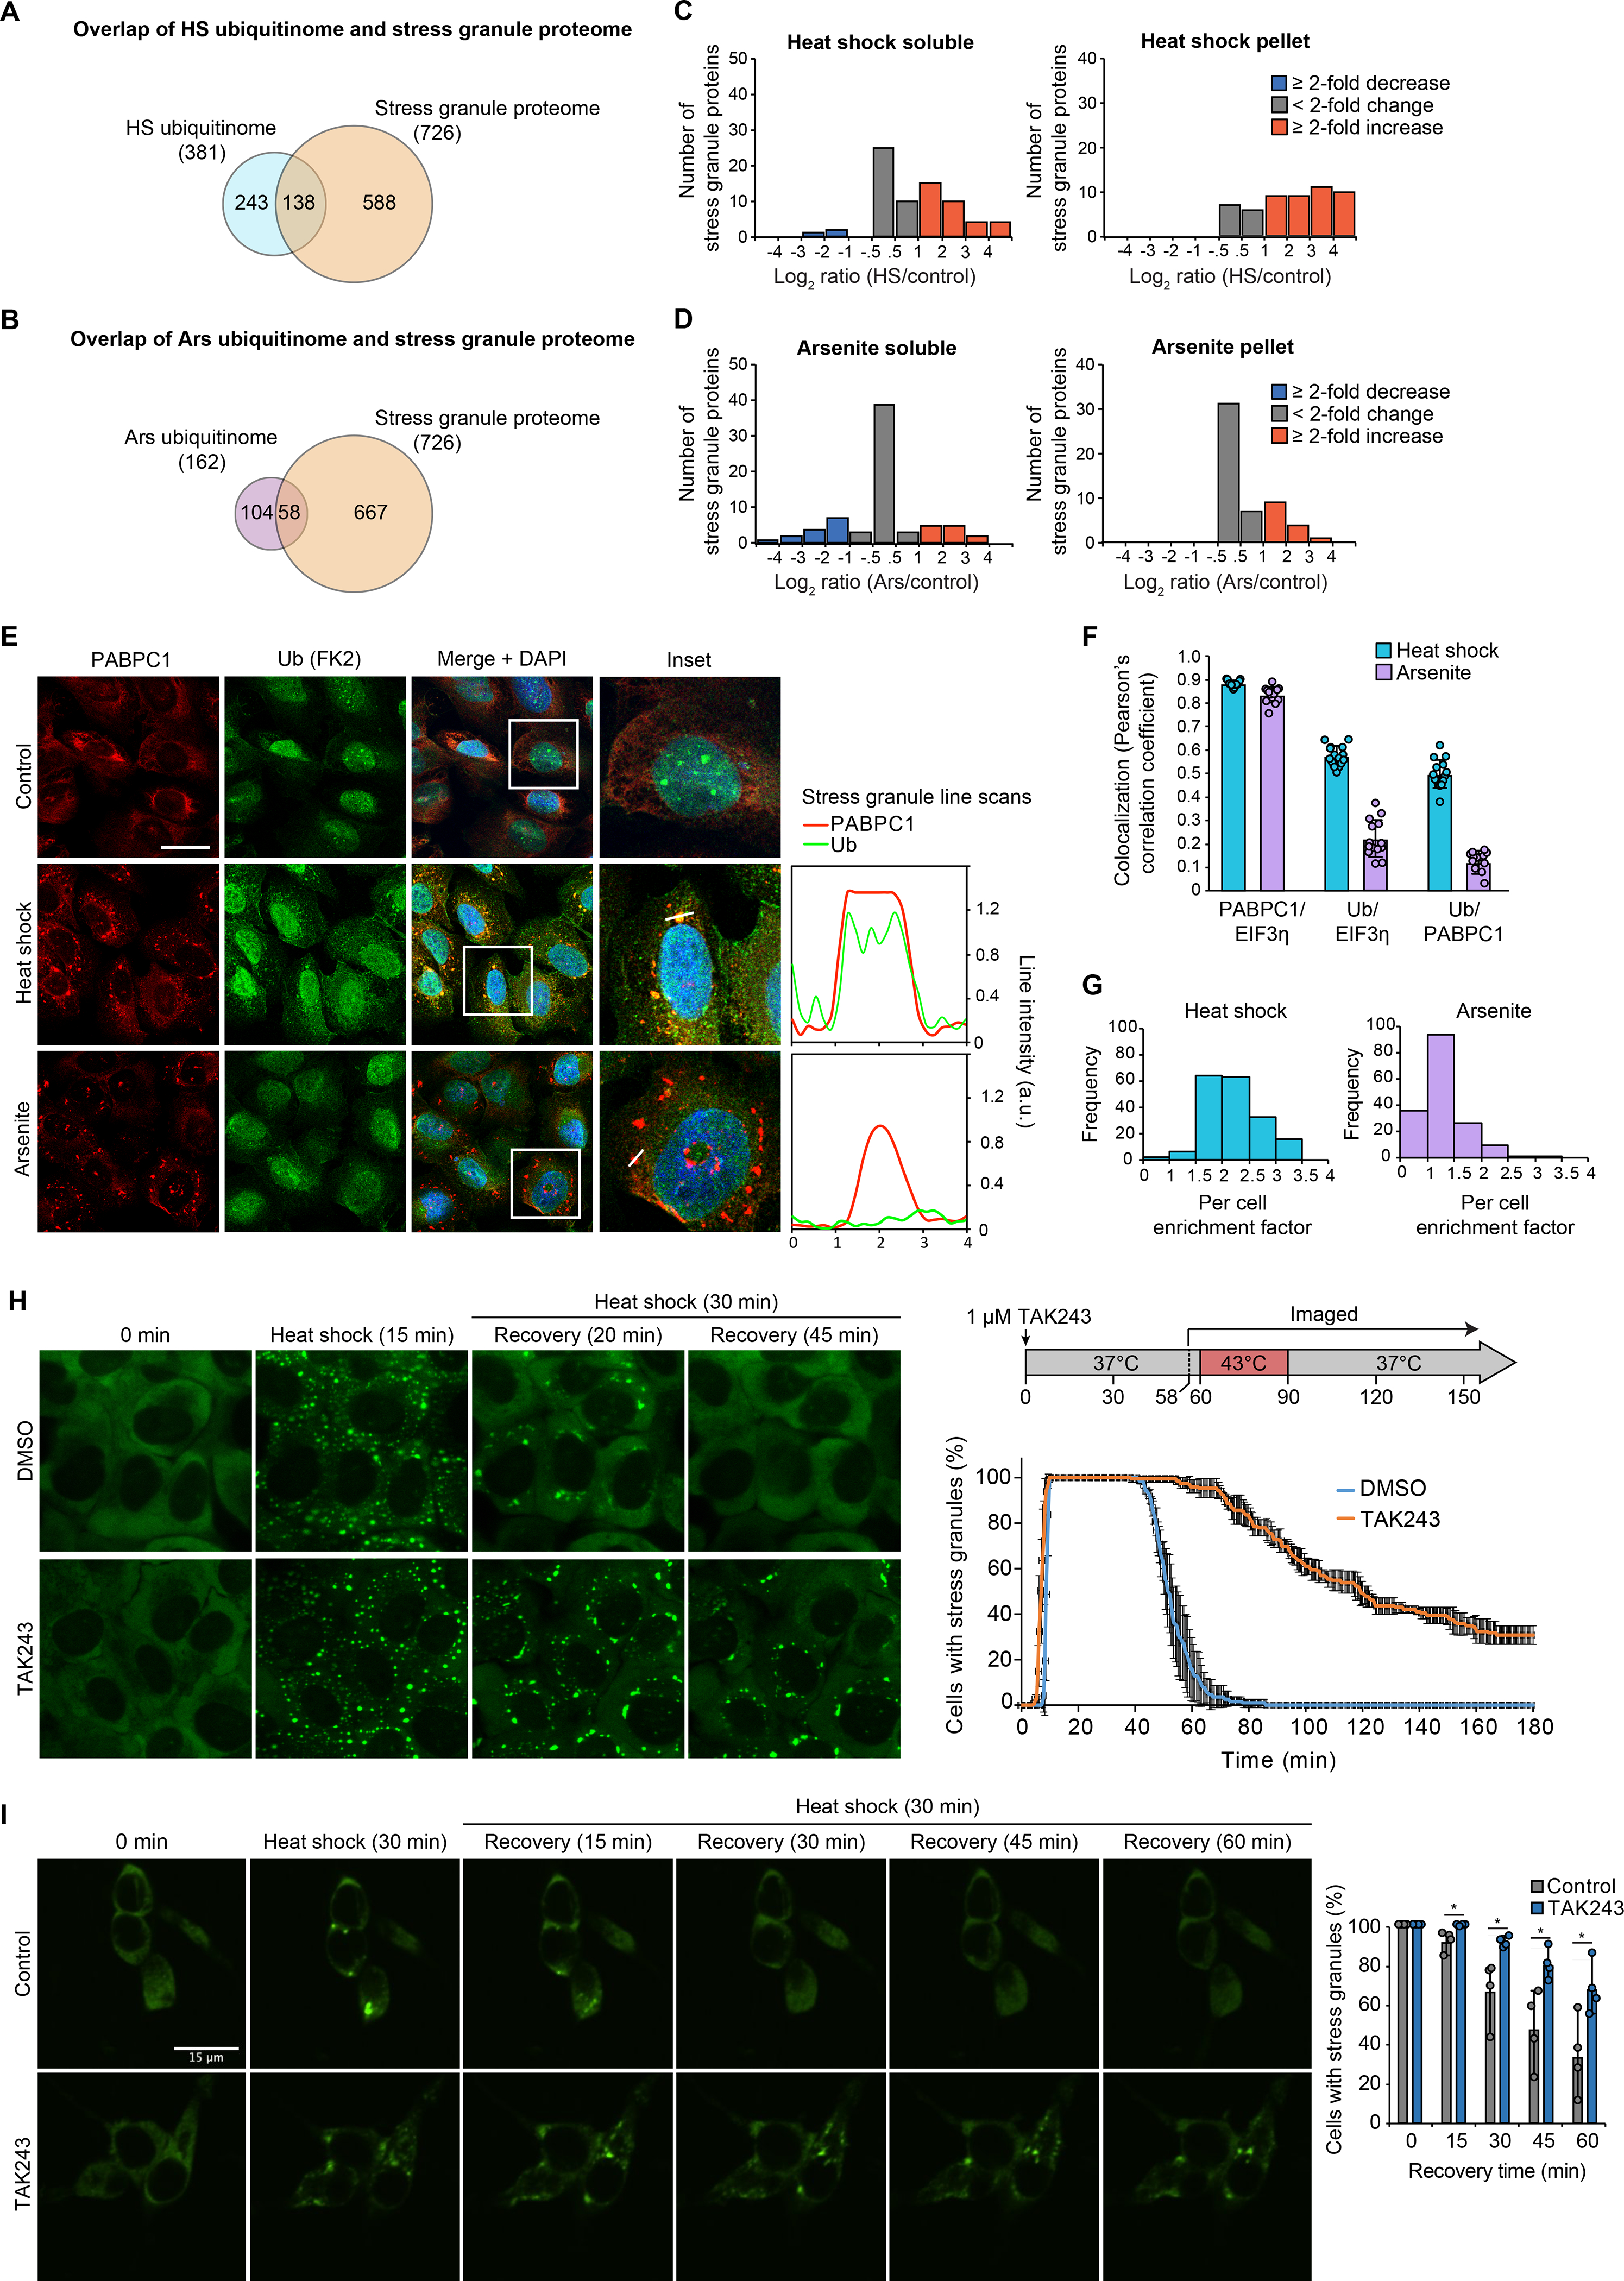
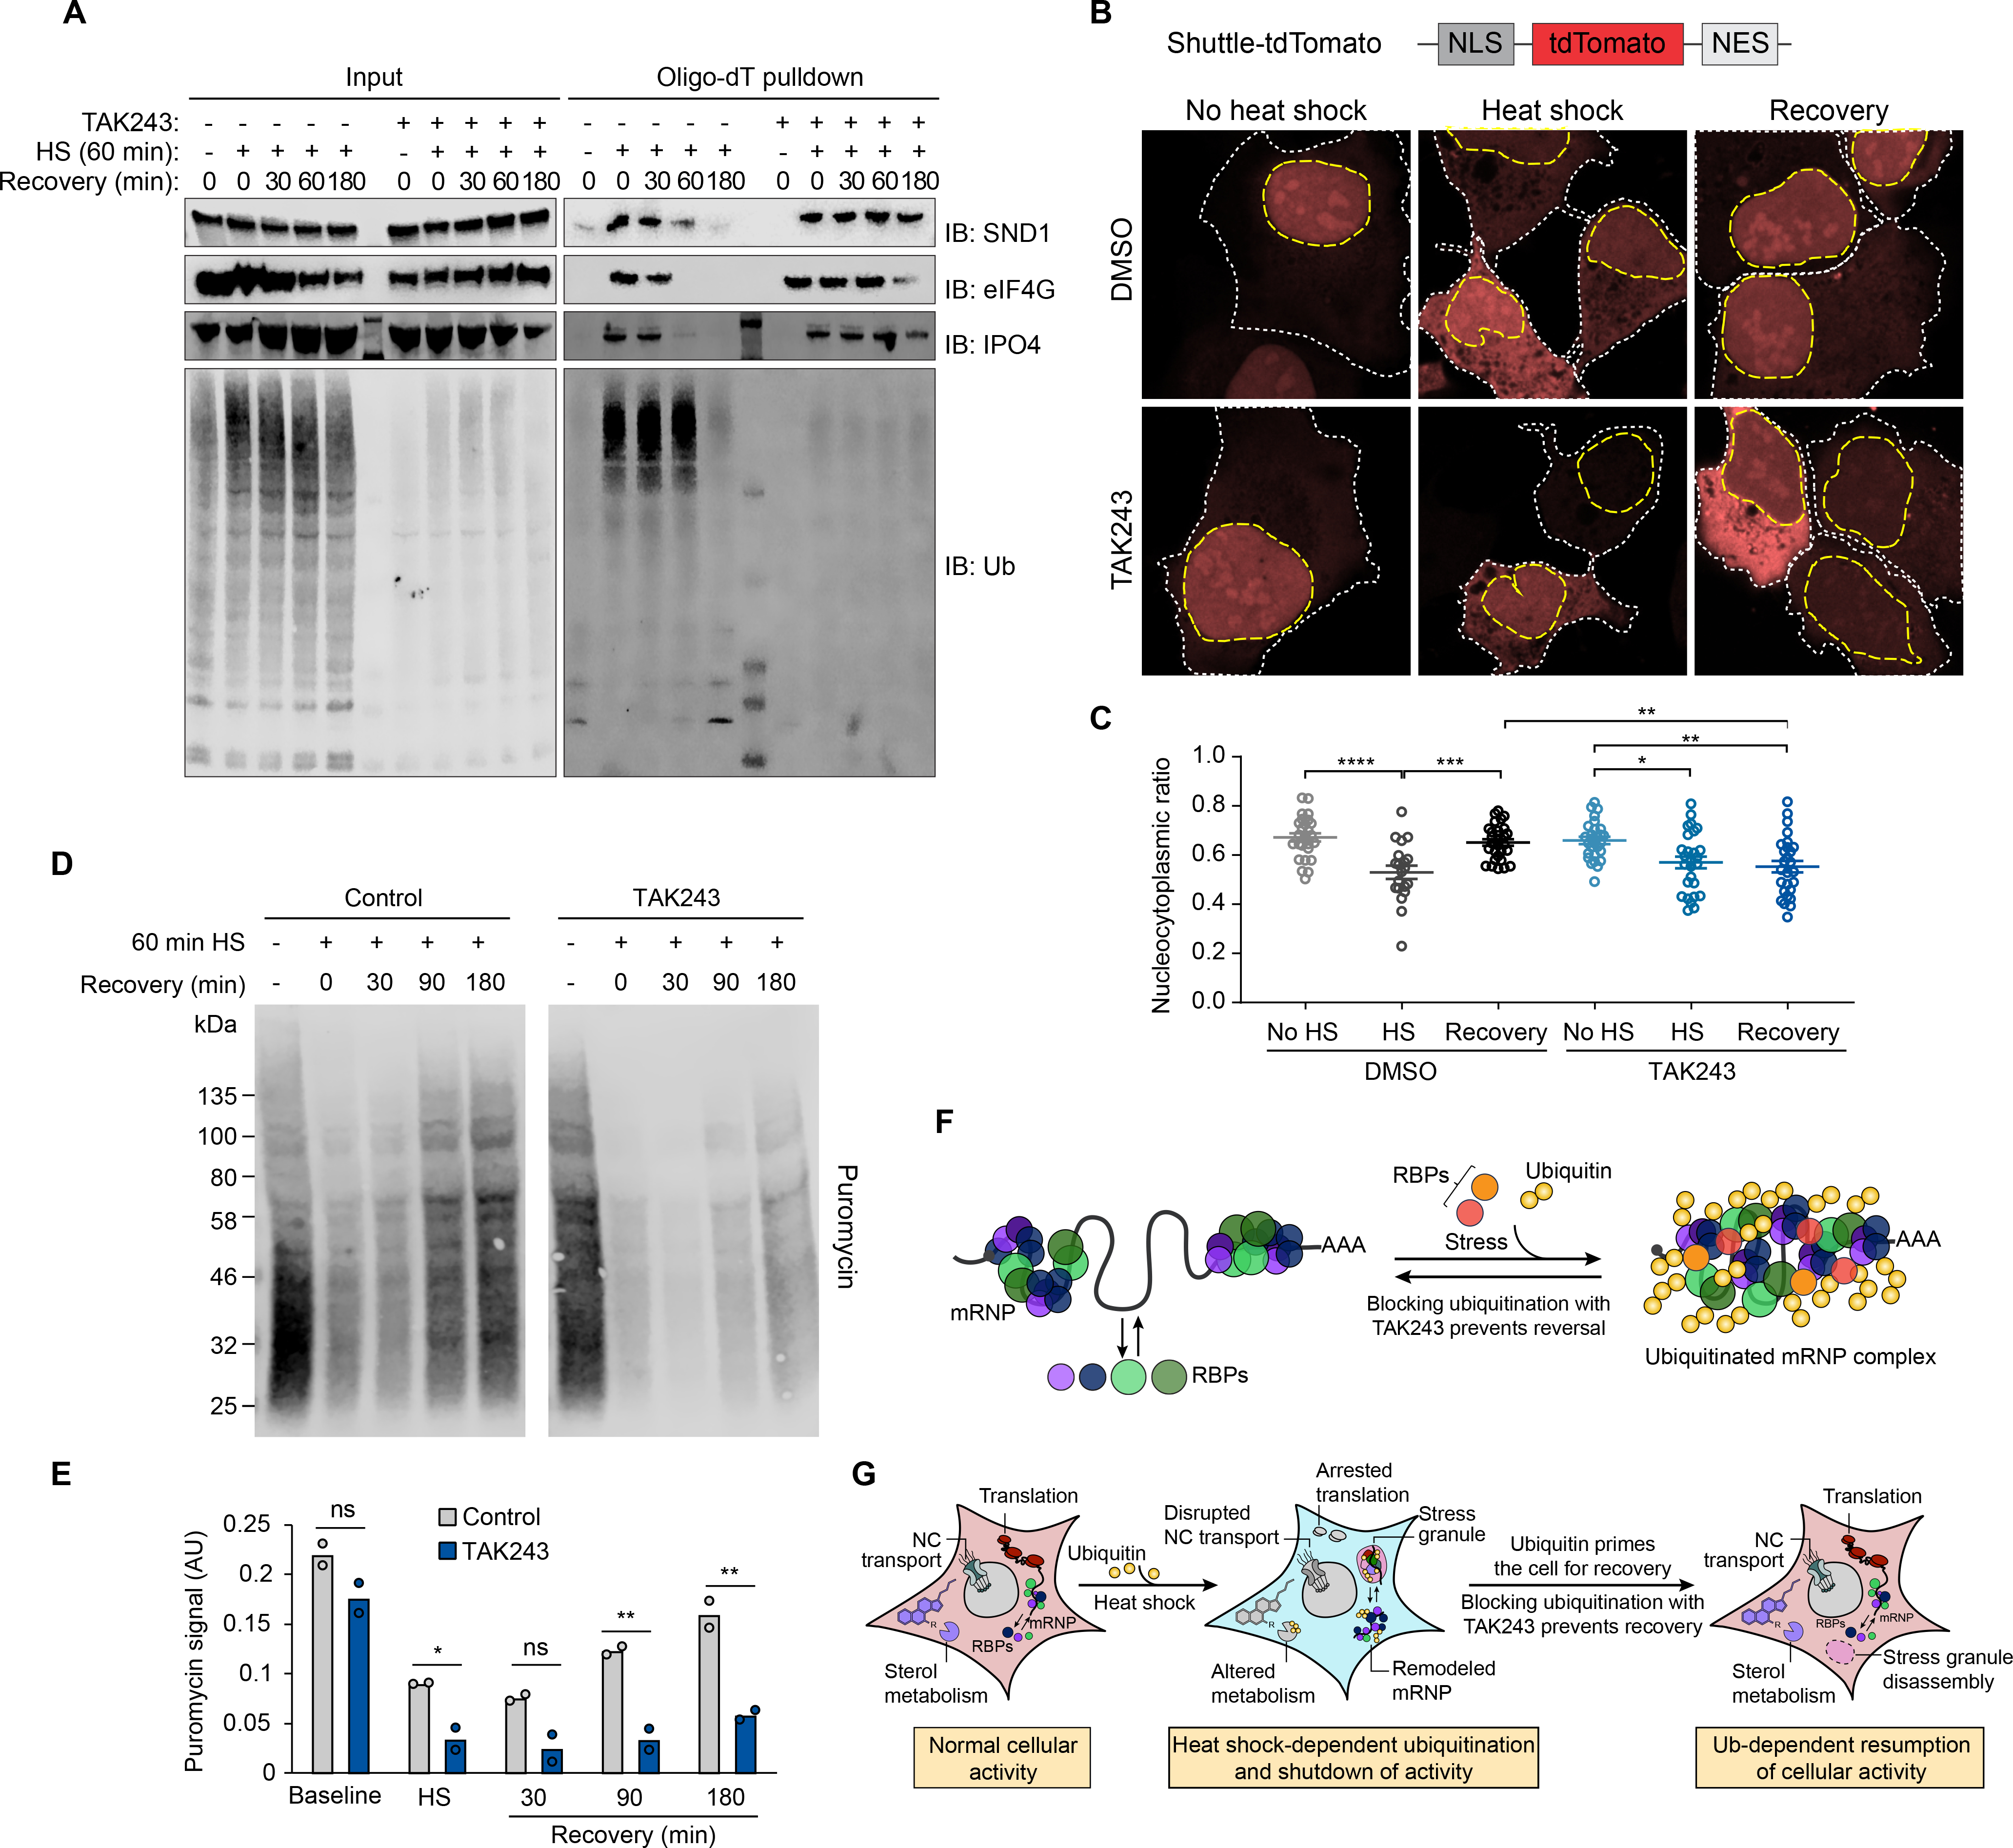
Eukaryotic cells respond to stress through adaptive programs that include reversible shutdown of key cellular processes, the formation of stress granules, and a global increase in ubiquitination. The primary function of this ubiquitination is thought to be for tagging damaged or misfolded proteins for degradation. Here, working in mammalian cultured cells, we found that different stresses elicited distinct ubiquitination patterns. For heat stress, ubiquitination targeted specific proteins associated with cellular activities that are down-regulated during stress, including nucleocytoplasmic transport and translation, as well as stress granule constituents. Ubiquitination was not required for the shutdown of these processes or for stress granule formation but was essential for the resumption of cellular activities and for stress granule disassembly. Thus, stress-induced ubiquitination primes the cell for recovery after heat stress.


Conflict of interest statement

Competing interests: J.P.T. is a consultant for 5AM and Third Rock Ventures.

Figures

Fig. 1.
Fig. 1.. Different cellular stresses induce different patterns of ubiquitination.
(A) Schematic illustrating HALO-linked TUBE resin and ubiquitinated protein capture from HEK293T cells. (B) Workflow for sample preparation and TUBE proteomics. HEK293T cells were treated with the indicated stress or incubated with fresh media for 1 h as a control prior to lysis. For UV treatment, media was removed and cells were briefly exposed to UV light (40 J/m2) followed by the addition of fresh media 1 h prior to lysis. (C) Immunoblot for ubiquitin (P4D1 antibody) showing TUBE capture of ubiquitinated proteins from cells stressed as in (B). (D) Summary of statistics from proteomic analysis. (E) Heatmap illustrating global stress-induced changes to the ubiquitinome. Colors indicate log2 fold change in spectral counts of stressed samples versus control samples. Example groups of proteins with a shared pattern are shown in the blow-ups. (F) UpSet plot indicating proteins changed > 2-fold versus control for each stress.
Fig. 2.
Fig. 2.. Heat shock induces significant changes to the global ubiquitinome.
(A-B) Immunoblots showing ubiquitin conjugation levels at time points following heat shock (A) and during recovery from 30 min heat shock (B) in HEK293T whole cell lysates, soluble fractions, and pellet fractions after centrifugation (14,000 x g). Bar graphs indicate mean + s.d. and individual values for quantification of Western blots from ≥ 3 replicates for each experiment. ns, not significant; *P < 0.05, **P < 0.01, ***P < 0.001, ****P < 0.0001, ANOVA with Dunnett’s test. (C) Workflow for samples from HEK293T cells. (D) Charts indicating the number of significantly changed proteins in soluble fractions for heat-shocked samples (15 min or 60 min) compared to control. (E) Heatmap illustrating heat shock-induced changes to the global ubiquitinome in soluble fractions. Colors indicate relative abundance as quantified by spectral counting. (F) Spectral count values for representative proteins of indicated categories; individual values and mean (± s.d.) are shown from three replicates of each sample condition in soluble fractions. (G) Chart indicating the number of significantly changed proteins in pellet fractions for heat-shock samples compared to control. (H) Heatmap illustrating heat shock-induced changes to the global ubiquitinome in pellet fractions. (I) Spectral count values for representative proteins of indicated categories; individual values and mean (± s.d.) are shown from three replicates of each sample condition. CTL, control; HS, 60 min heat shock. (J) Chart indicating the number of proteins with heat shock-dependent increase in ubiquitination. Proteins detected in the pellet fraction are shown in purple, proteins detected only in the soluble fraction are shown in green. Dashed line indicates categories included in the heat shock ubiquitinome.
Fig. 3.
Fig. 3.. Proteomic and transcriptomic analyses reveal additional details of the heat shock ubiquitinome.
(A) Workflow for analysis in HEK293T cells. (B-C) Volcano plots indicating (B) changes in protein abundance for heat shock versus control samples (left) and versus heat shock with proteasome inhibitor bortezomib (Btz) (right) and (C) changes in mRNA levels in response to heat shock (C). Statistically significant changes are shown for the whole proteome or transcriptome (black dots) and heat shock ubiquitinome (blue dots). Red dashed lines indicate P = 0.05. (D) Heatmap of changes to the ubiquitinome in HEK293T cells following 1 h heat shock (HS) and 1 h heat shock followed by a 2 h recovery (REC) in the presence or absence of bortezomib as determined by di-GLY profiling. Color indicates scaled TMT intensity. (E) Venn diagram showing overlap of ubiquitinated proteins detected in di-GLY and TUBE experiments. (F) Histogram showing the number of ubiquitination sites per protein detected for all proteins in di-GLY experiments. (G) Venn diagram showing overlap of heat shock-dependent increases in ubiquitination as determined by di-GLY and TUBE experiments. (H) Histogram showing the number of ubiquitination sites per protein for the heat shock ubiquitinome. (I) Bar graphs indicating TMT intensity for each poly-ubiquitin linkage type. Mean and individual values are shown. (J) Box-and-whisker plots showing relative abundance of ubiquitinated proteins for heat shock ubiquitinome proteins. (K-M) Correlation between abundance of heat shock ubiquitinome proteins in TUBE experiments and total protein abundance (K), transcript abundance (L), and ribosome occupancy (M) as determined by Ribo-seq, with R2 values displayed. (N) Histogram showing melting temperatures as determined in reference (54) for all proteins measured (black bars) and measured heat shock ubiquitinome proteins (blue bars).
Fig. 4.
Fig. 4.. The heat shock ubiquitinome consists of proteins from biological pathways associated with the stress response.
(A) Dot plot of gene ontology (GO) enrichment showing significantly overrepresented GO terms for heat shock and arsenite ubiquitinomes in HEK293T cells. Color indicates FDR P value and dot size indicates overrepresentation fold enrichment compared to the whole genome. Dots are not shown for terms with no statistically significant (P < 0.05) enrichment. (B) Overlap of top 25 GO as terms ranked by statistical significance (FDR P value) for heat shock and arsenite ubiquitinomes. (C) DAVID functional clustering of the heat shock ubiquitinome along with literature curation was used to identify pathways targeted by heat shock-induced ubiquitination.
Fig. 5.
Fig. 5.. Heat shock induces ubiquitination of mRNP complexes.
(A) Immunoblots and RNA gels showing polyadenylated mRNA isolated by oligo(dT) resin (left) or PABPC1 immunoprecipitation (right) pulling down poly-ubiquitinated proteins from HEK293T cells after 60 min heat shock. Isolated mRNA was visualized by SYBR orange RNA stain; arrow indicates high molecular weight RNA. (B) Quantification of immunoblot analysis for ubiquitin conjugation shown in (A). Results represent mean and individual values of 3 replicate experiments. Error bars indicate data range. (C) Scatter plot showing abundance (log2 [spectral counts]) of PABPC1-interacting proteins in heat shock versus control conditions. Results represent averages of 2 replicates. Lines indicate 2-fold increase (red) or decrease (blue) with heat shock; blue dots indicate heat shock ubiquitinome proteins. (D) Correlation between abundance of heat shock ubiquitinome proteins detected in TUBE pulldown and PABPC1 IP in 60 min heat-shocked samples. (E) Heatmap illustrating changes in abundance in 60 min heat shock versus control samples for proteins detected in TUBE pulldown, endogenous protein IP (PABP, SND1, GCN1, EIF4G, IPO4), or oligo(dT) pulldown.
Fig. 6.
Fig. 6.. Heat shock-induced stress granules contain ubiquitinated proteins and require active ubiquitination for disassembly.
(A-B) Overlap of heat shock (A) and arsenite (B) ubiquitinomes of HEK293T cells with the stress granule proteome. (C-D) Histograms showing changes in ubiquitinated protein abundance for high-confidence stress granule proteins in response to 60 min heat shock (C) or 60 min arsenite (D) as determined by TUBE (tables S2 and S5). (E) U2OS cells were exposed to 90 min of sodium arsenite or heat shock, fixed, and stained for stress granule markers PABPC1 (red), EIF3η (not shown), and poly-ubiquitin (FK2, green). Graphs represent a line scan of signal intensity for PABPC1 and FK2 channels across the indicated stress granule. Scale bar, 50 μm. (F) Co-localization between immunofluorescent signal for PABPC1 and EIF3η and poly-ubiquitin as determined images collected as in (E). Bar graphs represent mean (± s.d.) and individual Pearson’s correlation coefficient values for > 10 images (total of > 100 cells for each condition). (G) Histogram of enrichment factor of ubiquitin in stress granules (ratio of the mean intensity of FK2-ubiquitin signal in granules to the mean intensity of the total cell area, excluding granules) for > 100 cells for each condition. (H-I) Live cell imaging of cells stably expressing GFP-G3BP1 during heat stress and recovery in the presence or absence of TAK243 for U2OS cells (H) or iPSC-derived neurons (I). Plots show the percentage of cells with ≥ 2 stress granules at the indicated time, with (H, line graph) solid lines and error bars representing average values and s.d. for three biological replicates with 30–50 cells each and (I, bar graph) mean, data range (error bars in I) and individual values shown for four biological replicates with 48–120 neurons each.
Fig. 7.
Fig. 7.. Ubiquitination is required for the recovery of nucleocytoplasmic transport and translation following heat shock.
(A) Immunoblot showing formation and dissolution of poly-ubiquitinated protein-mRNA complex during heat shock and isolated by oligo(dT) resin. Where indicated, TAK243 was added to media 30 min prior to heat shock and maintained for the duration of the experiment. In drug-treated unstressed samples, HEK293T cells were incubated with TAK243 for 180 min prior to lysis. (B) HEK293T cells expressing nucleocytoplasmic transport reporter NLS-tdTomato-NES were fixed and imaged after no stress, 60 min heat shock, or 60 min heat shock and 120 min recovery. Cells were treated with TAK243 or DMSO for 30 min prior to heat shock or for a total of 120 min in non-heat-shocked cells. Nuclear and cytoplasmic boundaries are indicated with dashed yellow and white lines respectively. (C) Quantification of nucleocytoplasmic ratio of tdTomato intensity from cell images described in (B) from 20–30 cells for each condition. Error bars indicate s.e.m. *P < 0.05, **P < 0.01, ***P < 0.001, ****P < 0.0001, ANOVA with Tukey’s test. (D) Immunoblotting of HEK293T cells treated with puromycin to label nascent transcripts for 30 min prior to heat shock and recovery in the presence or absence of TAK243. Cells were lysed at indicated times and translational activity was analyzed by immunoblotting for puromycin. (E) Quantification of immunoblots shown in (D). Average and individual values for puromycin signal are shown for two replicate experiments. n.s., not significant, *P < 0.05, **P < 0.01, student’s t-test. (F-G) Proposed model illustrating heat shock-induced ubiquitination associated with (F) mRNP remodeling and (G) stress granule formation and shutdown of cellular activities, and the requirement for active ubiquitination for reversal of these processes during recovery.

Comment in

References

    1. Harding HP et al., An integrated stress response regulates amino acid metabolism and resistance to oxidative stress. Mol Cell 11, 619–633 (2003). - PubMed
    1. Pakos-Zebrucka K et al., The integrated stress response. EMBO Rep 17, 1374–1395 (2016). - PMC - PubMed
    1. Brostrom CO, Prostko CR, Kaufman RJ, Brostrom MA, Inhibition of translational initiation by activators of the glucose-regulated stress protein and heat shock protein stress response systems. Role of the interferon-inducible double-stranded RNA-activated eukaryotic initiation factor 2alpha kinase. J Biol Chem 271, 24995–25002 (1996). - PubMed
    1. Dever TE et al., Phosphorylation of initiation factor 2 alpha by protein kinase GCN2 mediates gene-specific translational control of GCN4 in yeast. Cell 68, 585–596 (1992). - PubMed
    1. Ron D, Translational control in the endoplasmic reticulum stress response. J Clin Invest 110, 1383–1388 (2002). - PMC - PubMed

Publication types

MeSH terms