. 2021 Nov 11;184(23):5775-5790.e30.
doi: 10.1016/j.cell.2021.10.014. Epub 2021 Nov 4.

RNA promotes the formation of spatial compartments in the nucleus

Affiliations

RNA promotes the formation of spatial compartments in the nucleus

Sofia A Quinodoz et al. Cell. .

Abstract

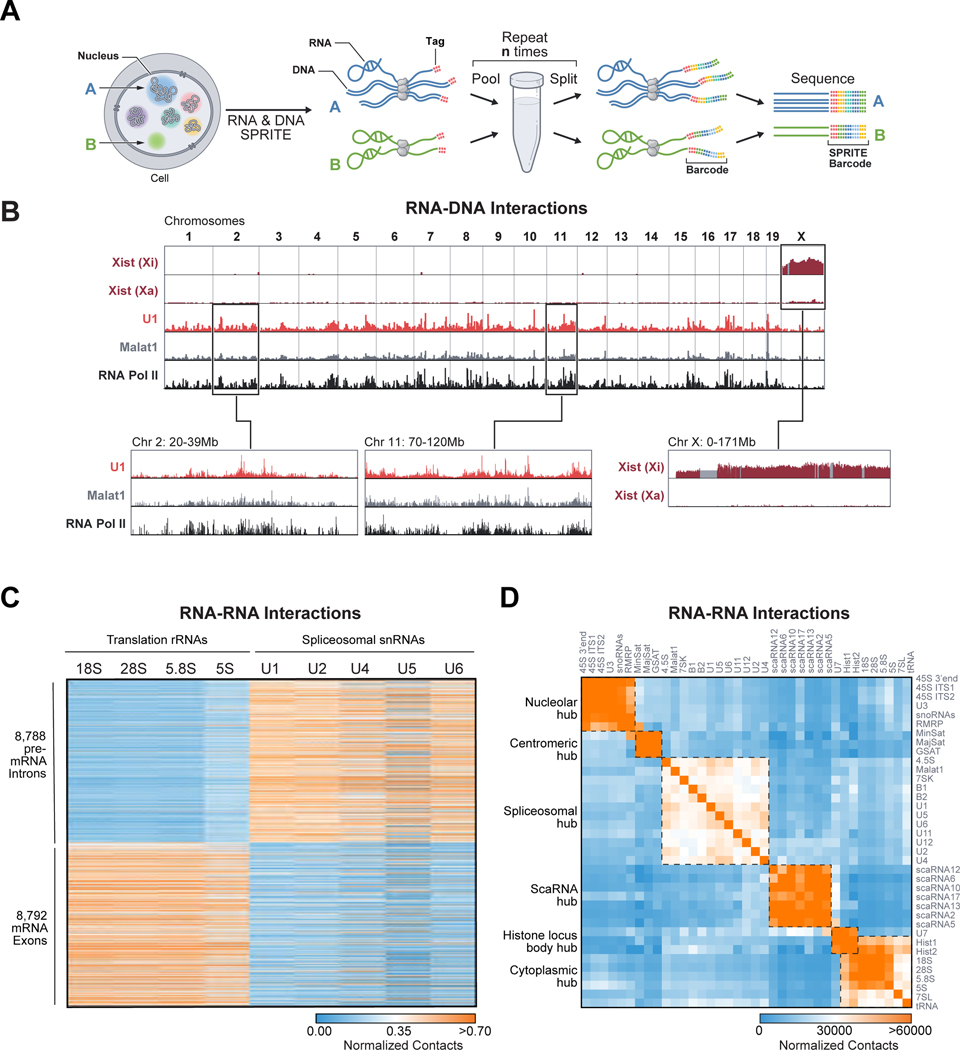
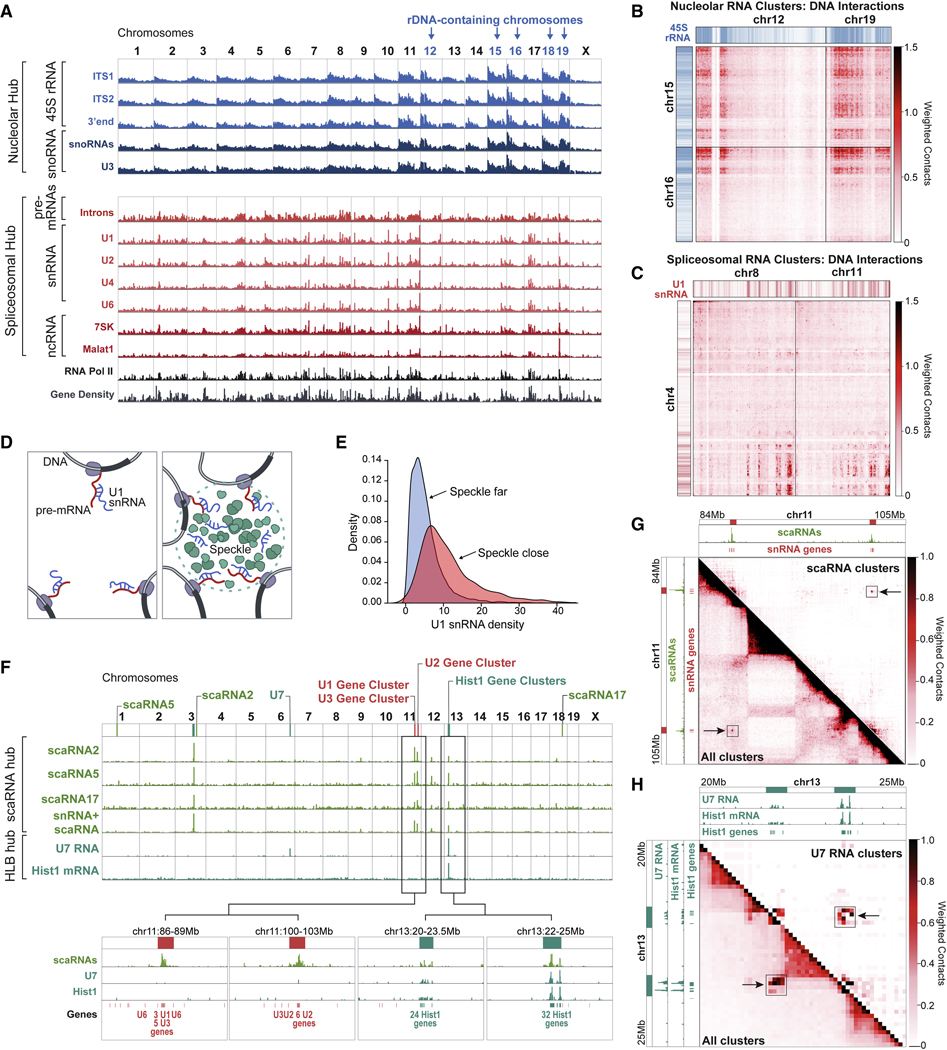
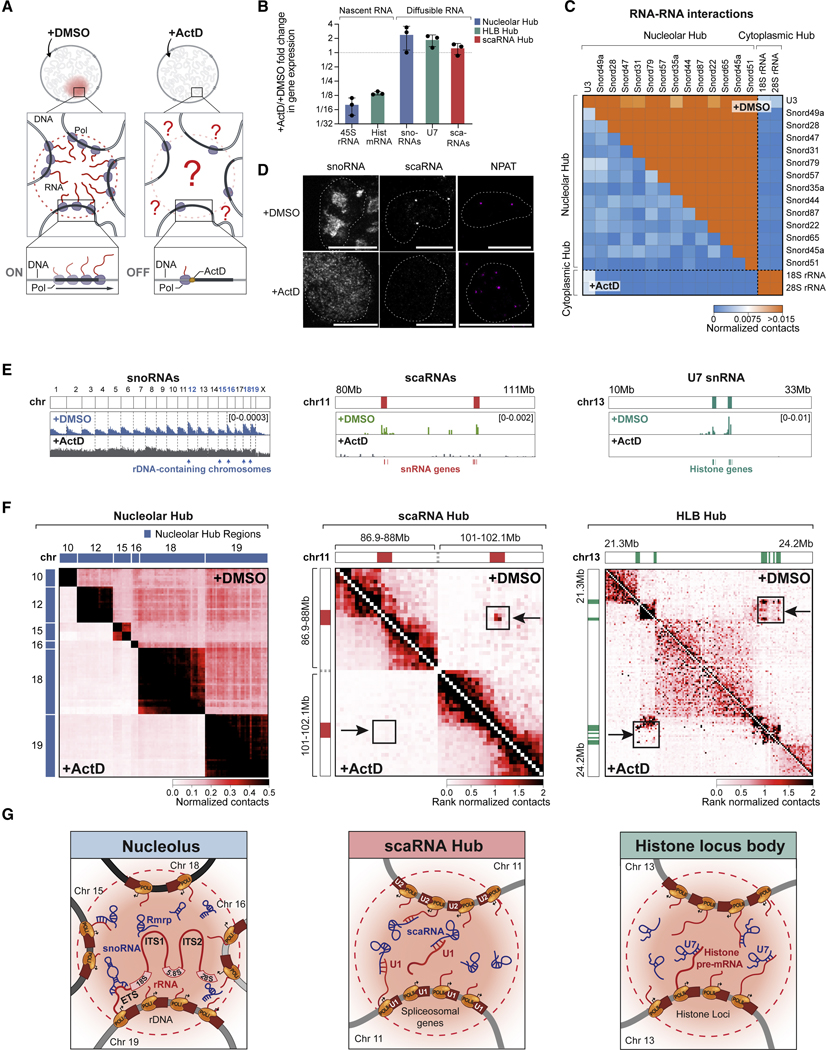
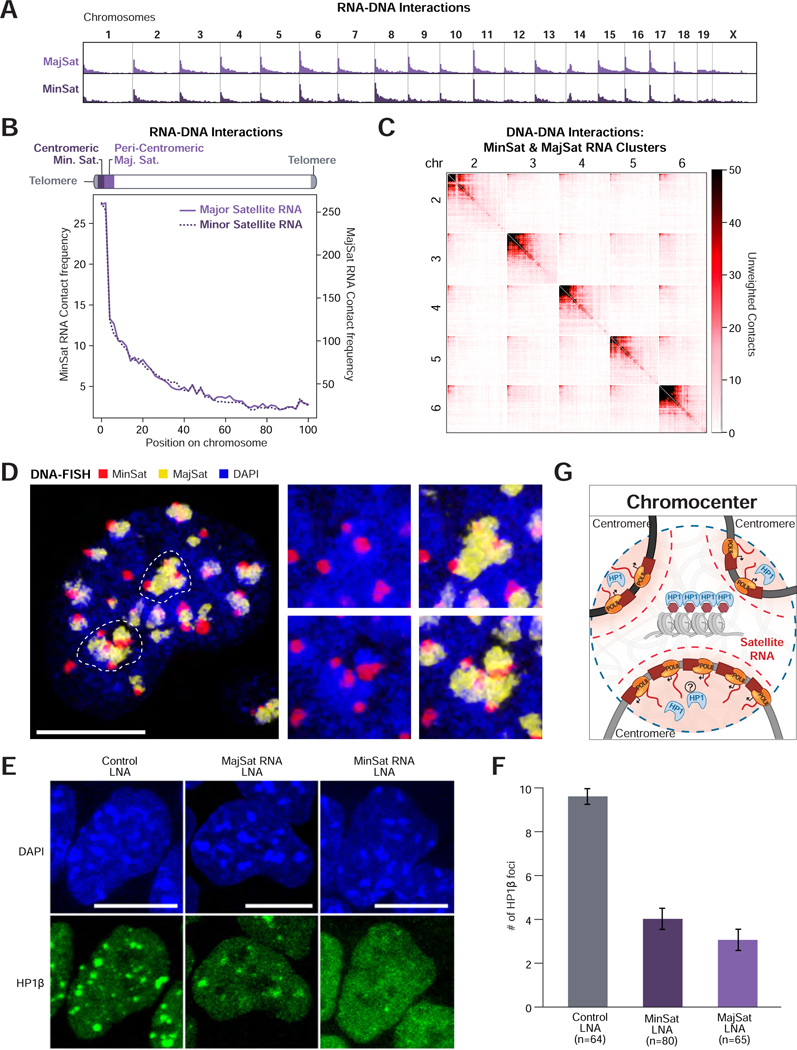
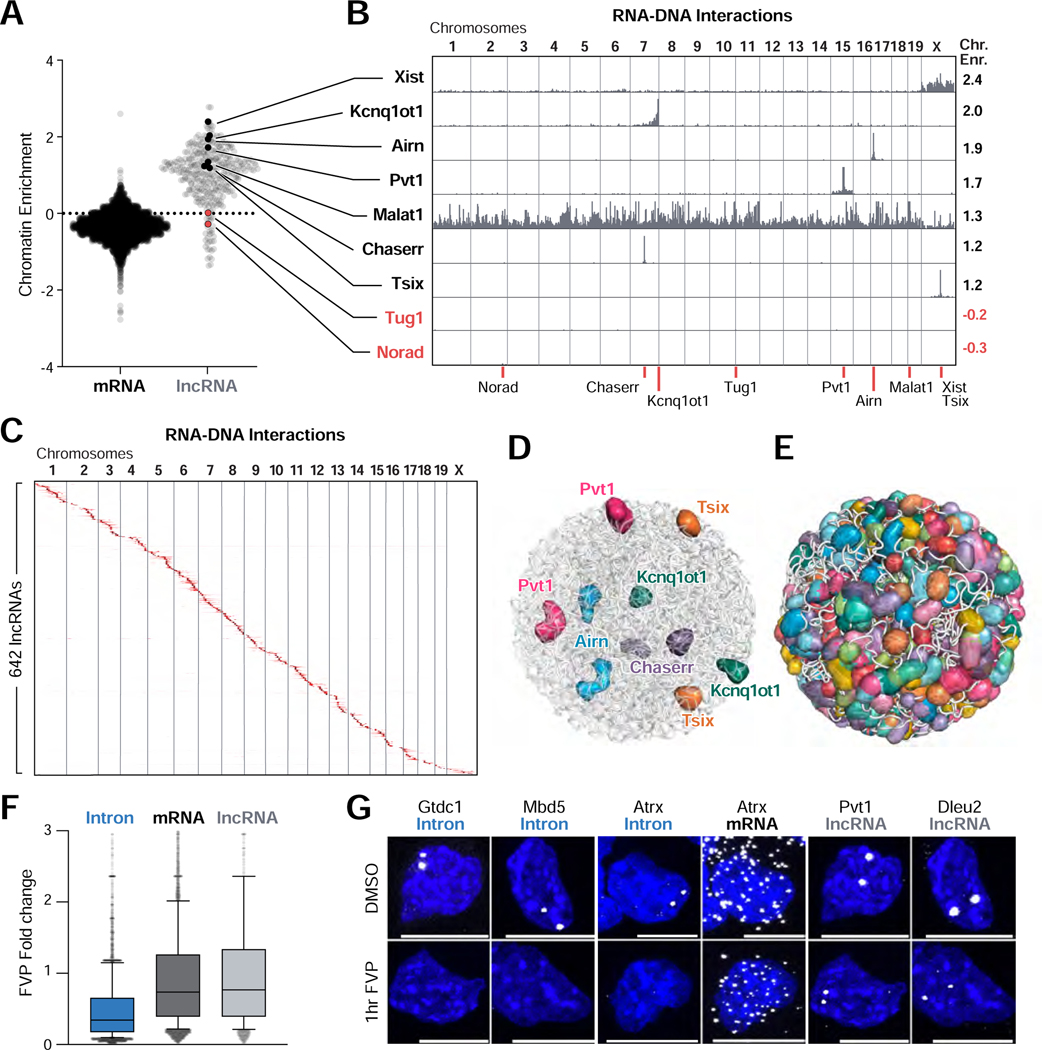
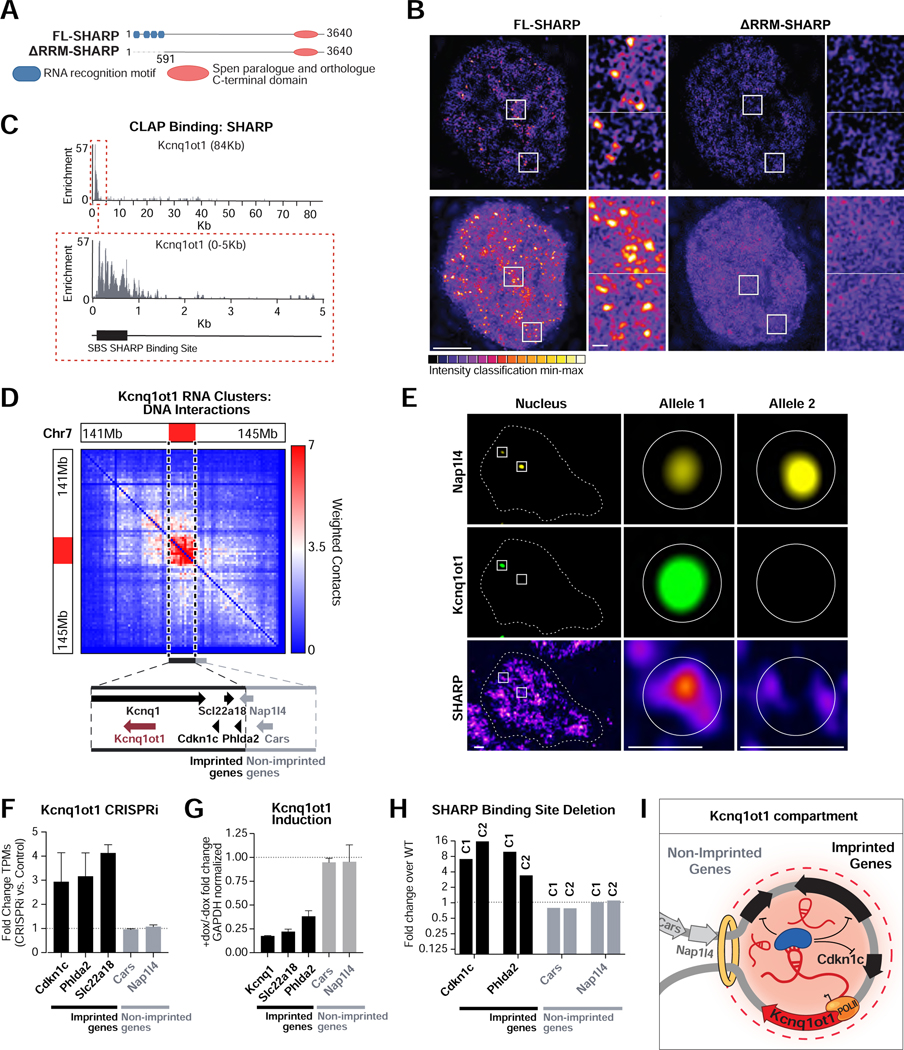
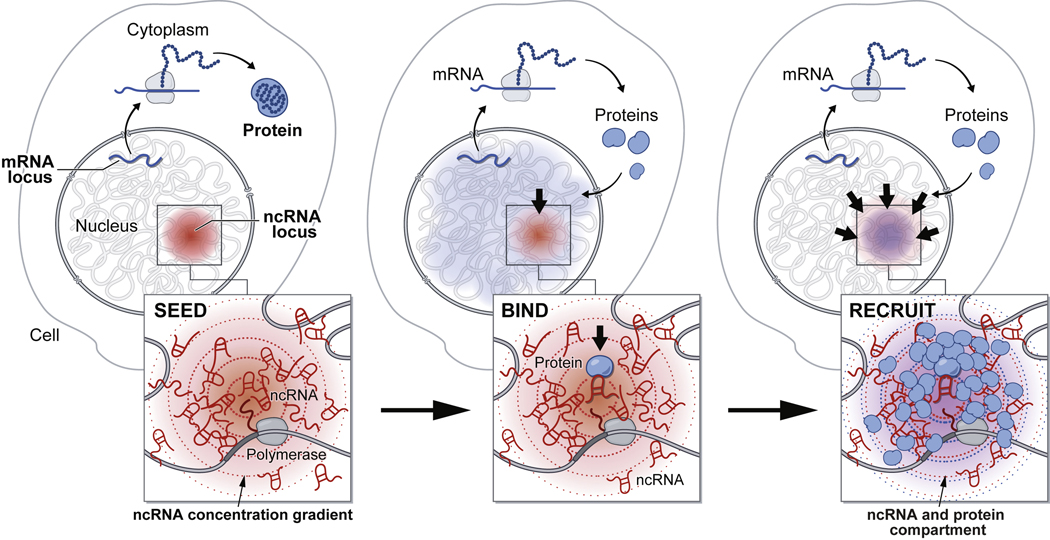
RNA, DNA, and protein molecules are highly organized within three-dimensional (3D) structures in the nucleus. Although RNA has been proposed to play a role in nuclear organization, exploring this has been challenging because existing methods cannot measure higher-order RNA and DNA contacts within 3D structures. To address this, we developed RNA & DNA SPRITE (RD-SPRITE) to comprehensively map the spatial organization of RNA and DNA. These maps reveal higher-order RNA-chromatin structures associated with three major classes of nuclear function: RNA processing, heterochromatin assembly, and gene regulation. These data demonstrate that hundreds of ncRNAs form high-concentration territories throughout the nucleus, that specific RNAs are required to recruit various regulators into these territories, and that these RNAs can shape long-range DNA contacts, heterochromatin assembly, and gene expression. These results demonstrate a mechanism where RNAs form high-concentration territories, bind to diffusible regulators, and guide them into compartments to regulate essential nuclear functions.

Keywords: RNA processing; cajal bodies; chromocenters; histone locus bodies; lncRNAs; ncRNAs; nuclear bodies; nuclear structure.


Conflict of interest statement

Declaration of interests S.A.Q. and M.G. are inventors on a patent covering the SPRITE method.

Figures

Figure 1:
Figure 1:. RD-SPRITE generates maps of higher-order RNA and DNA contacts.
(A) Schematic of RD-SPRITE: Crosslinked cells are fragmented, DNA and RNA are barcoded through multiple rounds of split-and-pool barcoding, and SPRITE clusters defined as a group of molecules sharing a barcode. (B) Xist unweighted contacts on the inactive (Xi) or active X chromosome (Xa), U1 and Malat1 weighted contacts, and RNA Pol II (ENCODE) across the genome. Gray demarcates masked regions. (C) Heatmap showing unweighted RNA-RNA contacts between translation-associated RNAs or splicing RNAs (columns) and introns or exons of mRNAs (rows). (D) Heatmap of unweighted RNA-RNA contact frequencies for several classes of RNA. Boxes denote hubs. See also Figure S1 and Table S1.
Figure 2:
Figure 2:. Non-coding RNAs involved in RNA processing organize within hubs.
(A) Weighted RNA-DNA contacts (1Mb resolution) for several RNAs within the nucleolar and spliceosomal hubs are plotted alongside Pol II occupancy (ENCODE) and gene density. Chromosomes with rDNA are shown in blue. (B) Weighted DNA-DNA contacts in SPRITE clusters containing nucleolar hub RNAs are shown between chromosomes 12+19 and 15+16. Blue/white color bar represents high and low 45S RNA-DNA contacts. (C) Weighted DNA-DNA contacts in SPRITE clusters containing spliceosomal hub RNAs are shown between chromosomes 4 and 8+11. Red/white color bar represents U1 RNA-DNA contacts. (D) Illustration of two possible snRNA localization models: (left) localization occurs primarily through association with nascent pre-mRNAs; (right) localization depends on 3D position of an individual gene. (E) U1 snRNA density over genomic DNA regions with comparable expression levels that are close (red) or far (blue) from nuclear speckles. (F) Weighted RNA-DNA contacts for clusters containing various scaRNAs or scaRNAs and snRNAs (green) or U7 and histone pre-mRNAs (teal). (G) Weighted DNA-DNA contacts across a genomic region containing snRNA genes for all (bottom) or scaRNA-containing (top) SPRITE clusters. scaRNA RNA-DNA contacts are shown along the top and side axes and enriched loci highlighted by black box and arrow. (H) Weighted DNA-DNA contacts in a genomic region containing histone genes for all (bottom) or U7-containing (top) SPRITE clusters. U7 and histone pre-mRNA RNA-DNA contacts are shown along the top and side axis and enriched loci marked with black box and arrow. See also Figure S2.
Figure 3:
Figure 3:. Inhibition of nascent RNA transcription disrupts RNA processing hubs.
(A) Schematic of transcriptional inhibition of Pol I and Pol II in cells treated with Actinomycin D (+ActD) or control (+DMSO). (B) Gene expression changes of RNAs of interest following ActD treatment. Error bars represent standard deviation of 3 replicate experiments. (C) RNA-RNA contact frequency of snoRNAs and rRNAs following ActD (bottom) or DMSO (top) treatment. (D) Imaging of snoRNA, scaRNA, or NPAT protein upon ActD or DMSO treatment. Scalebar is 10μm. (E) RNA-DNA contacts upon DMSO (top) or ActD (bottom) treatment for aggregated snoRNAs (left, cluster size 1001–10000), scaRNAs (middle, weighted), and U7 (right, weighted). (F) DNA-DNA contact matrices upon ActD (bottom) or DMSO (top) treatment. (Left) Nucleolar-hub associated genomic regions (previously described in (Quinodoz et al., 2018)). (Middle) Two regions on chromosome 11 containing snRNA clusters. (Right) Region on chromosome 13 containing histone gene clusters. (Middle, Right) Rank normalized contacts are defined by rescaling contact frequency based on their rank-order to enable comparison between samples. (G) Model of how nascent transcription of RNA organizes diffusible ncRNAs and genomic DNA to form each hub. See also Figure S3.
Figure 4:
Figure 4:. Satellite-derived ncRNAs organize HP1 at inter-chromosomal hubs.
(A) Unweighted RNA-DNA contact frequencies of major and minor satellite-derived ncRNAs across the genome or (B) aggregated across all chromosomes. (C) Unweighted DNA-DNA contacts for chromosomes 2 – 6 within clusters containing a satellite-derived RNA. (D) DNA FISH of major (yellow) and minor (red) satellite DNA in the nucleus (DAPI, blue). Dashed lines demarcate the two DAPI-dense structures shown as zoom-ins on the right. Scalebar is 10μm. (E) HP1β IF following LNA-mediated knockdown of major (MajSat) and minor (MinSat) satellite-derived RNAs. Scalebar is 10μm. (F) Quantification of the mean number of HP1β foci per cell following LNA knockdown. n=number of cells analyzed, error bars represent standard error. (G) Schematic of Chromocenter Hub. Satellite RNAs are spatially concentrated (red gradient) near centromeric DNA. Individual centromeres assemble into a heterochromatic chromocenter structure highly enriched with HP1 protein. See also Figure S4.
Figure 5:
Figure 5:. Most lncRNAs localize at genomic targets in 3D proximity to their transcriptional loci.
(A) Chromatin enrichment score for mRNAs and lncRNAs. Values > and < 0 represent RNAs enriched and depleted on chromatin, respectively. (B) Unweighted RNA-DNA localization maps for selected chromatin-enriched (black) and chromatin-depleted (red) lncRNAs. Chromatin enrichment scores (Chr. Enr.) are listed (right). Red lines (bottom) indicate transcriptional locus for each RNA. (C) Unweighted RNA-DNA localization map of 642 lncRNAs ordered by genomic position of their transcriptional loci. (D) 3D space filling nuclear structure model of the selected lncRNAs or (E) 543 lncRNAs that display at least 50-fold enrichment in the nucleus. Each sphere corresponds to a 1 Mb region or larger where an individual lncRNA is enriched. (F) Change in RNA levels between untreated and flavopiridol (FVP)-treated mouse ES cells (Jonkers et al., 2014) for introns, mRNAs, and lncRNAs. Plot: line represents median, box extends from 25th to 75th percentiles, and whiskers from 10th to 90th percentiles. (G) RNA FISH for selected introns, mRNA exons, and lncRNAs following FVP (bottom) or DMSO (top) treatment for 1 hour. Scalebar is 10μm. See also Figure S5.
Figure 6:
Figure 6:. SHARP is enriched within dozens of RNA-mediated compartments in the nucleus and can regulate gene expression within specific compartments.
(A) Full length (FL) SHARP (also referred to as Spen) contains four RNA recognition motif (RRM, blue) domains and one Spen paralogue and orthologue C-terminal (SPOC, orange) domain. SHARP lacking its RNA binding motifs (ΔRRM) was generated by deleting the first 591 amino acids. (B) 3D-SIM intensity of Halo-tagged FL-SHARP (left) and ΔRRM-SHARP (right). Shown are 125nm optical sections (top) and z-projections (bottom). FL-SHARP localizes in foci throughout the nucleus (zoom in panels 1–2), while ΔRRM-SHARP localization is more diffuse. Bar: 5μm, insets: 0.5μm. (C) SHARP binding profile to Kcnq1ot1 including its SHARP-binding site (SBS, black box). (D) Weighted DNA-DNA contacts within clusters containing Kcnq1ot1 RNA. Dashed line indicates the location of the Kcnq1ot1-enriched territory. (Zoom box) Genomic locations of the Kcnq1ot1 gene (burgundy), the imprinted Kcnq1, Slc22a18, Cdkn1c, and Phlda2 (black) and non-imprinted Nap1l4 and Cars (gray) genes. (E) RNA FISH combined with IF of Nap1l4 RNA, Kcnq1ot1 RNA and SHARP. Maximum intensity z-projections (left) are shown alongside individual z-section slices of the actively transcribed Kcnq1ot1 allele (center) and the inactive Kcnq1ot1 allele (right). Scale bars are 1μm (left) and 0.5μm (center, right). (F) Changes in gene expression upon CRISPR inhibition (CRISPRi) of Kcnq1ot1. Error bars represent standard deviation between two biological replicates. (G) Changes in gene expression with or without induction of Kcnq1ot1 (+dox/-dox). Error bars represent standard deviation. (H) Comparison of gene expression between two clonal lines lacking the SHARP-binding site (SBS) to wild-type cells. (I) Model of how Kcnq1ot1 seeds the formation of an RNA-mediated compartment in spatial proximity to its transcriptional locus. After transcription, Kcnq1ot1 binds and recruits the SHARP protein into this compartment to silence imprinted target genes. See also Figure S6 and Supplemental Videos 1–3.
Figure 7:
Figure 7:. A model for the mechanism by which ncRNAs drive the formation of nuclear compartments.
Once transcribed, mRNAs are exported to the cytoplasm while ncRNAs are retained in the nucleus. ncRNA transcription creates a transcript concentration gradient, highest near its transcriptional locus (SEED, left panel). Because ncRNAs can bind with high affinity to diffusible RNAs and proteins immediately upon transcription (BIND, middle panel), they can concentrate other RNAs and proteins in a spatial compartment (RECRUIT, right panel). In this way, ncRNAs can drive the organization of nuclear compartments. See also Figure S7.

Comment in

References

    1. Banani SF, Lee HO, Hyman AA, and Rosen MK (2017). Biomolecular condensates: Organizers of cellular biochemistry. Nat. Rev. Mol. Cell Biol - PMC - PubMed
    1. Barutcu AR, Blencowe BJ, and Rinn JL (2019). Differential contribution of steady-state RNA and active transcription in chromatin organization . EMBO Rep. - PMC - PubMed
    1. Baßler J, and Hurt E. (2019). Eukaryotic Ribosome Assembly. Annu. Rev. Biochem - PubMed
    1. Bell JC, Jukam D, Teran NA, Risca VI, Smith OK, Johnson WL, Skotheim JM, Greenleaf WJ, and Straight AF (2018). Chromatin-associated RNA sequencing (ChAR-seq) maps genome-wide RNA-to-DNA contacts. Elife. - PMC - PubMed
    1. Bensaude O. (2011). Inhibiting eukaryotic transcription: Which compound to choose? How to evaluate its activity? Transcription 2, 103–108. - PMC - PubMed

Publication types

MeSH terms