. 2021 Dec 13;39(12):1623-1642.e20.
doi: 10.1016/j.ccell.2021.10.008. Epub 2021 Nov 4.

Myeloid antigen-presenting cell niches sustain antitumor T cells and license PD-1 blockade via CD28 costimulation

Affiliations

Myeloid antigen-presenting cell niches sustain antitumor T cells and license PD-1 blockade via CD28 costimulation

Jaikumar Duraiswamy et al. Cancer Cell. .

Abstract

The mechanisms regulating exhaustion of tumor-infiltrating lymphocytes (TIL) and responsiveness to PD-1 blockade remain partly unknown. In human ovarian cancer, we show that tumor-specific CD8+ TIL accumulate in tumor islets, where they engage antigen and upregulate PD-1, which restrains their functions. Intraepithelial PD-1+CD8+ TIL can be, however, polyfunctional. PD-1+ TIL indeed exhibit a continuum of exhaustion states, with variable levels of CD28 costimulation, which is provided by antigen-presenting cells (APC) in intraepithelial tumor myeloid niches. CD28 costimulation is associated with improved effector fitness of exhausted CD8+ TIL and is required for their activation upon PD-1 blockade, which also requires tumor myeloid APC. Exhausted TIL lacking proper CD28 costimulation in situ fail to respond to PD-1 blockade, and their response may be rescued by local CTLA-4 blockade and tumor APC stimulation via CD40L.

Keywords: CD28; CD40; CTLA-4; PD-1; TIL; dendritic cell; exhaustion; myeloid niche; ovarian; tumor.


Conflict of interest statement

Declaration of interests G.C. has received grants from Celgene, Boehringer-Ingelheim, BMS, and Tigen, and participated in advisory board or presented at Roche, MSD Merck, BMS, AstraZeneca, and Geneos Tx-sponsored symposia (fees received by G.C.’s institution). G.C. has patents in the domain of antibodies, vaccines, T cell expansion, and engineering technologies, and receives royalties from UPenn. P.K.S. is a member of the SAB or Board of Directors of Applied Biomath, Glencoe Software, RareCyte Inc., and has equities in these companies; he is a member of the SAB of NanoString Inc. and a consultant for Merck and Montai Health. P.K.S. has received research funding from Novartis and Merck. D.J.P. receives research funding from Incyte and serves as an adviser, receives fees, stock options, and research funding from InsTIL Bio. R.G. holds a patent for TCR sequencing. J.D. is presently a US FDA employee. R.T., C.N., V.A., and M.A.D. are current employees of Ichnos Sciences Biotherapeutics SA. None of the above declared relationships has influenced the content of this manuscript. The other authors declare no competing financial interests.

Figures
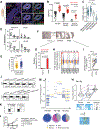
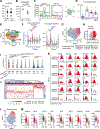
Figure 1:
Figure 1:. Ovarian intraepithelial TIL are activated and exhibit markers of TCR engagement in situ
(A and B) Representative images (A) and frequency (B) of CD8+ TIL expressing nuclear (n)NFATc2 or cytoplasmic GzmB in HGSOC. (C) GZMB expression in four HGSOC molecular subtypes presented as box (median, first and third quartiles) and whisker (extreme value), ANOVA followed by post-hoc Tukey test. (D) Fluorescence-activated cell sorting (FACS) analysis of activation markers in CD8+ TIL, tumor-associated lymphocytes (TALs) from ascites, and peripheral blood lymphocytes (PBL) from HGSOC patients. (E) Frequency of CD8+GzmB+ cells in stroma and islets of HGSOC (10 or more randomly selected regions, 10 to 20% of the tumor section). (F-I) Laser-capture microdissection (F) and analysis of IFNG expression in stroma and islets (G). (H) Relative expansion of individual T-cell receptors (TCRs) identified in microdissected stroma or islets by TCRβ sequencing. A frequency > 5-fold relative to the median is considered oligoclonal expansion (red box). See Figure S1H for details. (I) Summary of TCR clonal expansion per tumor compartment (dots show total number of oligoclonal TCRs; lines connect matched stroma and islet from the same tumor; two-tailed Wilcoxon test). (J) Tetramer stain of CD8+ and CD4+ TIL from HGSOC. (K) Intracellular IFNγ and IL-2 in CD8+ TIL in ovarian tumor-digest cultures. (L) Sorted NY-ESO-1−specific TIL kill autologous tumor (chromium release assay). (M) Individual (bar) and cumulative (pie) frequencies of the top 50 clonotypes, with their localization indicated by color, in TAA-specific TIL from islet-stroma pairs in three different patients. The dominant clonotype (top bar) for each patient is shown by an arc surrounding the pie charts. (N) Violin plot of all clonotypes of patient P#1789 from panel M matched (lines) with the top 50 TCRs from TAA-specific cells sorted by multimer from the same tumor. Internal lines indicate median, first and third quartiles. Statistical tests: mean±SD, t-test or as indicated. See also Figure S1 and Table S1.
Figure 2:
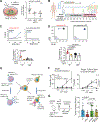
Figure 2:. Tumor-reactive TIL upregulate PD-1, whose blockade reinvigorates their function in situ
(A and B) Representative image (A) and Venn diagram with average frequency (B) of intraepithelial (ie)CD8+TIL expressing PD-1, GzmB, and/or nuclear NFATc2 in tumors. (C and D) Representative marker expression (C) and Ki-67+ frequency (D) in PD-1+ and PD-1 CD8+ TIL (FACS). (E) The density of polyfunctional ieCD8+PD-1+GzmB+ TIL in situ is associated with the detection of tumor-reactive TIL ex vivo (Chi-square, p<0.01). (F) PD-1 expression in CD8+ and CD4+ TIL specific to tumor associated antigens (FACS). Top: HLA-A2 restricted epitopes, bottom: class II restricted epitopes. (G) Frequency of proliferating (CFSE dilution, FACS) TIL upon ex vivo exposure to cognate TAAs. (H-K) Response of TIL to cognate TAA peptides ± αPD-1 in tumor-digest cultures: (H) Baseline (end of culture) frequency of IL-2+ and IFNγ+CD8+ TIL (peptide: NY-ESO-1). (I) Fold expansion of HER2/neu or NY-ESO-1 specific TIL in response to peptide (tetramer staining). (J) TIL proliferation (CFSE dilution) of total CD8+ (left) and tetramer+ (right) cells. (K) Frequency comparison of individual tetramer-positive clonotypes (from J, >5-fold, orange; >10-fold, red) after ex vivo exposure to NY-ESO-1 and αPD-1. Boxes represent median, first and third quartiles and whiskers show quartile ± 1.5*interquartile range. (H-J: FACS analysis). L) Experimental design (top) and Kaplan-Meier survival (bottom) of NSG mice bearing patient-derived xenograft (PDX) tumors and treated with ACT of multimer-sorted NY-ESO1–1 specific TIL following exposure ex vivo to αPD-1 (red) or not (black) or bulk unselected TIL (gray). Statistical tests: mean±SD, t-test or as indicated. See also Figure S2–S3.
Figure 3:
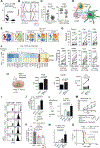
Figure 3:. PD-1+ CD8+ TIL associated with intraepithelial myeloid antigen-presenting niches are polyfunctional
(A-D) Clusters of PD-1+CD8+ TIL with PD-L1+CD11c+ dendritic cells (DCs): (A) representative mIF image (see Figure S4 for details) and (B) cumulative density of clusters in tumor islets vs. stroma (mean±SD, t-test). (C) Proportion of polyfunctional (PD-1+nNFATc2+GzmB+) TIL and (D) progression-free survival (Kaplan-Meier) in tumors that have high number of iePD-1+CD8+ TIL and high number of PD-L1+CD11c+ DCs cells per mm (high/high) vs. all the other tumors (non-high/high). The groups were split by median, n=59. (E-J) tCyCIF imaging analyzing CD8+ TIL proximity to myeloid antigen-presenting cells (mAPCs) and to tumor cells (T) in 15 HGSOC: schematic view (E) and representative high-resolution images (F) of TIL with CD11c+ mAPC neighbors (top) and neighbor-less TIL (bottom). Quantification of ieCD8+ TIL and CD11c+ mAPC neighborhoods per patient (G) and cumulative diagram for all mAPCs (H). (I) Scatter plot display of a tCyCIF measured expression of PD-1, Ki-67, pSTAT1 and CD45RO in CD8+ TIL in a representative sample. (J) Significant fold change (FC, p < 0.05) of average polyfunctional score in ieCD8+ cells with any mAPC neighbor relative to neighbor-less ieCD8+ cells. See also Figure S3–S5.
Figure 4:
Figure 4:. Identification of CD28-costimulated PD-1+CD8+ TIL
(A and B) Frequency (A) and expression levels (B; mean fluorescent intensity) of CD28 in CD8+PD-1+ or PD-1 patient cells (FACS, t-test). (C) CD28 expression in CD8+CD137+ or CD137 TIL (mass cytometry, mean metal intensity). (D) Frequency of HLA-DR+CD11c+ tumor-derived DCs expressing CD80, CD86, PD-L1, or double CD86/PD-L1 (FACS, mean±SD, t-test). (E-M) scRNAseq of CD8+ TIL from 17 ovarian tumor-digest cultures: (E) unsupervised clustering; (F) CD28-costimulation (CD28cost, left) and exhaustion (Tex, right) scores per cluster from E (Wilcoxon test, p < 2.22×10⁻¹⁶); (G) distribution and (H) Pearson correlation of the Tex and CD28cost states. The first word in the legend refers to Tex, the second to CD28cost. (I) Enrichment of clonally expanded cells in the TexCD28cost states (Wilcoxon test, p ≤ 0.0016). For each clonotype, the number of occurrences of the given TCR in the sample was calculated and plotted at the log10 scale. (J) Distribution of ceTIL (≥10 cells/TCR, n=208 total clones) across states. Colors from red to blue represent 9 Tex/CD28cost states as in G and H. (K) Select differentially expressed genes between high/high and high/low Tex/CD28cost states in clonally expanded cells (≥10 cells/TCR). (L) Distribution of Tex/CD28cost states in a regulon map. Colors from red to blue represent 9 Tex/CD28cost states. (M) Comparison of regulon activity between high/high and high/low TexCD28cost states (h/h - TexhiCD28costhi; h/l - TexhiCD28costlow). See also Figure S5; boxplots defined as box (median, first and third quartiles) and whisker (extreme value).
Figure 5:
Figure 5:. mAPCs and CD28 are required for effective TIL activation upon PD-1 blockade
(A) Proliferation (CFSE dilution) of CD8+ TIL in response to TAA peptides and αPD-1 (fold increase relative to isotype control antibody) in tumor digest cocultures, at baseline (i.e. APC present, +APC), with addition of CD28 antagonist p2TA, or following myeloid APC depletion (−APC). (B) Enrichment of a combined T-cell/myeloid APC gene signature in patients responding to αPD-1 in clinical studies (merged cohort of various cancer types; see Figure S6C for details). (C and D) Representative (top) and cumulative data (bottom) of kinetics of ERK phosphorylation (C) and cell proliferation (CFSE dilution, D) detected in CD8+ TIL after PD-1 blockade, in responder (n=6) and non-responder (n=16) tumor-digest cultures (FACS). (E and F) Experimental scheme (E) and cell lysis (51Cr assay, F) of OVCAR5 cells engineered (or not) to express ectopic CD80/CD86 and PD-L1 by NY-ESO-1157–165 specific CD8+ TIL clone. TIL were either rested cytolytic cells (CTL), exhausted (exhCTL), or exhausted and supplemented by αPD-1. (G) Scheme of the experiment (left) and best response (right) of Tp53−/−Brca1−/− ID8 tumors to αPD-1 and/or αCD28 treatment in vivo. Statistical tests: mean±SD, t-test or as indicated. See also Figure S6.
Figure 6:
Figure 6:. CTLA-4 blockade in situ enhances TIL activation by αPD-1 via CD28
(A and B) Expression of intracellular CTLA-4 in PD-1+ and PD-1 CD8+ TIL (A) and in tumor antigen-specific CD8+ TIL (B, representative histograms). (C) Frequency of CD137+ TIL in CTLA-4+ or CTLA-4 PD-1+CD8+ TIL (left) and of CD28+ TIL in CD137+ or CD137 CTLA-4+PD-1+ CD8+ TIL (mass cytometry). (D) Cross-talk with APCs regulates CD28 costimulation in tumor-reactive TIL embedded in the intraepithelial tumor niche. (E-G) Mass cytometry profiling of TIL from 11 HGSOC: (E) distribution of TIL populations, (F) cumulative expression of markers in CD28+ and CD28 subsets of CD137+CTLA-4+PD-1+ CD8+ TIL, (G) expression of precursor, memory and activation markers in CD28+ and CD28 subsets of PD-1+CTLA-4+ CD8+ TIL. (H-K) TIL activation in tumor-digest cultures in response to tumor antigen peptides and ICB (FACS): (H) Left to right: experiment scheme and levels of T-bet, GzmB, and IFNγ secretion. (I) Representative and (J) cumulative CD8+ TIL proliferation (CFSE dilution) in tumor digest cultures. (K) Abrogation of response to αPD-1/αCTLA-4/TAA peptides in αPD-1 responders: at baseline (i.e. APC present, +APC), with addition of CD28 antagonist p2TA (+APC/+p2TA), or following myeloid APC depletion (−APC). (L-O) Response to αPD-1/αCTLA-4 in HLA-A2+ CD34-reconstituted human immune system/NSG mice (HIS-NSG-A2) bearing OVCAR5 tumors: (L) detection of TIL recognizing HER2 peptide in mice treated with control IgG, αPD-1 and/or αCTLA-4. (M) Cytolytic activity (51Cr assay) of HER2-specific TIL against OVCAR5 cells. TIL were sorted by multimer from responding mice. (N) Detection of HER2-specific IFNγ+CD8+ TIL, and (O) Kaplan-Meier survival curves in mice treated with control IgG, αPD-1 and/or αCTLA-4. Statistical tests: mean±SD, t-test or as indicated. See also Figure S6.
Figure 7:
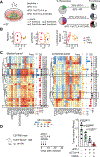
Figure 7:. CD28-costimulated exhausted TIL and proximity to tumor APCs is associated with response to αPD-1 in solid tumors
(A-F) Exhaustion (Tex) and CD28-costimulation (CD28cost) states at baseline of clonally expanded CD8+ TIL in HGSOC tumor digest cultures that exhibited response (or not) to ICB ex vivo. Pearson correlation of Tex and CD28cost states inferred by scRNAseq in specific TIL clonotypes from representative samples (black dots) against a backdrop of all oligoclonal CD8+ TIL (≥10 cells/TCR) analyzed in all samples. (B) Cumulative data per patient for ≥50 cells/TCR (h=high, m=mid, l=low; R to αPD-1: response to at least αPD-1; Other: response to αPD-1/αCTLA-4 but not αPD-1; NR: response to neither. (C) tSNE depiction of unsupervised clusters, all clonotypes with ≥50 cells/TCR; (D) distribution of TexCD28cost states; and (E) ex vivo responses of the same. (F) Differentially expressed genes between clusters 0/5/6 and other clusters. (G) Enrichment of the 5-gene PD-1 response (PD1R) signature at baseline in tumors that did not relapse (n=8) compared to tumors that relapsed (n=5) in an αPD-1 neoadjuvant study in resectable melanoma patients (Huang et al., 2019). (H) PD1R and CD28cost signatures in TCGA data, in cancer types know to respond (R) or not (NR) to αPD-1 therapy. (I) Correlation between average objective response rate (ORR) to αPD-1 or αPD-L1 monotherapy according to published assignments (Yarchoan et al., 2017) and expression levels of PD1R signature in TCGA data. Diameter of the bubble is proportional to tumor mutation burden (TMB). (J) Frequency of CD11+ cells with at least one CD3+ cell neighbor (≤20 μm radius) normalized by the total CD11+ cells in melanoma tumor islets vs. stroma. Statistical tests: t-test or as indicated; boxplots defined as box (median, first and third quartiles) and whisker (extreme value). See also Figure S7 and Table S6.
Figure 8:
Figure 8:. Response to αPD-1 is amplified by CD40 agonist
(A) Left, experiment set-up. Right, response of tumor digest cultures to peptide stimulation plus single or combinational ICB. Response was defined as proliferation plus ≥2 functions. Left pies: fraction of tumors responding to treatment; right pies: number of functions in CD8+ TIL; response is indicated by arcs. (B) OPLS discriminant analysis of myeloid (CD11b+), lymphoid (CD3+) and combined myeloid/lymphoid FACS (14-parameter) panels discriminate non-responding (NR) tumors from those responding to αPD-1 vs. triple αPD-1/αCTLA-4/CD40L. (C) Clustering analysis of myeloid and lymphoid cells. Each row represents a cell subset based on phenotypes identified by MegaClust via unbiased analysis of FACS parameters of all cells. Side bars represent the average relative frequency for each cell subset at baseline in tumor-digest cultures that respond ex vivo to triple αPD-1/αCTLA-4/CD40L (T=yellow) or single αPD-1 treatment (P=blue), and their normalized discriminant score (DS, positive=black; negative=red). (D) Best in vivo response to combinatorial ICB in C57BL/6 mice bearing Tp53−/−Brca1−/− ID8 tumors (mean ± SD, t-test). See also Figure S8 and Table S7.

Comment in

References

    1. Adams SF, Grimm AJ, Chiang CL, Mookerjee A, Flies D, Jean S, McCann GA, Michaux J, Pak H, Huber F, et al. (2020). Rapid tumor vaccine using Toll-like receptor-activated ovarian cancer ascites monocytes. J Immunother Cancer 8. - PMC - PubMed
    1. Aibar S, González-Blas CB, Moerman T, Huynh-Thu VA, Imrichova H, Hulselmans G, Rambow F, Marine JC, Geurts P, Aerts J, et al. (2017). SCENIC: single-cell regulatory network inference and clustering. Nature methods 14, 1083–1086. - PMC - PubMed
    1. Amir el AD, Davis KL, Tadmor MD, Simonds EF, Levine JH, Bendall SC, Shenfeld DK, Krishnaswamy S, Nolan GP, and Pe’er D (2013). viSNE enables visualization of high dimensional single-cell data and reveals phenotypic heterogeneity of leukemia. Nature biotechnology 31, 545–552. - PMC - PubMed
    1. Anderson KG, Voillet V, Bates BM, Chiu EY, Burnett MG, Garcia NM, Oda SK, Morse CB, Stromnes IM, Drescher CW, et al. (2019). Engineered Adoptive T-cell Therapy Prolongs Survival in a Preclinical Model of Advanced-Stage Ovarian Cancer. Cancer immunology research 7, 1412–1425. - PMC - PubMed
    1. Andrews S (2010). FastQC: a quality control tool for high throughput sequence data.

Publication types

MeSH terms