. 2021 Dec 2;81(23):4924-4941.e10.
doi: 10.1016/j.molcel.2021.10.013. Epub 2021 Nov 4.

A multi-omic single-cell landscape of human gynecologic malignancies

Affiliations

A multi-omic single-cell landscape of human gynecologic malignancies

Matthew J Regner et al. Mol Cell. .

Abstract

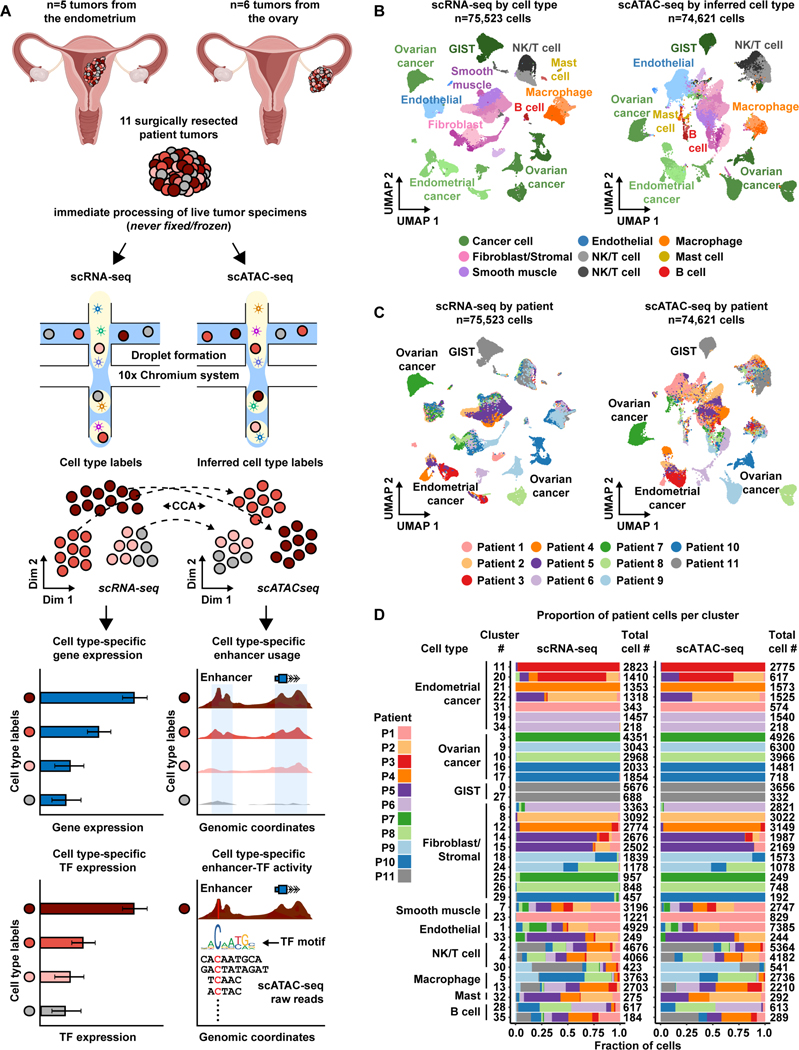
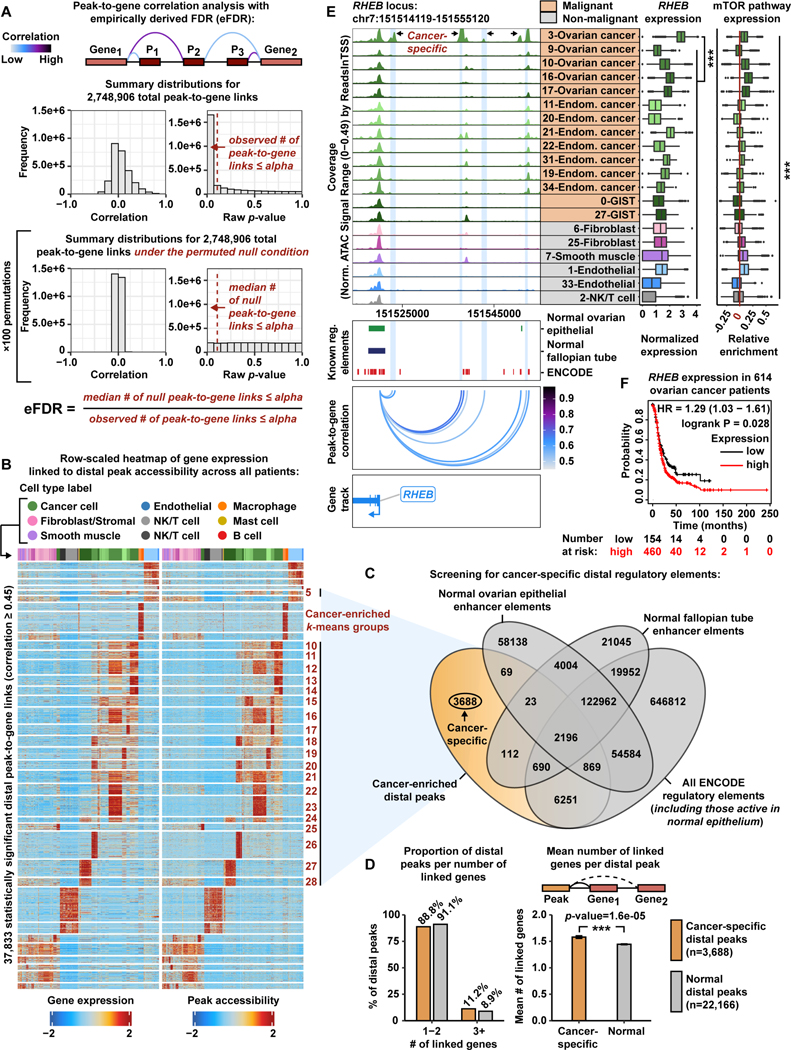
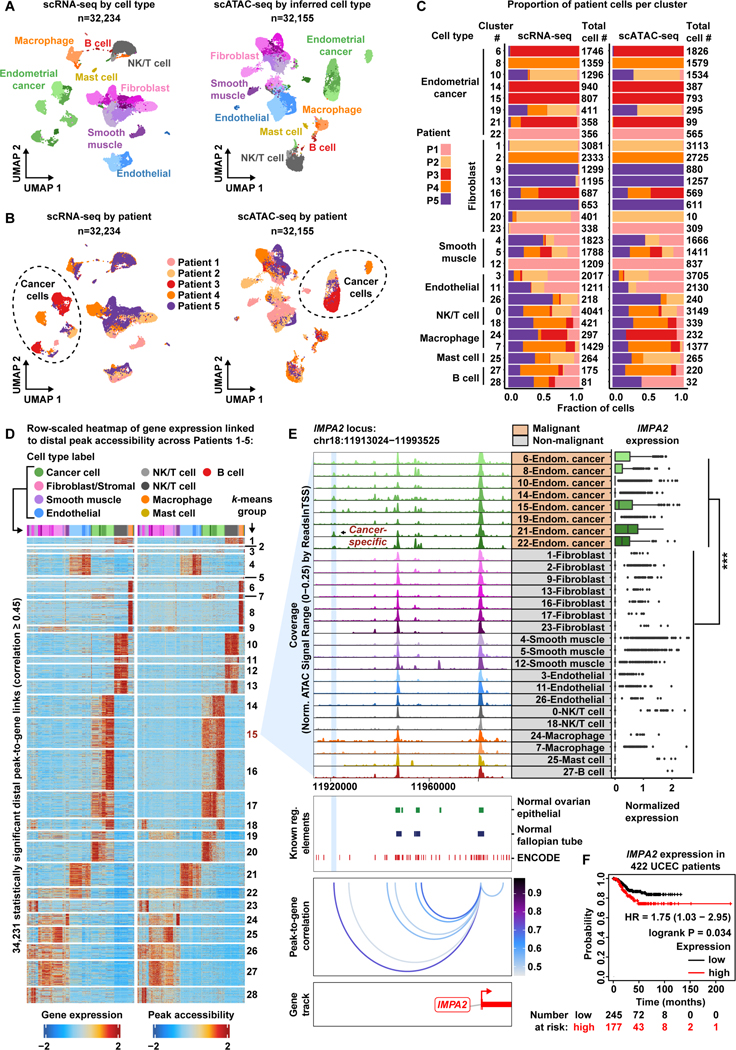
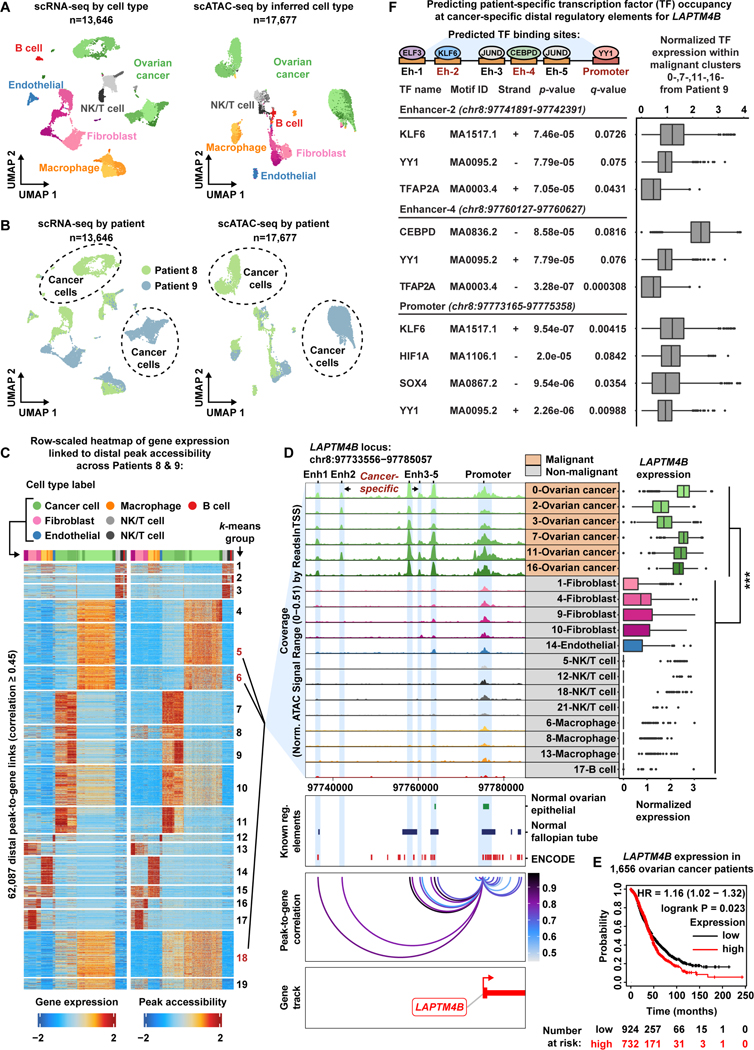
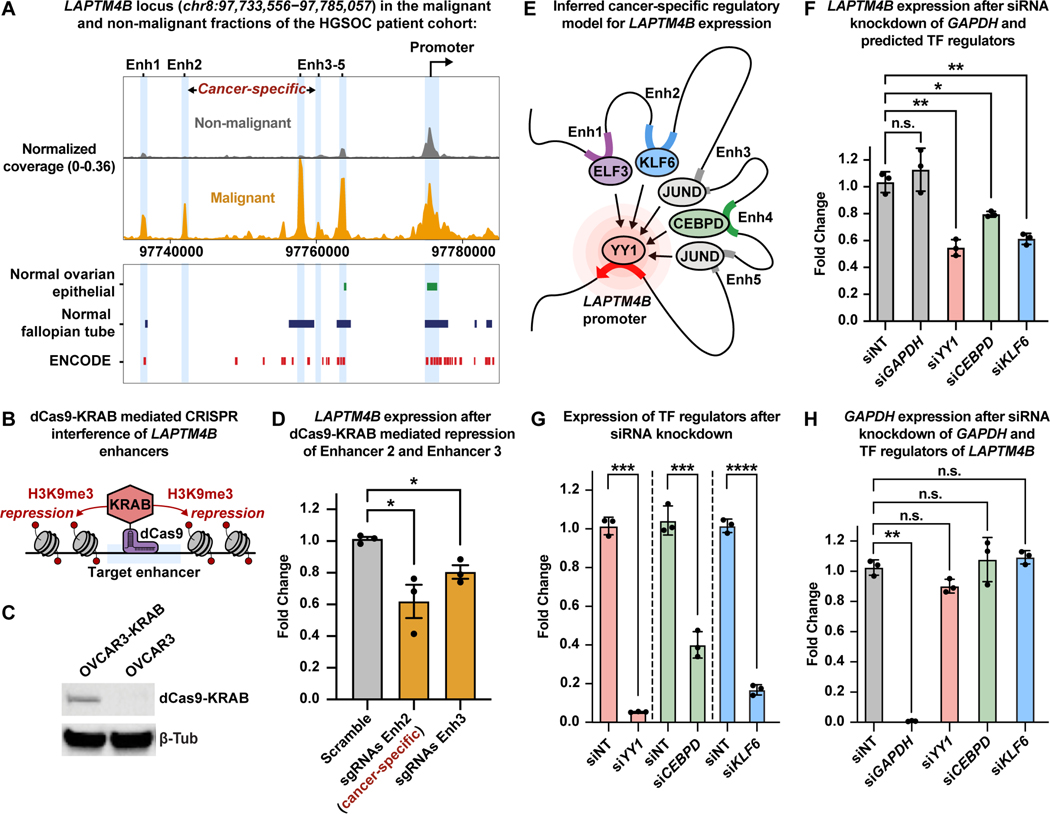
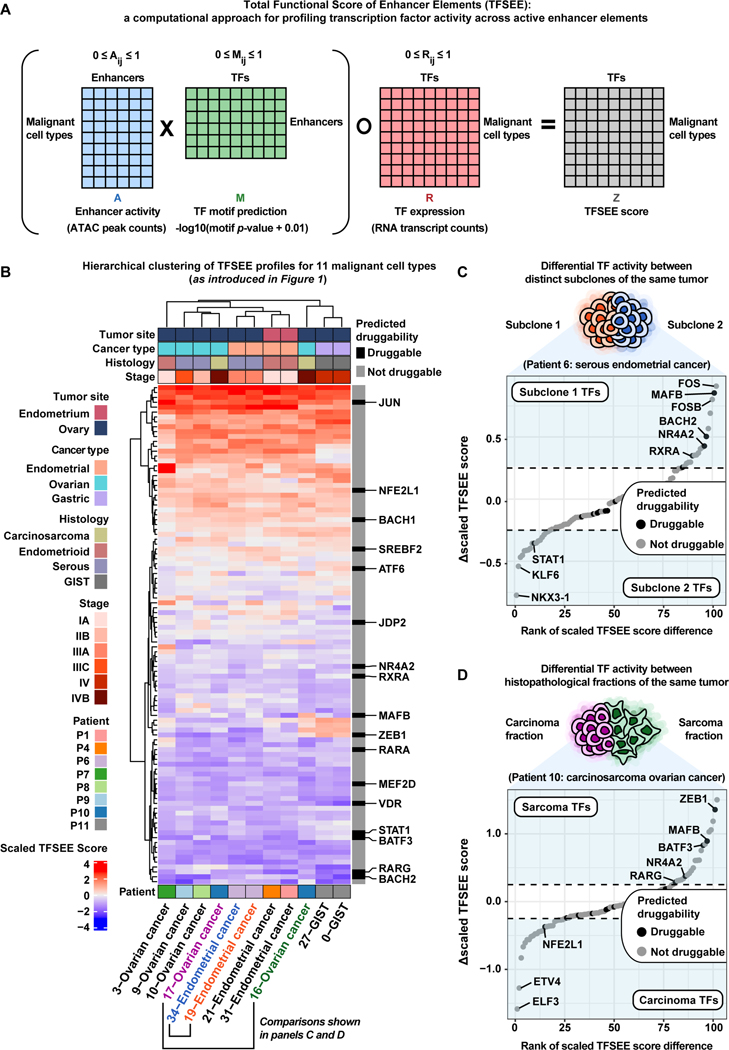
Deconvolution of regulatory mechanisms that drive transcriptional programs in cancer cells is key to understanding tumor biology. Herein, we present matched transcriptome (scRNA-seq) and chromatin accessibility (scATAC-seq) profiles at single-cell resolution from human ovarian and endometrial tumors processed immediately following surgical resection. This dataset reveals the complex cellular heterogeneity of these tumors and enabled us to quantitatively link variation in chromatin accessibility to gene expression. We show that malignant cells acquire previously unannotated regulatory elements to drive hallmark cancer pathways. Moreover, malignant cells from within the same patients show substantial variation in chromatin accessibility linked to transcriptional output, highlighting the importance of intratumoral heterogeneity. Finally, we infer the malignant cell type-specific activity of transcription factors. By defining the regulatory logic of cancer cells, this work reveals an important reliance on oncogenic regulatory elements and highlights the ability of matched scRNA-seq/scATAC-seq to uncover clinically relevant mechanisms of tumorigenesis in gynecologic cancers.

Keywords: chromatin accessibility; endometrial cancer; enhancer elements; gastro-intestinal stromal tumors; gene regulation; intratumoral heterogeneity; ovarian cancer; scATAC-seq; scRNA-seq; single-cell genomics.


Conflict of interest statement

Declaration of interests The authors declare no competing interests.

Figures

Figure 1.
Figure 1.. Overview of matched scRNA-seq and scATAC-seq workflow for patient tumors.
A) Cartoon showing patient tumor workflow. The female reproductive system cartoons, top, were created with BioRender.com. B) UMAP plot all scRNA-seq cells color-coded by cell type across 11 patient tumors (left). UMAP plot of all scATAC-seq cells color-coded by inferred cell type across 11 patient tumors (right).Color shades denote subclusters within each cell type. C) UMAP plot of scRNA-seq cells (left) and scATAC-seq cells (right) as shown in panel B but color-coded by patient of origin. D) Stacked bar charts showing contribution of each patient to each subcluster in scRNA-seq (left) and to each inferred cell type subcluster in scATAC-seq (right).
Figure 2.
Figure 2.. Systematic in silico identification of cancer-specific distal regulatory elements.
A) Cartoon showing peak-to-gene correlation analysis with an eFDR (top).Histograms of correlation values and raw p-values for n=2,748,906 peak-to-gene link tests (middle) and peak-to-gene link tests under the null condition (bottom). Dashed red lines represent the alpha threshold or raw p-value cutoff of 1e-12 for calling statistically significant peak-to-gene links. B) Row-scaled heatmaps of statistically significant distal peak-to-gene links. Each row represents expression of a gene (left) correlated to accessibility of a distal peak (right). Cancer-enriched k-means clusters are marked in red. Distal peaks participating in cancer-enriched k-means groups are used in the overlap analysis presented in panel C. C) Venn diagram showing the number of cancer-specific distal peaks (orange) after overlapping the genomic coordinates of cancer-enriched distal peaks with the genomic coordinates of normal ovarian surface epithelium enhancer elements, normal fallopian tube enhancer elements, and all ENCODE regulatory element annotations (gray). D) Bar charts comparing proportion of distal peaks per number of linked genes between cancer-specific (orange) and normal (gray) distal peak groups (left).Bar chart comparing mean number of linked genes per distal peak between cancer-specific (orange) and normal (gray) distal peak groups (right). Asterisks denote a statistically significant difference (Wilcoxon Rank Sum test). Error bars represent ±1 S.E.M. E) Browser track showing the accessibility profile at the RHEB locus across all malignant subclusters (orange) and select non-malignant subclusters (gray) (left). Putative cancer-specific dREs for RHEB are highlighted by light blue shadows. Matching scRNA-seq expression of RHEB is shown for each subcluster (middle). Asterisks denote a statistically significant difference in gene expression between cells in the 3-Ovarian cancer subcluster and all remaining subclusters (average logFC > 1.0 & Bonferroni-corrected p-value <0.01, Wilcoxon Rank Sum test). Relative expression of mTOR pathway members is shown in the box plot (right). Asterisks denote statistically significant differences in mTOR pathway expression across all subclusters (Kruskal-Wallis test, p-value <0.01). Known regulatory element annotations, as used in panel C, are shown below the browser track. Peak-to-gene loops show the correlation value between peak accessibility and RHEB expression (bottom). F) Kaplan-Meier survival curve based on progression-free survival for 614 OC patients stratified by high and low RHEBexpression.
Figure 3.
Figure 3.. A cancer-specific distal regulatory element helps drive IMPA2 expression within the Endometroid Endometrial Cancer patient cohort.
A) UMAP plot of scRNA-seq cells color-coded by cell types found in Patients 1–5 (left). UMAP plot of scATAC-seq cells color-coded by inferred cell type across Patients 1–5 (right). B) UMAP plot of scRNA-seq cells as shown in panel A but color-coded by patient of origin (left). UMAP plot of scATAC-seq cells as shown in panel A but color-coded by patient of origin (right). C) Stacked bar charts showing contribution of each patient to each subcluster. D) Row-scaled heatmaps of statistically significant distal peak-to-gene links where each row represents expression of a gene (left) correlated to accessibility of a distal peak (right). Select k-means clusters containing IMPA2 are marked in red text. E) Browser track showing the accessibility profile at the IMPA2 locus across all cell type subclusters (left). Subclusters are color-coded either malignant (orange) or non-malignant (gray). Putative cancer-specific dRE of IMPA2 is highlighted by the light blue shadow. Matching scRNA-seq expression of IMPA2 is shown for all subclusters (right). Asterisks denote a statistically significant difference in gene expression between cells in marked subclusters when aggregated (average logFC = 0.23 & Bonferroni-corrected p-value <0.01, Wilcoxon Rank Sum test). Known regulatory element annotations for normal ovarian surface epithelium, normal fallopian tube, and ENCODE, are shown below the browser track. Peak-to-gene loops show the correlation value between peak accessibility and IMPA2 expression (bottom). F) Kaplan–Meier survival curve based on recurrence-free survival for 422 Uterine Corpus Endometrial Carcinoma (UCEC) patients stratified by high and low IMPA2 expression.
Figure 4.
Figure 4.. Malignant populations of the High-Grade Serous Ovarian Cancer patient cohort acquire novel enhancer-like elements that drive LAPTM4B expression.
A) UMAP plot of scRNA-seq cells color-coded by cell types found in Patients 8 and 9 (left). UMAP plot of scATAC-seq cells color-coded by inferred cell type across Patients 8 and 9 (right). B) UMAP plot of scRNA-seq cells as seen in panel A but color-coded by patient of origin (left). UMAP plot of scATAC-seq cells as seen in panel A but color-coded by patient of origin (right). C) Row-scaled heatmaps of statistically significant distal peak-to-gene links where each row represents expression of a gene (left) correlated to accessibility of a distal peak (right). Select k-means clusters containing LAPTM4B are marked in red text. D) Browser track showing the accessibility profile at the LAPTM4B locus across all subclusters (left). Subclusters are color-coded either malignant (orange) or non-malignant (gray). Putative dREs of LAPTM4B are highlighted by light blue shadows. Matching scRNA-seq expression of LAPTM4B is shown in the box plot (right) for all subclusters. Asterisks denote a statistically significant difference in gene expression between cells in marked subclusters when aggregated (average logFC = 1.77 & Bonferroni-corrected p-value <0.01, Wilcoxon Rank Sum test). Known regulatory element annotations for normal ovarian surface epithelium, normal fallopian tube, and ENCODE, are shown below the browser track. Peak-to-gene loops show the correlation value between peak accessibility and LAPTM4B expression (bottom). E) Kaplan-Meier survival curve based on overall survival for 1,656 OC patients stratified by high and low LAPTM4B expression. F) Summary cartoon and table of Find Individual Motif Occurrences (FIMO) predictions within Enhancer 2, Enhancer 4 and LAPTM4B promoter (top, middle, bottom, respectively). Matching scRNA-seq TF expression in the malignant fraction of Patient 9 is shown in the box plots (right).
Figure 5.
Figure 5.. Functional validation of cancer-specific LAPTM4B regulatory model in high-grade serous ovarian cancer cells.
A) Browser track showing the accessibility profile at the LAPTM4B locus, as in Fig. 4D, but between malignant (orange) and non-malignant (gray) fractions of the HGSOC patient cohort. Coverage is normalized by sequencing depth as well as reads in TSS regions. Known regulatory element annotations for normal ovarian surface epithelium, normal fallopian tube, and ENCODE, are shown below the browser track. B) Cartoon of dCas9-KRAB mediated CRISPR interference. C) Western blot of OVCAR3 cells stably expressing dCas9-KRAB. D) RT-qPCR results showing expression of LAPTM4B after dCas9-KRAB mediated repression of Enhancer 2 and Enhancer 3. Expression is shown as fold change relative to ACTB expression. E) Cartoon depicting inferred TF-mediated enhancer-promoter connections. F) RT-qPCR results of LAPTM4B expression after siRNA-mediated knockdown of GAPDH and predicted TF regulators: YY1, CEBPD, and KLF6. Expression is shown as fold change relative to ACTB expression. G) RT-qPCR results of expression of TF regulators after siRNA knockdown. Expression is shown as fold change relative to ACTB expression. H) RT-qPCR results of expression of GAPDH after siRNA-mediated knockdown of GAPDH and TF regulators. Expression is shown as fold change relative to ACTB expression. Data in D, F, G, and H shown as mean ± S.E.M.; *p< 0.05, **p< 0.01, ***p< 0.001, one-tailed Welch’s t-test.
Figure 6.
Figure 6.. Functional scoring of cell type-specific enhancer activity and their cognate transcription factors helps prioritize potential therapeutic targets across gynecologic malignancies.
A) Cartoon of matrix operations performed in the Total Functional Score of Enhancer Elements (TFSEE) method. Only malignant cell type clusters with 100% patient specificity were chosen for TFSEE analysis. B) Unsupervised hierarchical clustering heatmap of cell type normalized TFSEE scores (n=102 TFs across active enhancers). Each row of the heatmap represents TF activity across cell type-specific enhancers enriched in each column. Predicted druggability status for each TF is marked with druggable/not druggable according to the canSAR database. C) Rank-ordered plot showing the difference in scaled TFSEE score for each TF between subclone 1 (orange) and subclone 2 (blue) of the Patient 6 tumor representing serous EC. Each point represents a TF and is colored by predicted druggability status. Notable TFs enriched in either condition (subclone 1/subclone 2) are labeled in light blue regions of the plot. D) Rank-ordered plot showing the difference in scaled TFSEE score for each TF between carcinoma (pink) and sarcoma (green) fractions of the Patient 10 tumor representing carcinosarcoma OC. Each point represents a TF and is colored by predicted druggability status. Notable TFs enriched in either condition (sarcoma/carcinoma) are labeled in light blue regions of the plot.

References

    1. AKDEMIR KC, LE VT, CHANDRAN S, LI Y, VERHAAK RG, BEROUKHIM R, CAMPBELL PJ, CHIN L, DIXON JR & FUTREAL PA 2020. Disruption of chromatin folding domains by somatic genomic rearrangements in human cancer. Nature genetics, 52, 294–305. - PMC - PubMed
    1. ARAN D, LOONEY AP, LIU L, WU E, FONG V, HSU A, CHAK S, NAIKAWADI RP, WOLTERS PJ, ABATE AR, BUTTE AJ & BHATTACHARYA M 2019. Reference-based analysis of lung single-cell sequencing reveals a transitional profibrotic macrophage. Nat Immunol, 20, 163–172. - PMC - PubMed
    1. BAILEY TL, BODEN M, BUSKE FA, FRITH M, GRANT CE, CLEMENTI L, REN J, LI WW & NOBLE WS 2009. MEME SUITE: tools for motif discovery and searching. Nucleic Acids Res, 37, W202–8. - PMC - PubMed
    1. BAILEY TL, JOHNSON J, GRANT CE & NOBLE WS 2015. The MEME Suite. Nucleic Acids Res, 43, W39–49. - PMC - PubMed
    1. BANERJI U 2014. A Phase I Trial of the Combination of AZD2014 and Weekly Paclitaxel [Online]. Available: https://ClinicalTrials.gov/show/NCT02193633 [Accessed].

Publication types

MeSH terms