. 2022 Feb 16;13(2):131-142.e13.
doi: 10.1016/j.cels.2021.10.002. Epub 2021 Nov 4.

A synthetic gene circuit for imaging-free detection of signaling pulses

Affiliations

A synthetic gene circuit for imaging-free detection of signaling pulses

Pavithran T Ravindran et al. Cell Syst. .

Abstract

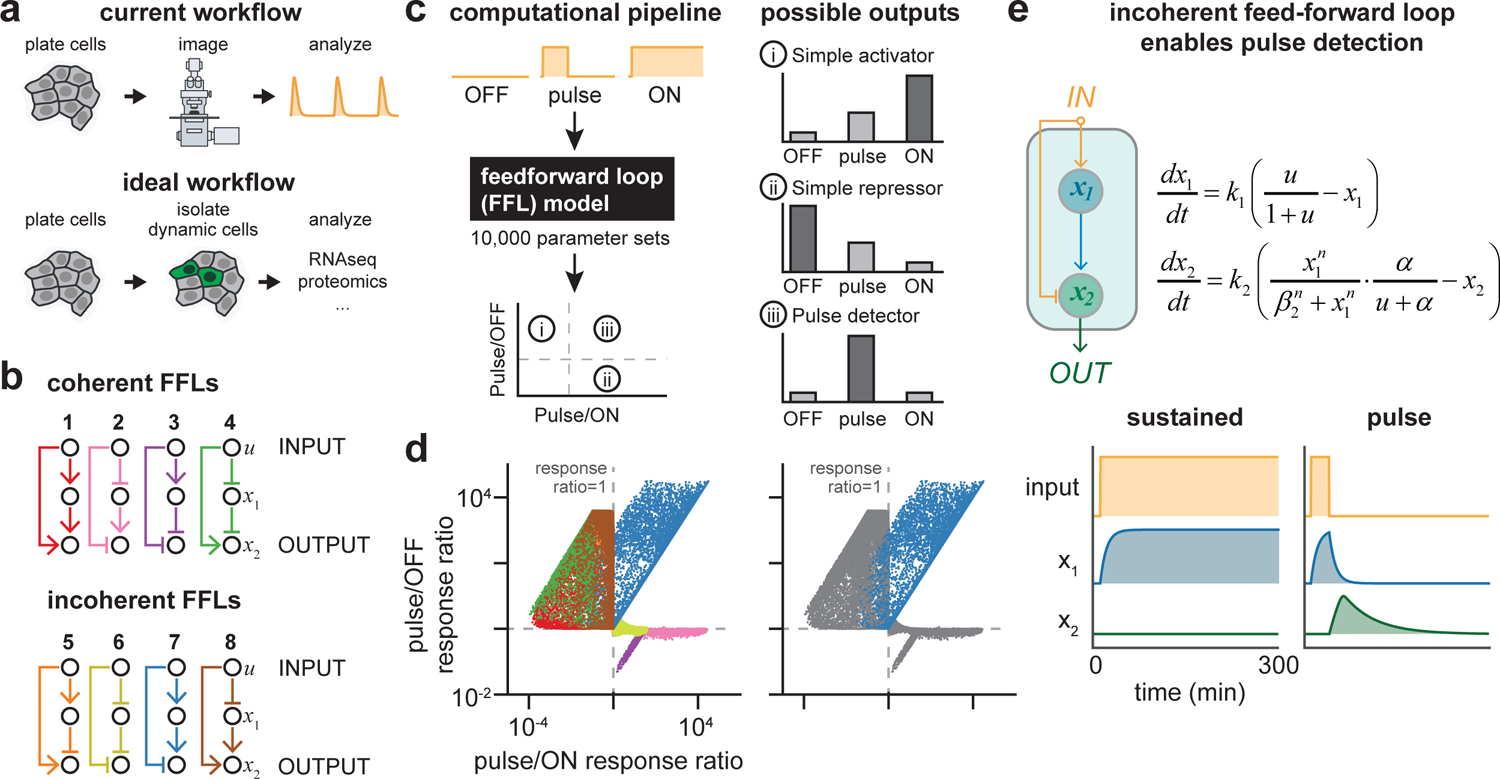
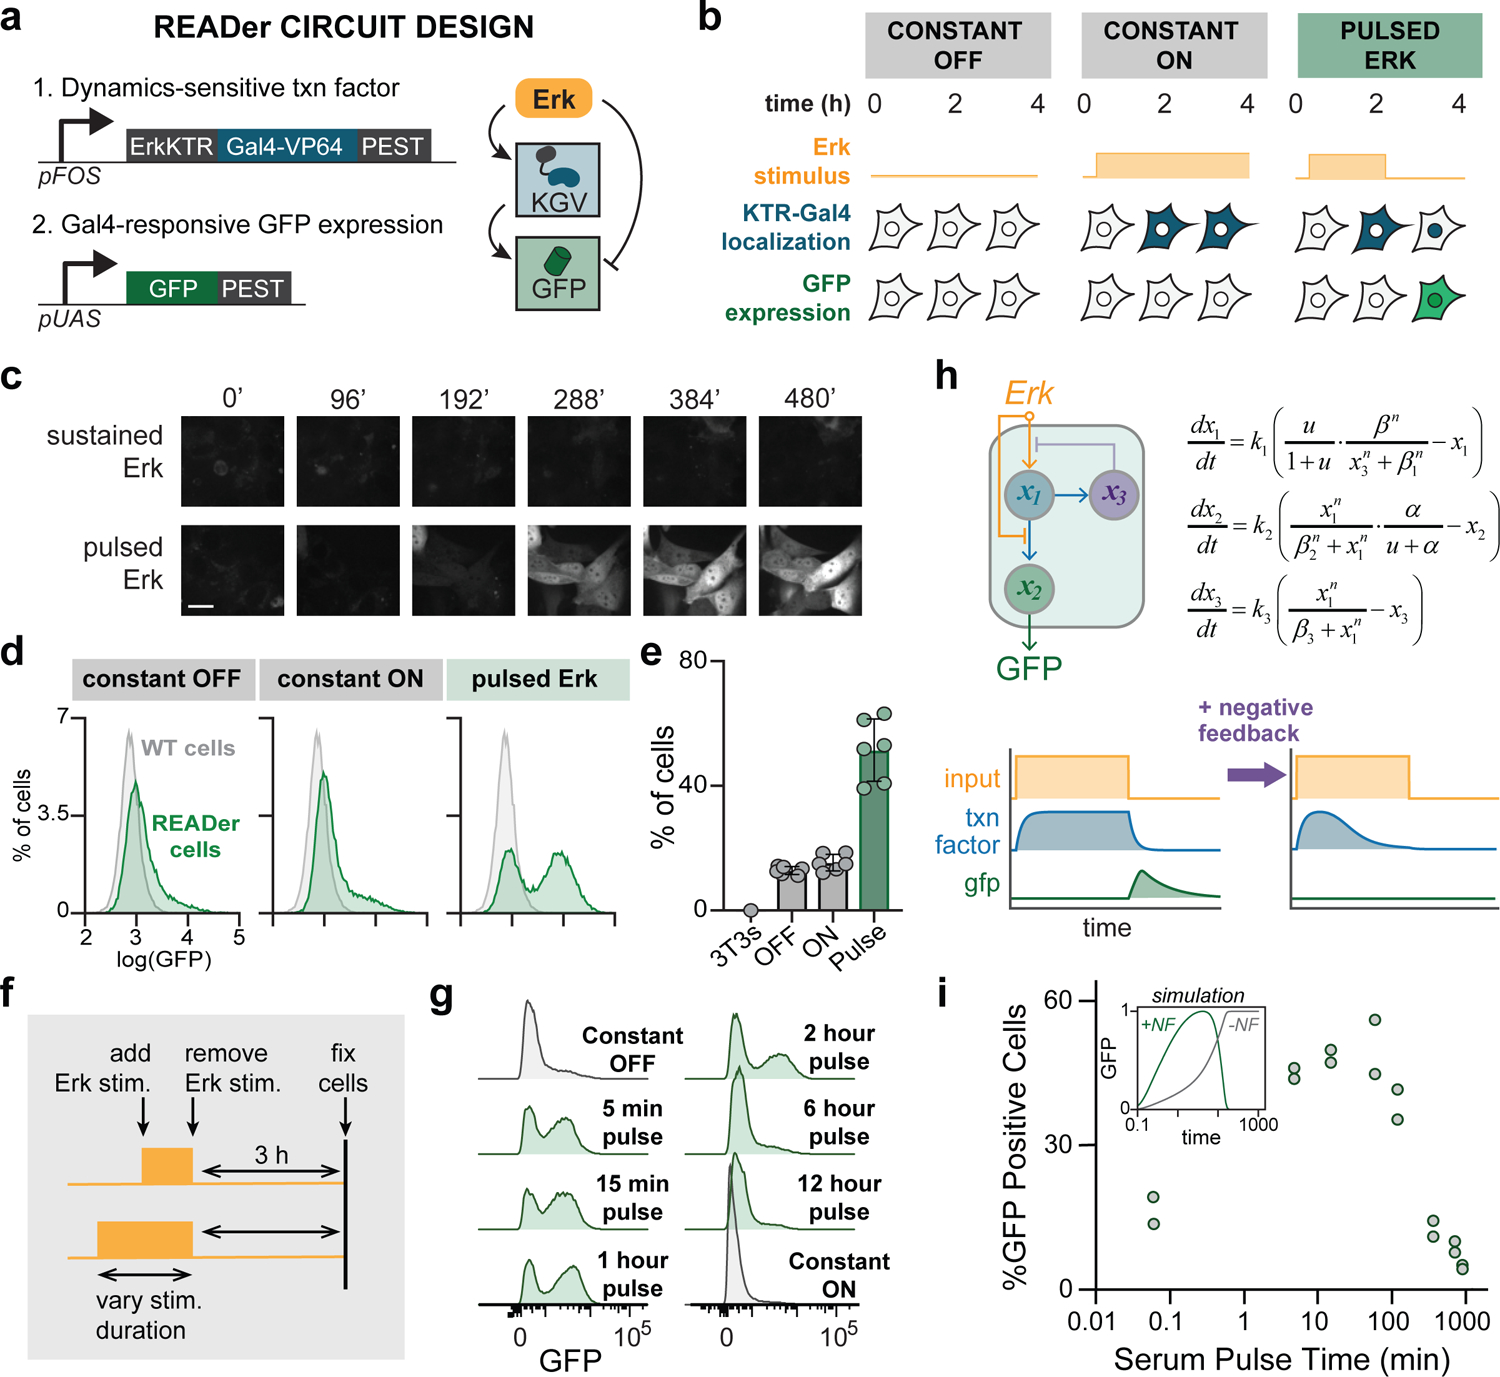
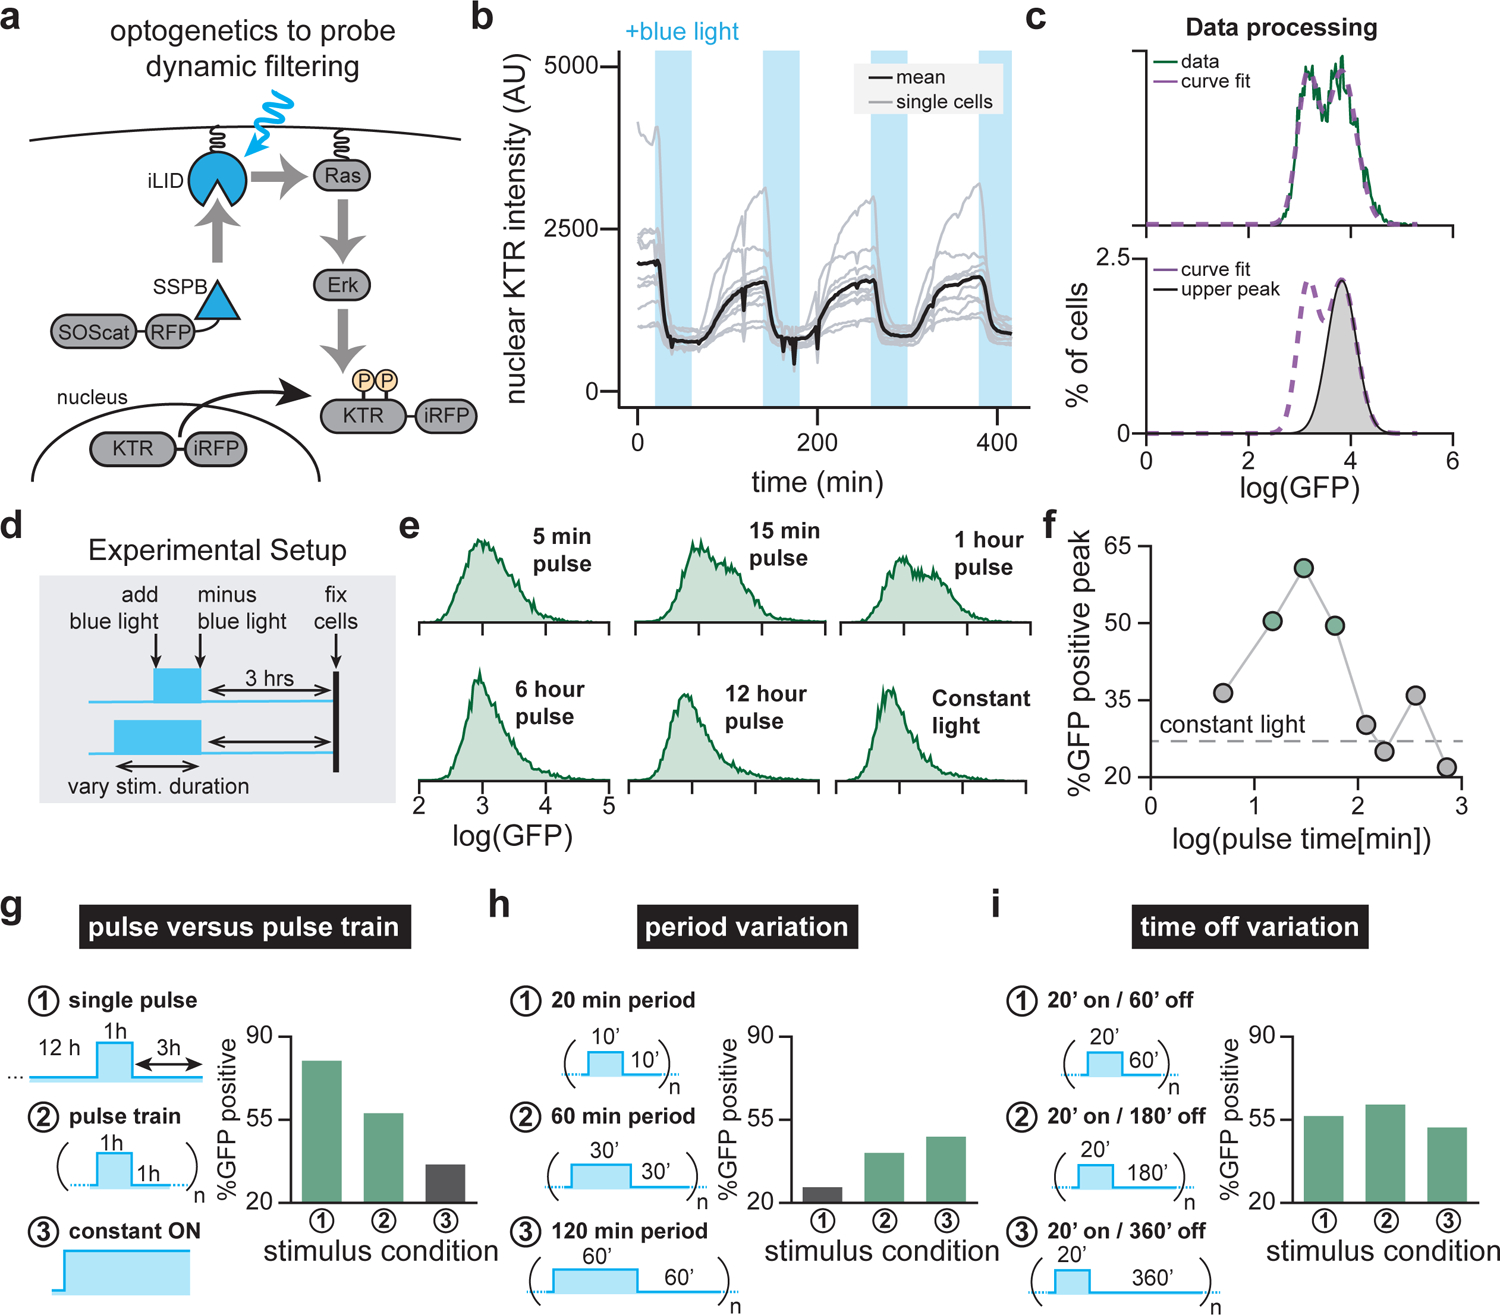
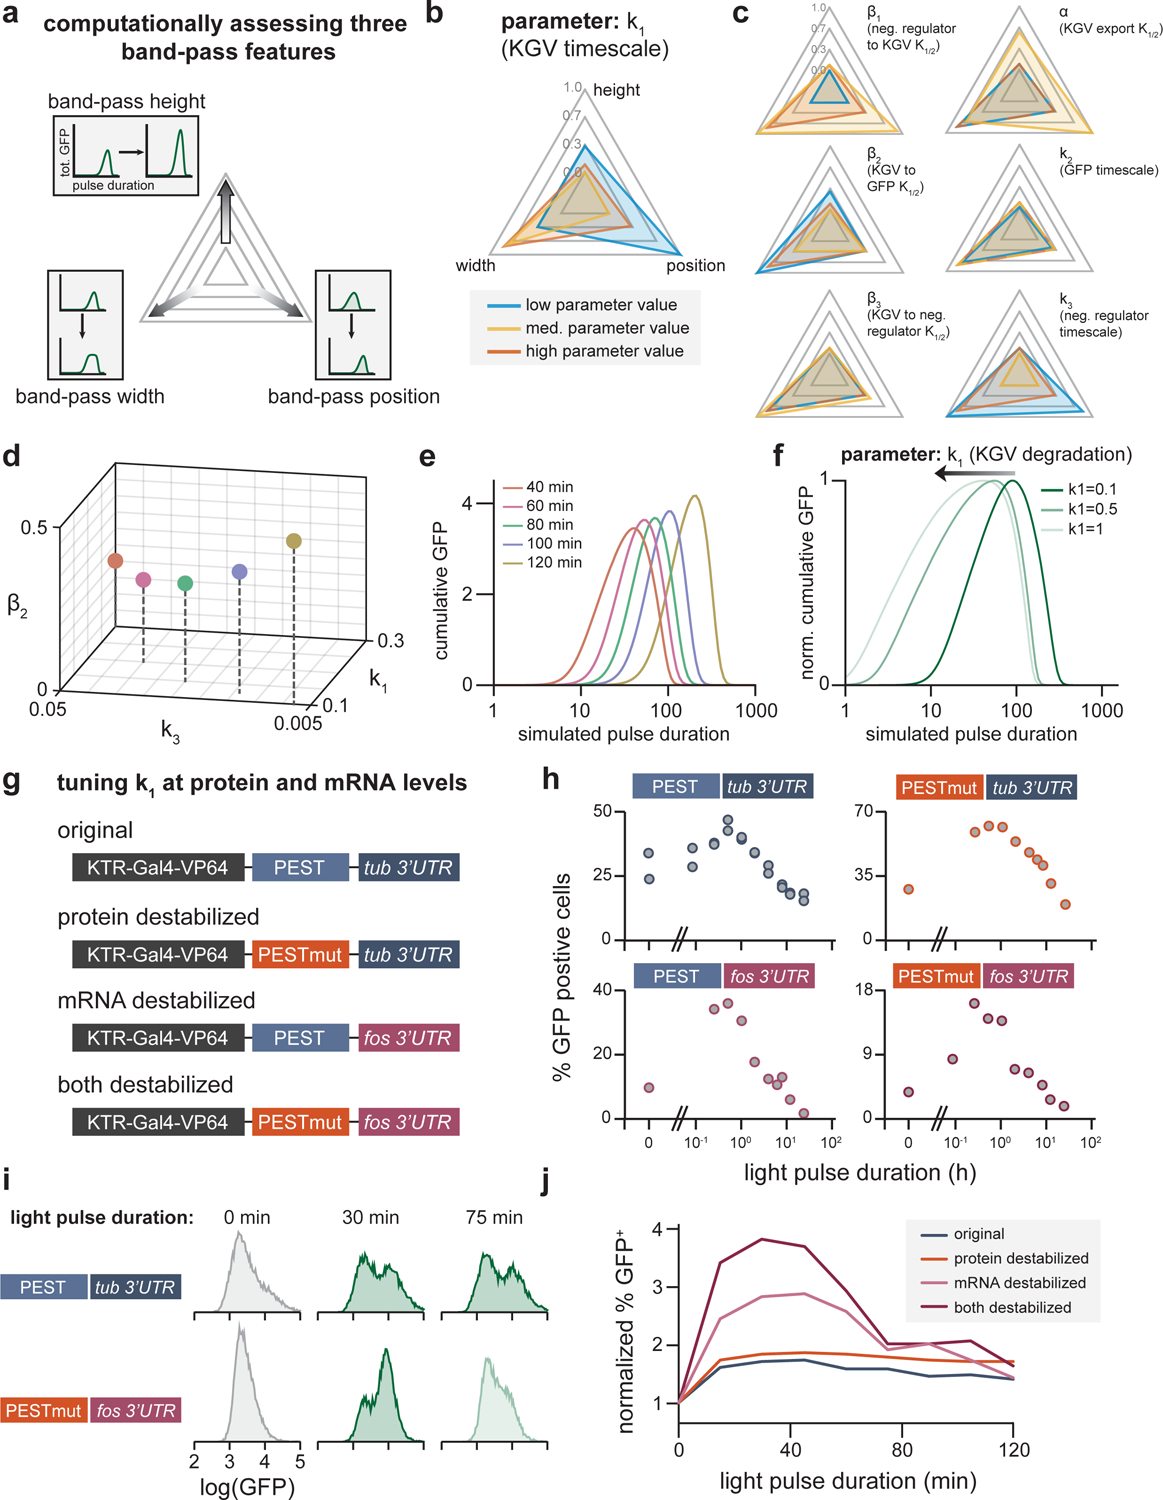
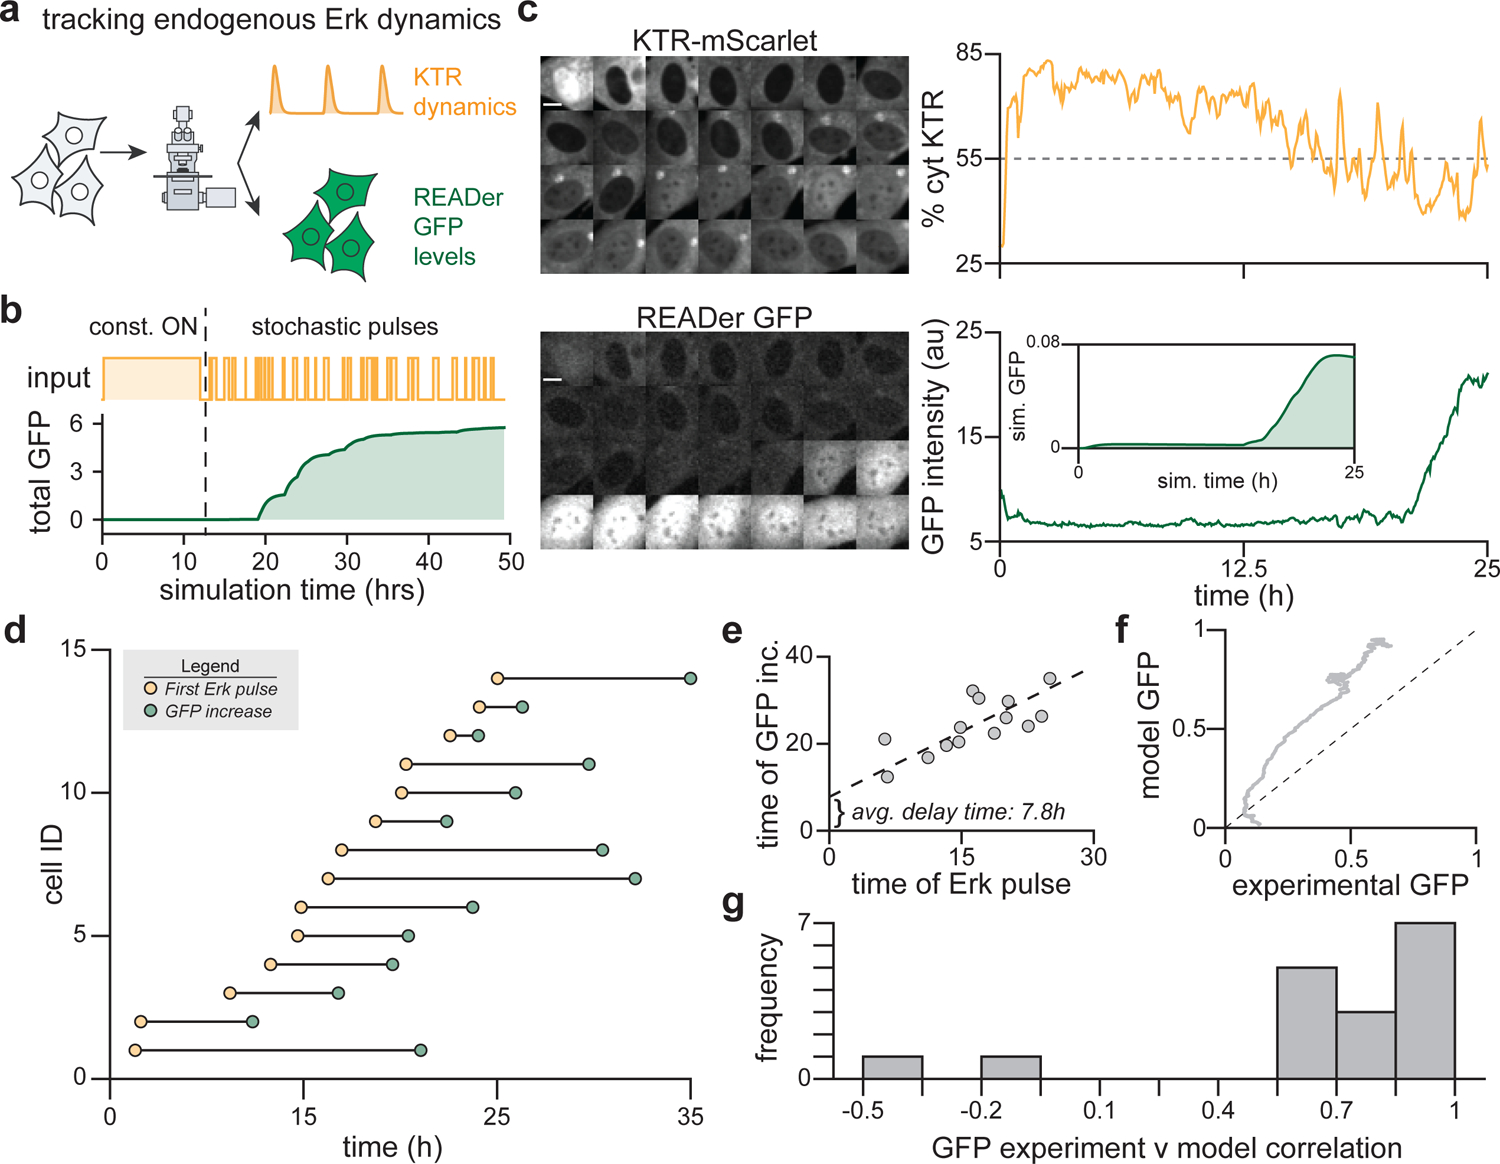
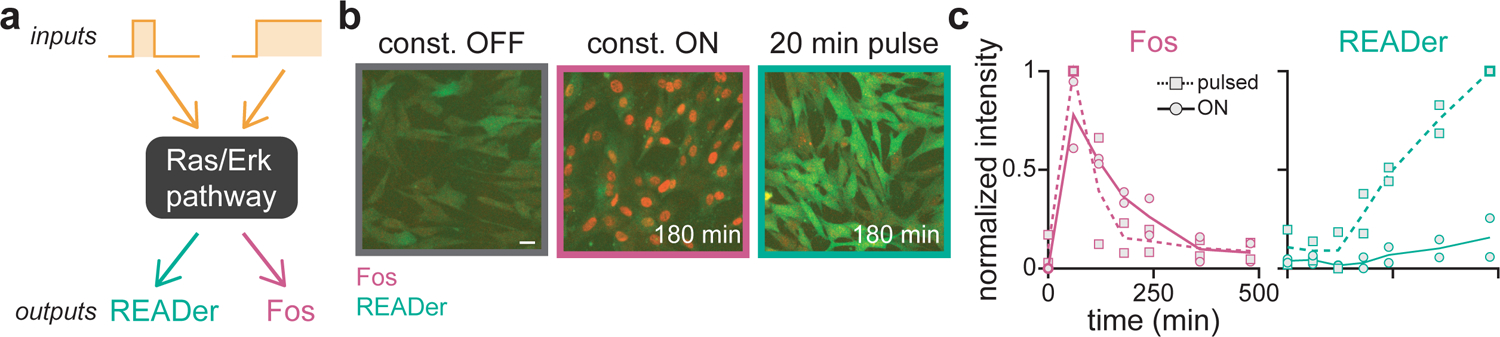
Cells employ intracellular signaling pathways to sense and respond to changes in their external environment. In recent years, live-cell biosensors have revealed complex pulsatile dynamics in many pathways, but studies of these signaling dynamics are limited by the necessity of live-cell imaging at high spatiotemporal resolution. Here, we describe an approach to infer pulsatile signaling dynamics from a single measurement in fixed cells using a pulse-detecting gene circuit. We computationally screened for circuits with the capability to selectively detect signaling pulses, revealing an incoherent feedforward topology that robustly performs this computation. We implemented the motif experimentally for the Erk signaling pathway using a single engineered transcription factor and fluorescent protein reporter. Our "recorder of Erk activity dynamics" (READer) responds sensitively to spontaneous and stimulus-driven Erk pulses. READer circuits open the door to permanently labeling transient, dynamic cell populations to elucidate the mechanistic underpinnings and biological consequences of signaling dynamics.

Keywords: cell signaling; network motifs; signaling dynamics; synthetic biology.


Conflict of interest statement

Declaration of interests J.E.T. is a member of the advisory board of Cell Systems. The authors declare no competing interests.

Figures

Figure 1.
Figure 1.. A computational screen for pulse-detecting gene circuits.
(a) Workflows for studying signaling dynamics. Currently, signaling dynamics are typically obtained from live-imaging of individual cells, limiting throughput. In an alternative workflow, dynamics could be inferred from a single fluorescence measurement, enabling rapid and scalable isolation of dynamic cells for downstream analyses. (b) Coherent and incoherent feed-forward loop (FFL) topologies screened for pulse detection. (c) Computational screen workflow: constant-off, constant-on and pulsed inputs were applied to 10,000 random parameterizations of each network shown in b. Circuits exhibiting pulse detection would lie in quadrant 3, where responses to pulsed inputs exceed those of either ON or OFF stimuli. (d) Responses of all circuits from the computational screen. Each point represents a single parameterization of an FFL circuit colored as in b (left), or with only Circuit 7 colored (right). (e) Representative time course of Circuit 7 simulated with either a constant-on (left) or pulsed input (right), along with the model equations representing Circuit 7.
Figure 2.
Figure 2.. Experimental implementation of pulse detection for the Erk signaling pathway.
(a) Schematic of the Recorder of Erk Activity Dynamics (READer) circuit. An Erk-responsive promoter drives expression of a KTR-Gal4-VP64 (KGV) fusion protein, which in turn triggers expression of a GFP reporter. Destabilization (PEST) sequences are added to both components to ensure rapid degradation and ‘resetting’ in the absence of stimulus. (b) Illustration of READer circuit logic. Under constant-off stimuli, KGV and GFP levels remain low. A constant-on stimulus drives KGV expression and nuclear export, preventing GFP production. In response to an input pulse, KGV is first expressed and then imported into the nucleus, leading to high GFP expression. (c) Images of NIH3T3 READer cells exposed to constant serum or a 1 h serum pulse. Scale bar: 20 μm. (d) Flow cytometry histograms of GFP from parental NIH3T3 (gray) or READer cells (green) incubated in growth factor free media (constant OFF), 10% serum (constant ON) or a one-hour pulse of 10% serum. (e) Quantification of data from d in all three conditions. Data is quantified from 2 wells each for 3 independent replicates. Error bars represent standard deviation. (f) Mapping how pulse duration affects READer circuit output. Serum inputs of varying duration were applied to cells, which were fixed 3 h after the end of the pulse. (g) GFP histograms obtained by flow cytometry for the experimental workflow in f. (h) An extended mathematical model of the READer circuit incorporating negative feedback on Erk target gene induction. An input u (gold) stimulates intermediate node x1 (blue), which produces a negative regulator x3 (purple) that inhibits the production of x1. (i) Quantification of flow cytometry data in g, showing data from 2 experimental replicates. Inset shows simulated results from the model from h, with (green) or without (gray) negative feedback.
Figure 3.
Figure 3.. OptoSOS enables characterization of READer dynamic filtering.
(a) Diagram of the OptoSOS system and ErkKTR biosensor. Blue light drives heterodimerization between tagRFP-SSPB-SOScat and membrane-localized iLID-CAAX. Upon recruitment to the membrane, SOScat activates Ras/Erk signaling. Phosphorylation of the ErkKTR-irFP biosensor by Erk leads to its export from the nucleus. (b) Single-cell traces showing nuclear ErkKTR-iRFP during cycles of optogenetic stimulation. Blue bars indicate periods of optogenetic illumination. Curves represent single cells (gray lines, n = 11 cells) and the mean of all cells (black line) from a single experiment. (c) Data processing pipeline for all READer optogenetic experiments. The GFP histogram is fit to a sum of two Gaussians (top) and then the area under the curve of each Gaussian is used to estimate the fraction of GFP-high cells (bottom). (d) Mapping how optogenetic pulse stimulation affects READer circuit output. Light inputs of varying duration were applied to cells, which were fixed 3 h after the end of the pulse. (e) GFP histograms for OptoSOS READer cells subjected to the experimental workflow shown in d. (f) Quantification of flow cytometry data in e (points) as well as constant-on control (gray dotted line). See Figure 4H for results from an independently derived clonal cell line. (g) READer responses to a single pulse versus oscillatory stimulus. Cells were exposed to (1) a single 1 h light pulse followed by 3 h in darkness before fixation, (2) a pulse train of alternating 1 h on/1 h off periods for 16 h or (3) constant light for 16 h. (h) READer responses at various oscillation periods. Cells were given pulse trains at various periods T, each at 50% duty cycle, for 12 h: (1) T = 20 min, (2) T = 60 min or (3) T = 120 min. (i) READer responses to various times between pulses. Repeated 20 min pulses were delivered every 60 min (case 1), 180 min (case 2) or 360 min (case 3) for a total of 12 h, with each leading to comparable GFP responses. For g-i, data is shown from one of two independent replicates.
Figure 4.
Figure 4.. Altering band-pass filtering by tuning READer circuit parameters.
(a) Schematic of plots showing band-pass features as parameters are varied. For the mathematical model described in Figure 2H, each parameter was varied from 100-fold up and down the baseline value. The resulting band-pass curves were then analyzed for three features: band-pass height (maximum GFP response across all pulse durations), band-pass width (the span of durations achieving half-maximal GFP response) and band-pass position (the pulse duration that results in maximal GFP). (b) Example radar chart showing the results of the parameter scan for the relative changes in all three band-pass features. The lowest, baseline and maximum values of the parameter are shown in blue, yellow, and red, respectively. The further away from the center, the higher the value a particular simulation has for that feature. (c) Radar charts for remaining parameters as displayed in b. (d-e) Simultaneously tuning k1, k3, and β2 enables more complete control over band-pass filtering. For the altered parameter values shown (in d), band-pass responses exhibited shifted positions but similar widths and amplitudes (in e). (f) Simulated band pass curves (GFP output for pulses of different duration) produced for different values of the x1 node’s stability (parameter k1). (g) Schematic of altered READer circuits implementing enhanced mRNA or protein degradation. (h) Experimentally measured band-pass responses for all four READer circuit variants after stimulation with light pulses as in Figure 3. (i) Representative GFP histograms for the “original” and “both destabilized” READer variants incubated in constant dark conditions, 30 minutes of blue light or 75 minutes of blue light, indicating that the destabilized circuit rejects the 75 min pulse but responds to the 30 min pulse. (j) Quantification of fold-change in the GFP+ fraction between unstimulated and pulse-stimulated conditions for all four READer circuit variants in response to optogenetic pulses of the indicated lengths. Combined mRNA/protein destabilization results in narrow band-pass filtering and a high fold-change between unstimulated and pulsed conditions.
Figure 5.
Figure 5.. READer detects endogenous Erk pulses.
(a) NIH3T3 READer cells transduced with ErkKTR-mScarlet can be used to simultaneously visualize Erk activity dynamics and READer GFP output in single cells. (b) Simulated READer response during the switch from constant-on to stochastic pulses of Erk activity using the model from Figure 2H. (c) Images and quantification from a representative READer cell expressing ErkKTR-mScarlet stimulated with serum at time 0 and imaged for 2 days; see Figure S7 for full trajectories of all cells. Confocal images and quantification of the ErkKTR-mScarlet cytosolic fraction and GFP intensity are shown. Inset shows the simulated GFP response when the same pulsatile ErkKTR-mScarlet trace is used as a model input (see Supplementary Information). Scale bars: 10 μm. (d) Quantification of all cell trajectories (n = 17 cells from a representative experiment) for the time at which the cytoplasmic ErkKTR fraction first falls below 55% (yellow points) and when GFP intensity rises 25% above its initial level (green points). Note that 3 cells fail to cross at least one of these thresholds during the entire time course and are thus excluded from this plot. (e) Plot of data from d with best-line fit, revealing a delay time of ~7.8 h between initiation of Erk pulses and the GFP increase. (f) Comparison of overall experimental GFP induction to modeled GFP output for each cell; see Figure S7 for all individual experimental and simulated trajectories. The mean GFP induction is shown at each timepoint for all simulated and experimental data; dotted line shows identical values. (g) Histogram of correlation coefficients between modeled and experimental GFP induction for each cell as in f.
Figure 6.
Figure 6.. READer provides distinct information from the canonical Erk target gene Fos.
(a) Although both READer and the canonical Erk target gene Fos report on the shared Ras/Erk pathway, they may be predicted to respond to distinct (transient vs sustained) dynamics. (b) Representative images of NIH3T3 READer cells that were fixed after overnight incubation in growth factor free media (off), after a 20 min pulse of serum followed by 180 min of GF-free media (transient), or after 180 min after stimulation with constant 10% serum (sustained). Cells were stained for Fos protein (red) and imaged for GFP (green). Scale bar: 20 μm. (c) Quantification of Fos immunofluorescence (left) and GFP fluorescence (right) from cells stimulated as in b and incubated for the indicated times in continuous growth media (sustained) or after a 20 min pulse of 10% serum (transient). Points represent the mean normalized intensity across all cells for sustained (square points) and transient (circles) stimuli; lines represent overall means across two biological replicates. See Figure S8 for full READer/Fos joint distributions.

Comment in

References

    1. Adler M, Szekely P, Mayo A & Alon U Optimal Regulatory Circuit Topologies for Fold-Change Detection. Cell Syst. 4, 171–181.e8 (2017). - PubMed
    1. Albeck JG, Mills GB, and Brugge JS (2013). Frequency-modulated pulses of ERK activity transmit quantitative proliferation signals. Mol Cell 49, 249–261. - PMC - PubMed
    1. Alon U (2007). Network motifs: theory and experimental approaches. Nat Rev Genet 8, 450–461. - PubMed
    1. Aoki K, Kumagai Y, Sakurai A, Komatsu N, Fujita Y, Shionyu C, and Matsuda M (2013). Stochastic ERK activation induced by noise and cell-to-cell propagation regulates cell density-dependent proliferation. Mol Cell 52, 529–540. - PubMed
    1. Basu S, Mehreja R, Thiberge S, Chen MT, and Weiss R (2004). Spatiotemporal control of gene expression with pulse-generating networks. Proc Natl Acad Sci U S A 101, 6355–6360. - PMC - PubMed

Publication types

MeSH terms

LinkOut - more resources